2
4
4
• Supply and demand are the two words that
economists use most often.
• Supply and demand are the forces that make
market economies work.
• A market is a group of buyers and sellers of a
particular good or service.
• The terms supply and demand refer to the
behavior of people . . . as they interact with one
another in markets.
MARKETS AND COMPETITION
• Buyers determine
demand
.
Competitive Markets
• A competitive
market is a market in which there
• Perfect Competition
• Products are the same• Numerous buyers and sellers so that each has no influence over price
• Buyers and Sellers are price takers
• Monopoly
• One seller, and seller controls price
• Oligopoly
• Few sellers• Not always aggressive competition
• Monopolistic Competition
• Many sellers
• Slightly differentiated products
• Each seller may set price for its own product
DEMAND
•
Quantity demanded is the amount of a good
that buyers are willing and able to purchase.
• Law of Demand
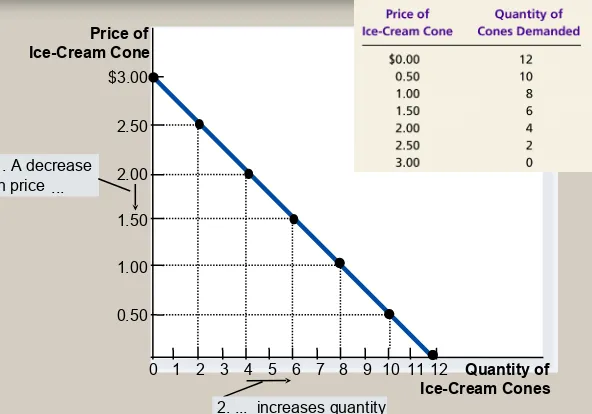
The Demand Curve: The Relationship
between Price and Quantity Demanded
• Demand Schedule
• The demand schedule is a table that shows the
The Demand Curve: The Relationship
between Price and Quantity Demanded
• Demand Curve
• The demand curve is a graph of the relationship between the price of a good and the quantity
Figure 1 Catherine’s Demand Schedule and Demand Curve Price of Ice-Cream Cone 0 2.50 2.00 1.50 1.00 0.50
1 2 3 4 5 6 7 8 9 10 11 Quantity of Ice-Cream Cones
$3.00
12 1. A decrease
in price ...
Market Demand versus Individual Demand
• Market demand refers to the sum of all
individual demands for a particular good or
service.
Shifts in the Demand Curve
• Change in Quantity Demanded
• Movement along the demand curve.
0
D
Price of Ice-Cream
Cones
Quantity of Ice-Cream Cones
A tax that raises the price of ice-cream
cones results in a movement along the
demand curve. A B 8 1.00 $2.00 4
Shifts in the Demand Curve
• Consumer income
• Prices of related goods • Tastes
• Expectations
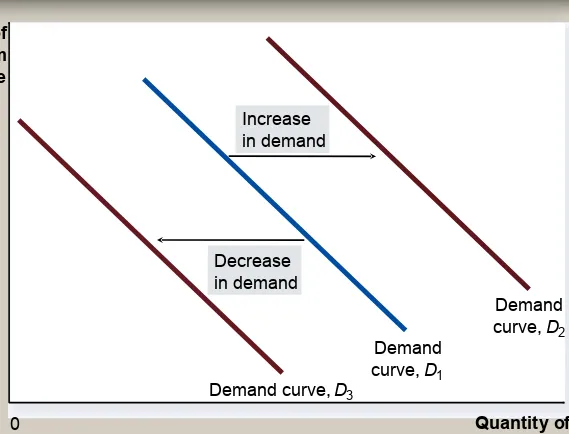
Shifts in the Demand Curve
• Change in Demand
• A shift in the demand curve, either to the left or right.
Figure 3 Shifts in the Demand Curve Price of Ice-Cream Cone Quantity of Ice-Cream Cones Increase in demand Decrease in demand
Demand curve, D3
Demand curve, D1
Demand curve, D2
Shifts in the Demand Curve
• Consumer Income
• As income increases the demand for a normal good
will increase.
$3.00 2.50 2.00 1.50 1.00 0.50 2
1 3 4 5 6 7 8 9 10 11 12
Price of Ice-Cream Cone Quantity of Ice-Cream Cones 0 Increase in demand An increase in income...
D
1D
2$3.00 2.50 2.00 1.50 1.00 0.50 2
1 3 4 5 6 7 8 9 10 11 12
Shifts in the Demand Curve
• Prices of Related Goods
• When a fall in the price of one good reduces the demand for another good, the two goods are called
substitutes.
• When a fall in the price of one good increases the demand for another good, the two goods are called
SUPPLY
•
Quantity supplied is the amount of a good that
sellers are willing and able to sell.
• Law of Supply
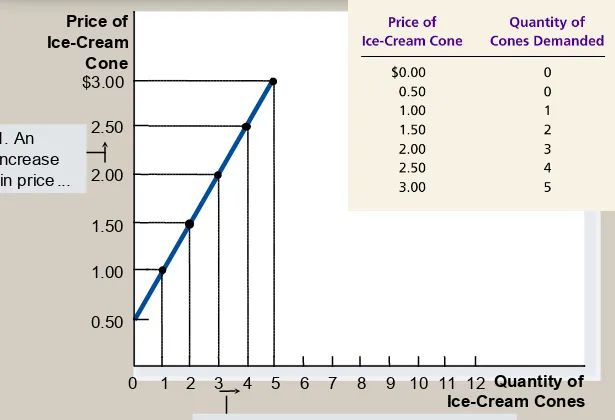
The Supply Curve: The Relationship between
Price and Quantity Supplied
• Supply Schedule
• The supply schedule is a table that shows the
The Supply Curve: The Relationship between
Price and Quantity Supplied
• Supply Curve
• The supply curve is the graph of the relationship between the price of a good and the quantity
Figure 5 Ben’s Supply Schedule and Supply Curve Price of Ice-Cream Cone 0 2.50 2.00 1.50 1.00
1 2 3 4 5 6 7 8 9 10 11 Quantity of
Ice-Cream Cones $3.00 12 0.50 1. An increase in price ...
Market Supply versus Individual Supply
• Market supply refers to the sum of all
individual supplies for all sellers of a particular
good or service.
Shifts in the Supply Curve
• Input prices
• Technology
• Expectations
Shifts in the Supply Curve
• Change in Quantity Supplied
• Movement along the supply curve.
1 5
Price of Ice-Cream Cone Quantity of Ice-Cream Cones 0
S
1.00 A C $3.00A rise in the price of ice cream cones results in a
movement along the supply curve.
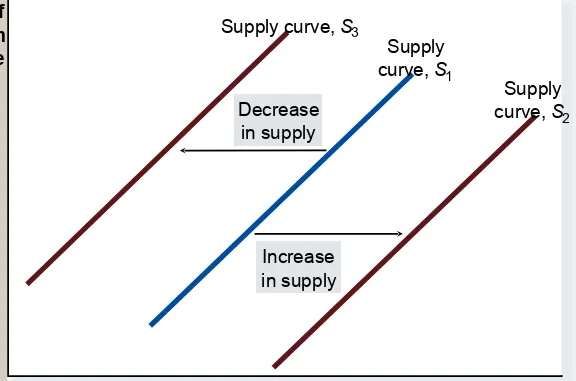
Shifts in the Supply Curve
• Change in Supply
• A shift in the supply curve, either to the left or right.
Figure 7 Shifts in the Supply Curve Price of Ice-Cream Cone Quantity of Ice-Cream Cones 0 Increase in supply Decrease in supply
Supply curve, S3
curve, Supply
S1
SUPPLY AND DEMAND
TOGETHER
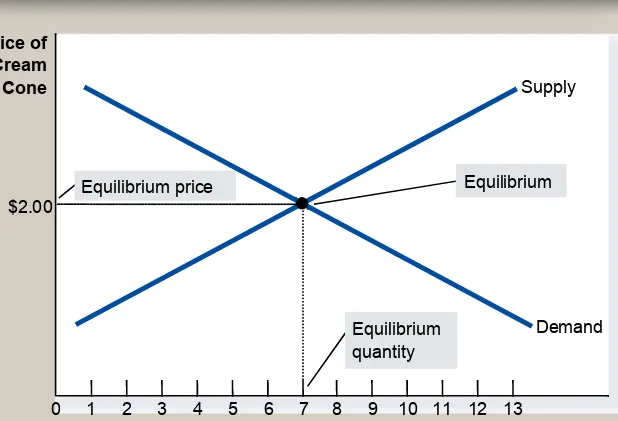
•
Equilibrium refers to a situation in which the
price has reached the level where quantity
SUPPLY AND DEMAND
TOGETHER
•
Equilibrium Price
• The price that balances quantity supplied and quantity demanded.
• On a graph, it is the price at which the supply and demand curves intersect.
•
Equilibrium Quantity
• The quantity supplied and the quantity demanded at the equilibrium price.
At $2.00, the quantity demanded
is equal to the quantity supplied!
SUPPLY AND DEMAND
TOGETHER
Figure 8 The Equilibrium of Supply and Demand
Price of Ice-Cream Cone
0 1 2 3 4 5 6 7 8 9 10 11 12
Quantity of Ice-Cream Cones
13 Equilibrium
quantity
Equilibrium price Equilibrium
Supply
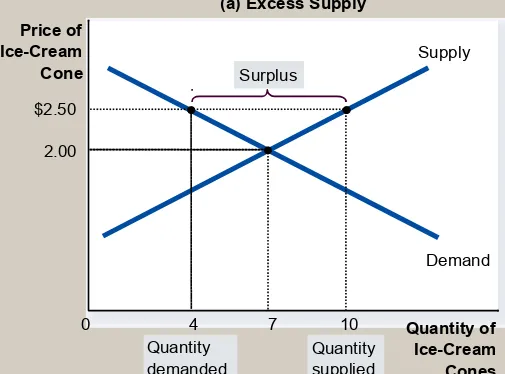
Figure 9 Markets Not in Equilibrium Price of Ice-Cream Cone 0 Supply Demand
(a) Excess Supply
Equilibrium
•
Surplus
• When price > equilibrium price, then quantity supplied > quantity demanded.
• There is excess supply or a surplus.
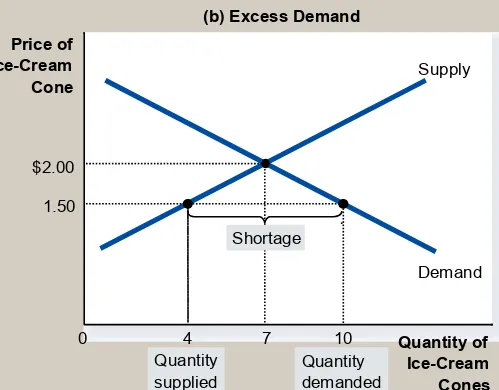
Equilibrium
•
Shortage
• When price < equilibrium price, then quantity demanded > the quantity supplied.
• There is excess demand or a shortage.
• Suppliers will raise the price due to too many buyers chasing too few goods, thereby moving toward
Figure 9 Markets Not in Equilibrium
Price of Ice-Cream Cone
0 Quantity of
Ice-Cream Cones
Supply
Demand
(b) Excess Demand
Equilibrium
•
Law of supply and demand
Three Steps to Analyzing Changes in
Equilibrium
• Decide whether the event shifts the supply or
demand curve (or both).
• Decide whether the curve(s) shift(s) to the left
or to the right.
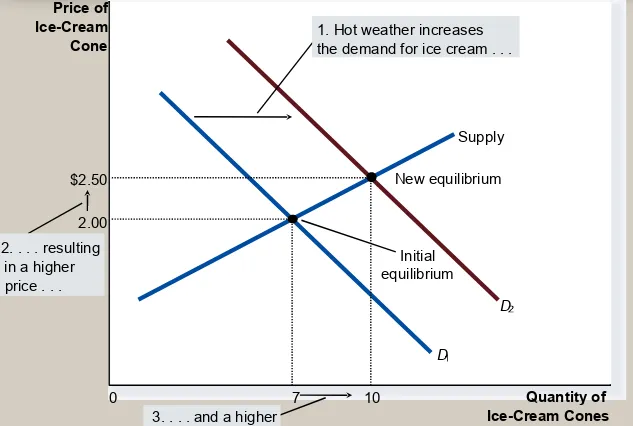
Figure 10 How an Increase in Demand Affects the Equilibrium
Price of Ice-Cream Cone
0 Quantity of Ice-Cream Cones Supply Initial equilibrium D D
3. . . . and a higher 2. . . . resulting
in a higher price . . .
1. Hot weather increases the demand for ice cream . . . 2.00
7
New equilibrium $2.50
Three Steps to Analyzing Changes in
Equilibrium
• Shifts in Curves versus Movements along
Curves
• A shift in the supply curve is called a change in supply.
• A movement along a fixed supply curve is called a change in quantity supplied.
• A shift in the demand curve is called a change in demand.
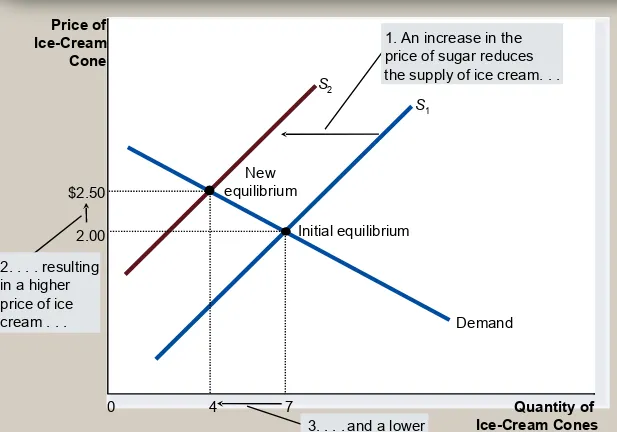
Figure 11 How a Decrease in Supply Affects the Equilibrium
Price of Ice-Cream Cone
0 Quantity of Ice-Cream Cones Demand New equilibrium Initial equilibrium S1 S2
2. . . . resulting in a higher price of ice cream . . .
1. An increase in the price of sugar reduces the supply of ice cream. . .
3. . . . and a lower 2.00
7 $2.50
Summary
• Economists use the model of supply and
demand to analyze competitive markets.
• In a competitive market, there are many buyers
and sellers, each of whom has little or no
Summary
• The demand curve shows how the quantity of a
good depends upon the price.
• According to the law of demand, as the price of a good falls, the quantity demanded rises. Therefore, the demand curve slopes downward.
• In addition to price, other determinants of how much consumers want to buy include income, the prices of complements and substitutes, tastes,
expectations, and the number of buyers.
Summary
• The supply curve shows how the quantity of a
good supplied depends upon the price.
• According to the law of supply, as the price of a good rises, the quantity supplied rises. Therefore, the supply curve slopes upward.
• In addition to price, other determinants of how much producers want to sell include input prices, technology, expectations, and the number of sellers. • If one of these factors changes, the supply curve
Summary
• Market equilibrium is determined by the
intersection of the supply and demand curves.
• At the equilibrium price, the quantity demanded
equals the quantity supplied.
Summary
• To analyze how any event influences a market,
we use the supply-and-demand diagram to
examine how the even affects the equilibrium
price and quantity.