200
OF WORDSMITH 3.0 AS A TEXTBOOK
EVALUATION INSTRUMENT:
A CASE STUDY
Jayakaran Mukundan Anealka Aziz Hussin
Universiti Putra Malaysia, Malaysia
Abstract: As checklists developed for textbook evaluation are question-able in terms of reliability and validity, other ways are being sought to bring about more systematic, efficient and objective evaluation instruments, which can provide greater insight into the strengths and weak-nesses of textbooks. With this in mind, the researchers explored the abilities of WordSmith 3.0, a concordance software, in providing some insights into the structure of textbooks. This study will provide findings on data WordSmith 3.0 generates automatically and semi-automatically, and how this information could be used in the evaluation of textbooks.
Key words: textbook evaluation, material evaluation, ESL textbooks, con-cordance software
Mukundan & Hussin, Automatic and Semi-Automatic Processes 201
The predictive and retrospective evaluation of a textbook has to be not only systematic but efficient. The current practice which relies solely on the evaluation checklist, is not very efficient and has created doubts among teachers as well as researchers, in terms of reliability and validity of the instruments, as many checklists developed for textbook evaluation are rarely tested. Littlejohn (1998), Sheldon (1998) and Ur (1996) have reported on flaws within the evaluation checklists, which affect the reliability and validity of the instrument. It is the inefficient and subjectivity of the checklist in textbook evaluation that prompted the researchers to look at other ways to bring about a more systematic, efficient and objective evaluation instrument, which can then provide greater insight into the strengths and weaknesses of a textbook.
Due to the inadequacy of textbook evaluation methods, which are overly reliant on the checklist, this study proposes the use of concordance software as an additional instrument for both predictive and retrospective evaluation of textbooks. Concordance software allows researchers to analyze how language is used (Fox, 1998). Some of the concordance software developed for language analysis includes Concordance 3.0, HAMLET for Windows, MicroConcord (DOS), TextQuest 1.37, MonoConc Pro 2.0 and WordSmith 3.0. Mukundan (2004) suggested using WordSmith 3.0, which is one of the three instruments in his composite framework for textbook evaluation, in evaluating a textbook.
WordSmith 3.0 is an integrated programme that looks at how words behave in a text. Oxford University Press uses the tools for lexicographic work in preparing dictionaries. These tools are also useful for language teachers, students and researchers in investigating language patterns. There are three analysis tools, which are WordList, Concord, KeyWords and three utility tools, which are Splitter, Text Converter and Viewer.
The WordList tool lists all the words or word-clusters in a text and can be presented in alphabetical or frequency order. It provides detailed statistics and consistency analyses for the text. This function is to find out which word recurs consistently, study the types of vocabulary used, identify common word clusters and compare the frequency of words in different text files or across genres. It also helps to generate lists of key-words and main key-words.
The KeyWord tool is used to find the keyword in a text. It gives reasonably good clue as to what the text is about. It provides the dispersion plot of the key words in the text. Associates is another function of Keyword and it refers to the key-words which are associated with the key key-word and they may/may not co-occur in proximity to the key key-word. Another function, Clumps, refers to the groups of key-words associated with a key key-word. These two functions can be activated if needed.
The Splitter tool is a utility tool, which splits large files into smaller ones for text analysis purposes. The text converter tool is another general-purpose utility, which is used to edit texts, rename text files, change file attributes and to move files into new directory if they contain certain words or phrases. The final utility tool is the Viewer tool, which allows the source text to be displayed in various formats.
The study was intended to explore the abilities of WordSmith 3.0 as a textbook evaluation instrument. All the three analysis tools were used in analyzing the textbook. In order to demonstrate these abilities clearly, one secondary English language textbook was randomly selected and in this study, a Form 4 English language textbook published by Mutiara Ilmu Sdn. Bhd. was used. As not all information provided by WordSmith 3.0 was derived automatically, users need to organize the information in such a way as to produce meaningful findings about the textbook.
The presentation of the abilities of WordSmith 3.0 is based on the research questions stated below:
1. What are the automatic processes provided by WordSmith 3.0 in evaluating a textbook?
2. What are the semi-automatic processes provided by WordSmith 3.0 in evaluating a textbook?
In this study, the following terms need to be defined:
1. Automatic processes refer to the processes to generate results automatically performed by WordSmith 3.0 without requiring any human interventions in preparing the outputs.
Mukundan & Hussin, Automatic and Semi-Automatic Processes 203
files.
4. Types refer to the different words encountered as Wordlist first processes the text.
5. Text Density ratio is calculated by dividing the number of types by the num-ber of tokens found in the text (types/ tokens). It measures the intensity of the text itself.
6. The Consistency ratio is calculated by dividing the number of tokens by the number of types found in the text (tokens/types). It measures the consistency of the introduction of new vocabulary in the text.
7. Keyness is not the most frequent words but words, which are unusually fre-quent in the 1000 word article. These words give reasonably good clues as to what the text is about.
METHOD
Before using WordSmith 3.0 to analyze the Form 4 textbook, several proc-esses are to be followed. First, each page of the selected Form 4 English text-book is photocopied on a single side of a separate piece of paper. Then, the pho-tocopied pages are scanned using a high-speed scanner, to convert them into Tagged Image File format (TIF). After that, the image files are saved in the computer hard disk before they go through the Optical Character Recognition (OCR) to convert all the TIF files into computer text files (.txt). The text files are checked for errors before saving and renaming them according to the respective units of the textbook. Now, these text files are then ready to be analyzed.
RESULTS AND DISCUSSION
Automatic Processes Provided by WordSmith 3.0 in Evaluating a Textbook
Automatic processes refer to the processes to generate results automatically performed by WordSmith 3.0 without requiring any human interventions in pre-paring the outputs. The automatic processes of WordSmith 3.0 are WordList, Concord and KeyWord Tools.
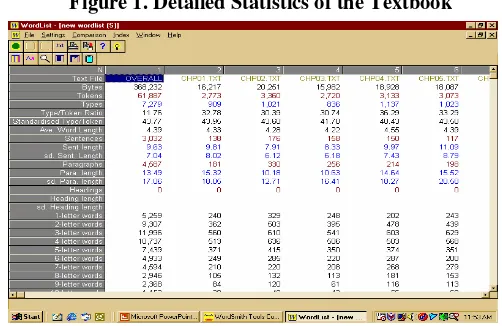
The WordList tool provides detail statistics of the textbook, list of words in the textbook according to alphabetical and frequency order and detailed consis-tency analysis of the textbook. Figure 1 shows the statistics of the textbook as a whole and based on individual units in the textbook. The statistics consists of in-formation such as Bytes (refers to the size of the file), Tokens (refers to the run-ning words encountered by WordSmith as it processes the text), Types (refers to the different words encountered by WordSmith as it processes the text), Type/Token Ratio, refers to the text density ratio that measures the intensity of the text itself. Other information provided include: average word length, number of sentences, sentence length, number of paragraphs and paragraph length.
Figure 1. Detailed Statistics of the Textbook
Mukundan & Hussin, Automatic and Semi-Automatic Processes 205
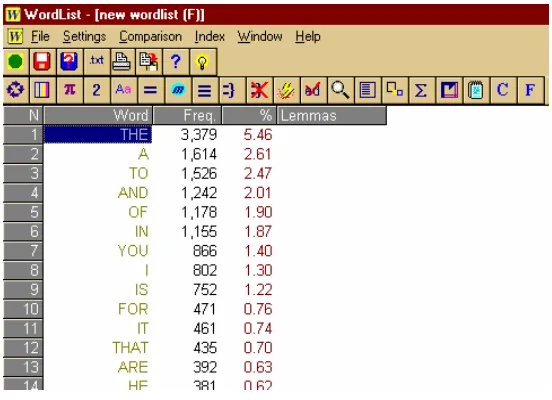
Figure 2. List of Words Based on the Frequency Order
Figure 3. List of Words Based on Alphabetical Order
sorted according to alphabetical order, frequency order and its occurrence in units in the textbook.
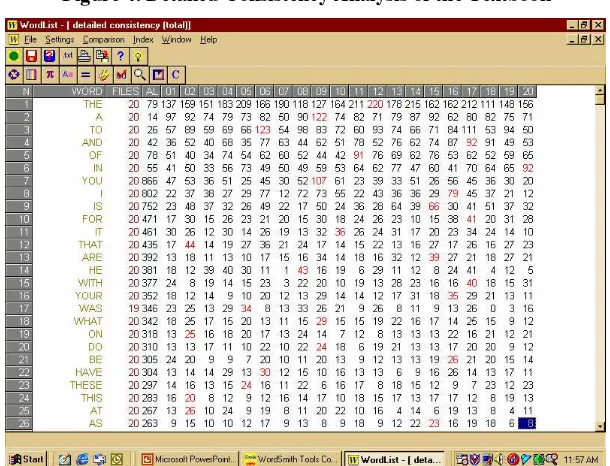
Figure 4. Detailed Consistency Analysis of the Textbook
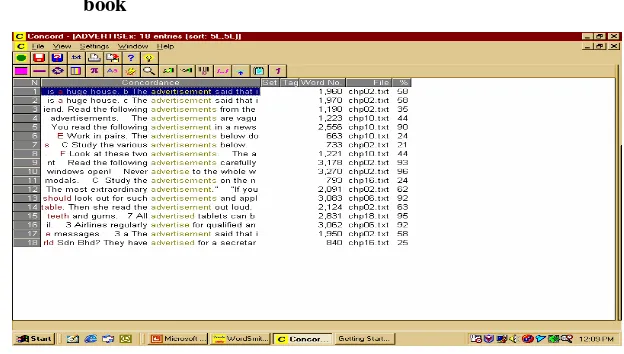
The concordance tool shows the location of where certain words appear in the textbook. It allows the user to view the words as they appear in different context. It also provides the dispersion plots showing where the word appears in each unit (files). Figure 5 shows the word advertisement as it appears in different contexts in the textbook. Figure 6 shows the dispersion plot of words in the textbook.
Mukundan & Hussin, Automatic and Semi-Automatic Processes 207
Figure 5. Concordance Output of the Word Advertisement in the
Text-book
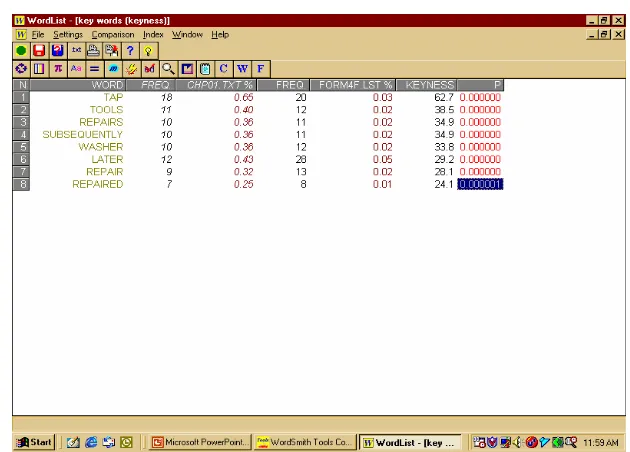
Figure 7. A Sample of KeyWord Output Keyness
Semi-Automatic Processes of Wordsmith 3.0 in Evaluating a Textbook
Semi-automatic processes refer to the processes to generate results that need human intervention to re-organize the outputs of automatic processes in order to provide meaningful findings to answer the research questions stated. WordList, Concord and Keyword Tools are used to generate results and these results will be re-organized accordingly to produce specific findings to serve the intended purposes.
Mukundan & Hussin, Automatic and Semi-Automatic Processes 209
General Information about the Vocabulary Used in the Textbook
Vocabulary Used in the Textbook
The Wordlist Tool is used to provide this information. The proposition of types and tokens shows the density of the text (Nation, 1990). Table 1 shows the overall statistics of the textbook. The total number of the running words (tokens) found in the text is 61,887 words and the total number of different words found in the textbook is 7,279 words. The type/token ratio measures the density of the text. Every new different word is equivalent to 0.12 of the running words. The consistency ratio of the textbook is 8.502.
Table 1. Some General Information about the Vocabulary Used in the Textbook
Number of tokens (running words) 61 887 words
Number of types (different words) 7 279 words
Type/token ratio (measure density ratio ) 1: 0.12 Token/type ratio (measures consistency ratio) 1: 8.502
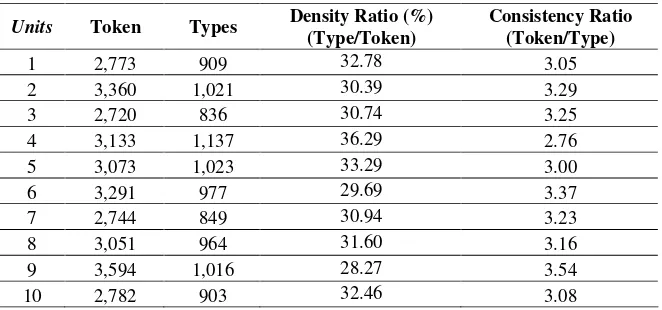
Table 2 shows the some information about the number of running words, the number of different words, the density ratio of each unit and the consistency ratio of introduction of new words in each unit of the textbook.
Units Token Types Density Ratio (%)
Density Ratio of the Units in the Textbook
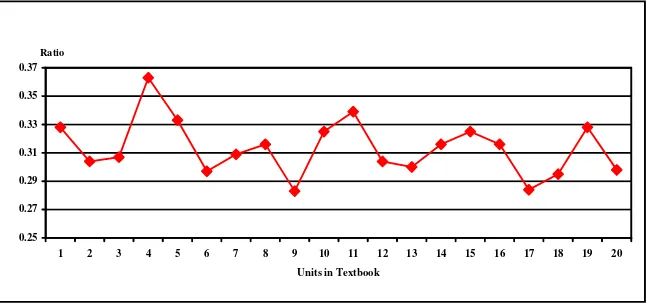
Density ratio refers to the compactness of the text. It is used to further illus-trate the consistency in the types of words used in the textbook. Fig. 8 shows the text density ratio of each unit. It shows how each unit is fully loaded with differ-ent types of words or in other words, the amount of differdiffer-ent types of words in each unit. The density ratio should be consistent to indicate that the different types of words are equally distributed throughout the textbook. The density ratio of this textbook is 0.12 or 12%. Figure 8 shows that there is no consistency in the density ratio of each unit in the textbook. For example, more types of words can be found in Unit 4 than in Unit 9.
Consistency Ratio of Units in the Textbook
Mukundan & Hussin, Automatic and Semi-Automatic Processes 211
Figure 8. Text Density Ratio
Figure 9 shows the word consistency ratio of each unit. There is no consis-tency in the ratio. The introduction of new words is not done at the same inter-val. For example, new words in Unit 4 are introduced after every 2.76 of the running word while in Unit 9 new words are introduced only after every 3.54 of the running word.
Figure 9. Word Consistency Ratio
2 . 5 2 . 75 3 3 . 2 5 3 . 5 3 . 75
1 2 3 4 5 6 7 8 9 10 11 12 13 14 15 6 17 18 19 2
Units in the Textbook
R
a
ti
o
0.25 0.27 0.29 0.31 0.33 0.35 0.37
1 2 3 4 5 6 7 8 9 10 11 12 13 14 15 16 17 18 19 20 Units in Textbook
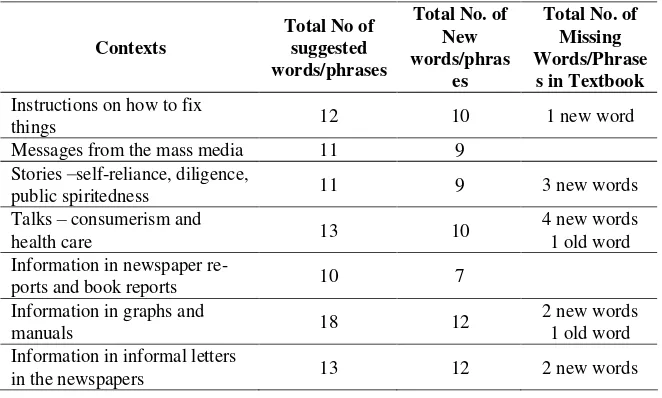
Comparison of the vocabulary used in the Form 4 textbook and vocabulary sug-gested by the Form 4 Syllabus.
New, Old and Missing Vocabulary Items
Mukundan & Hussin, Automatic and Semi-Automatic Processes 213
Description of scenes tourist
spots in ASEAN region 10 8 1 new word ing in and participating in a conversation
3 2
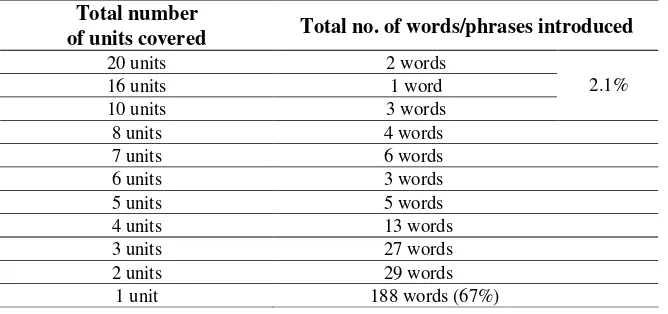
Table 4 shows that only 2.1% of 281 words (6 words) cover half of the units in the textbook (10 units). 67% or 188 words appear once throughout all 20 units. The recurrence of words is not balanced. This shows that the words are not being recycled enough.
Table 4. Distribution of the Suggested Vocabulary in the Textbook
Total number
of units covered Total no. of words/phrases introduced
214 TEFLIN Journal, Volume 17, Number 2, August 2006
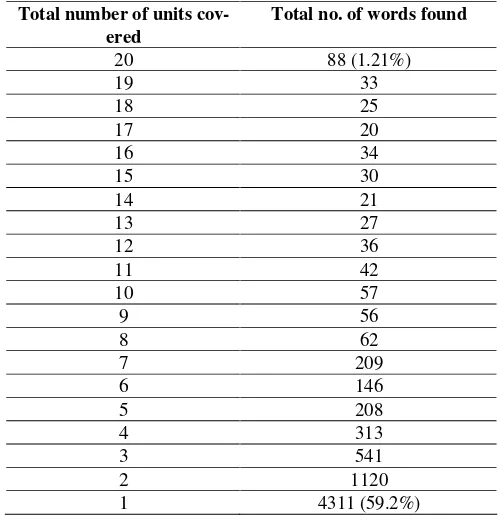
Detailed Consistency Analysis of the Textbook
This tool provides a detailed analysis of the distribution of vocabulary in the whole textbook. Out of 7 279 different types of words in the text, only 88 words (1.21%) appear in each of the 20 units. 4.9% of 7 279 words (356 words) cover half of the textbook (10 units). 59.2% or 4311 words appear once throughout all 20 units. The recurrence of words is not balanced. The words are not being recycled enough.
Table 5. Distribution of the Vocabulary in the Textbook
Total number of units
Mukundan & Hussin, Automatic and Semi-Automatic Processes 215
words provide clues to the relationships between the parts of a sentence, be-tween sentences and bebe-tween paragraphs. These words are connectors of transi-tions from one idea to another that help make the text cohesive. One type of sig-nal word is the sequence connector. It shows the order or sequence of ideas in a text.
There are two new sequence connectors introduced in the Form 4 syllabus, and the connectors are later and subsequently . The first is used to indicate a lapse of time - something that takes place after a period of time and the latter, is used to indicate the effect of an action. There are other sequence connectors in-troduced earlier in the previous syllabi first , next , then , after that and
finally .
The Concordance Tool in WordSmith Tools 3.0 will be used to locate the connectors in the textbook.
Units that Introduced the New Sequence Connectors
Both new sequence connectors are introduced in Chapter 1 How Do I Fix It?. Later appears 12 times in Chapter 1 and the remaining 16 times in 11 dif-ferent chapters in the textbook (Please refer to Table7). Subsequently appears 10 times in Chapter 1 and only once in Chapter 16.
The Number of Times SequenceCconnectors Appear in the Textbook
First appears 72 times in 21 chapters but not all are sequence connectors. 21 out of 72 are sequence connectors and they appear in 11 chapters. Next pears twice in the textbook, which is in Chapter 1 and Chapter 19. Then ap-pears 69 times in 18 different chapters in the textbook. After that apap-pears 3 times in 2 different chapters and Finally appears 12 times in 6 different chap-ters. (Please refer to Table 6 for tabulation of detailed distribution and Appendix I-VII for the distribution plots).
Recycling of the Sequence Connectors
216 TEFLIN Journal, Volume 17, Number 2, August 2006
Table 6. Distribution of Sequence Connectors in the Textbook
Chapters in the Textbook
Table 7. Recycling of Sequence Connectors in the Textbook
Sequence
Con-nector Total Hits No of Chapters Recycling of items
Later 27 12 Sufficient
Subsequently 11 2 Very insufficient
First 21 11 Sufficient
Next 2 2 Very insufficient
Then 69 18 Very sufficient
After that 4 3 Very insufficient
Finally 12 6 Insufficient
The new and the previously learned sequence connectors are not well dis-tributed in the textbook, except for then , first and later . These items need to be recycled well in order for students to be effective users of these items.
The Keyness Aspects of Each Unit
It compares two pre-existing word lists: the list interested and the reference list (Unit-Textbook). It is to find out which words characterize the units. The words are not the most frequent words but the words, which are unusually frequent in the 1000 word article. It gives a reasonably good clue to what the text is about. The Keyness is calculated by cross-tabulating the following:
Its frequency in the small wordlist
Mukundan & Hussin, Automatic and Semi-Automatic Processes 217
Its frequency in the reference corpus
The number of the running words in the reference corpus
The p value ranges from 0 to 1 and it suggests the 1% danger of being wrong in claiming the relationship. For this text, p=0.05 (the smaller the num-ber, the fewer the key words in the display).
The results of the analysis show that these units have significantly different words from other units. These are units where one can guess what the units are all about. Table 8 shows an example of keyness for Unit 13. By looking at these words, we can guess that Unit 13 must be about recycling and protecting the en-vironment. It also shows that Unit 13 has a focus and the textbook could be us-ing the thematic approach in each unit.
Table 8. Example of Keyness of Each Unit Use of Male/Female References in the Textbook
Table 9. Gender Bias in the Textbook
This study uses only three WordSmith 3.0 analysis tools. There are other tools in WordSmith 3.0 that could be used to provide more information about the textbook.
The three analysis tools managed to provide a lot of information about the textbook. The tools show that WordSmith 3.0 is able to provide information such as the total number of words in the textbook, the total number of different words used in the textbook, the total number of words per unit and the total number of different words per unit. WordSmith 3.0 is also able to measure the density ratio of the textbook and its respective units, and the consistency in introducing new words in the textbook and in its respective units.
Mukundan & Hussin, Automatic and Semi-Automatic Processes 219
REFERENCES
Ellis, NC. 1997. Vocabulary Acquisition: Word Structure, Collocation, Word Class, and Meaning. In N. Schmitt, & M. McCarthy (Eds.). Vocabulary: Description, Acquisition and Pedagogy. (pp. 122-139). Cambridge: Cam-bridge University Press.
Fox, G. 1998. Using Corpus Data in the Classroom. In B. Tomlinson (Ed.). Ma-terials Development in Language Teaching. Cambridge: Cambridge Uni-versity Press.
Mukundan, J. 2004. A Composite Framework for ESL Textbook Evaluation. Unpublished Doctoral Thesis. Serdang: Universiti Putra Malaysia.
Littlejohn, A. 1998. The Analysis of Language Teaching Materials: Inside the Trojan House In B Tomlinson (Ed.), Materials Development in Language Teaching. Cambridge: Cambridge University Press.
Nation, P. 1990. Teaching & Learning Vocabulary. USA: Heinle & Heinle Pub-lishers.
Sheldon, L. 1998. Evaluating ELT Textbooks and Materials. ELT Journal 42/4: 237-246.