Copyright 1999 H.J. Paris
This is the author-manuscript version of this paper. First published
in:
Dollery, Brian and Worthington, Andrew (1999) Tax complexity and
fiscal illusion: An empirical evaluation of the Heyndels and
Smolders approach Public Finance/Finances Publiques
51(4):pp. 522-533.
TAX COMPLEXITY AND FISCAL ILLUSION: AN
EMPIRICAL EVALUATION OF THE HEYNDELS
AND SMOLDERS APPROACH
BRIAN E. DOLLERY
University of New England, New South Wales, Australia. ANDREW C. WORTHINGTON
Queensland University of Technology, Queensland, Australia.
In a pioneering paper on the revenue-complexity hypothesis, Heyndels and Smolders (1995) demonstrate that the conventional employment of the Hirschman-Herfindal index (HHC) in the empirical analysis of fiscal illusion introduces an arbitrary restriction without theoretical foundation. They propose instead the more general Hannah and Kay index (HK). In this paper we extend this approach to 1991 data drawn from forty six local government areas in Tasmania, Australia. Our results are in broad agreement with those produced by Heyndels and Smolders using local government data from Flanders, Belgium. We find that the HHC may involve sizeable misspecification bias and our results provide further support for the use of HK instead of HHC.
I. INTRODUCTION
(1976) seminal study borrowed the Hirschman-Herfindahl concentration index (HHC) from industrial organisation to represent tax complexity, all subsequent empirical investigations of the revenue-complexity hypothesis have also used the HHC.
In a recent paper Heyndels and Smolders (1995) examine the theoretical arguments underlying the tax complexity hypothesis and in particular question the appropriateness of employing the HHC as a suitable measure of revenue complexity. The essence of their objections to the HHC is as follows (Heyndels and Smolders 1995, pp. 130-131):
As such, the HHC corresponds to the general ideal of Wagner’s “abstraction argument” concerning the impact of size inequalities on fiscal misconception. Still, whatever the (theoretical) explanation given to the exact nature of this impact, it is hard to put forward a given relation between both determinants (number and size inequalities) that is based on theoretical grounds. This however is exactly what is being done by using the HHC in empirical research. In other words: the impact of the number of taxes on the one hand and of size inequalities between the different items on the other is theoretically plausible. However, by putting forward a given relationship between those two determinants, the choice of the HHC introduces a restriction into the model that has hardly any theoretical foundation and above all can be circumvented easily.
In place of the conventional HHC, Heyndels and Smolders (1995) propose a more general approach to the measurement of tax complexity which enables the relative importance of the number of taxes and size inequalities between different taxes to be determined empirically. This is accomplished by means of a Hannah and Kay concentration index (HK), which is a more general measure of concentration than the HHC.
In order to evaluate the statistical impact of substituting HK for HHC, Heyndels and Smolders (1995) employed a modified version of their model developed in Heyndels and Smolders (1994) using 1990 data drawn from 302 municipalities in the Region of Flanders in Belgium. After examining the results of the estimation procedure, Heyndels and Smolders (1995, pp. 138) draw the following conclusion:
Our empirical results show that per capita expenditures of Flemish municipalities can be explained by a model in which tax complexity is measured by a Hannah and Kay index with an α-value of 0.9. Use of the Hirschman-Herfindahl index would overestimate the relative importance of the size inequalities, while underestimating the impact of the number of taxes.
of Tasmania, Australia, in 1991.2 Our results suggest that the use of HHC simplicity indexes in the empirical estimation of the revenue complexity hypothesis may involve sizeable misspecification bias. This accords with the central findings of Heyndels and Smolders (1995).
The paper itself is divided into four main areas. Section 2 provides a brief synopsis of the characteristics of the HHC and its relationship to the HK. Section 3 deals with the empirical methodology employed in the paper, and the results are discussed in Section 4. The paper ends with some concluding remarks in Section 5.
II. MEASURING TAX COMPLEXITY
The well-known HHC is given by the following formula:
HHC i
where Ti represents the proportion of total tax revenue in a given fiscal jurisdiction derived from tax i and N represents the number of different taxes. In effect, the HHC considers all taxes but, by squaring the relative shares of individual taxes, gives more weight to those individual taxes which generate relatively more tax revenue. In the limiting base, if only one tax raised all tax revenue, then HHC would take the value of unity. Alternatively, if an infinitely large number of taxes generated total tax revenue, then the value of the HHC would approach zero. Accordingly, the HHC is a measure of the simplicity of a tax regime, with lower values of the index indicating more fragmentation. The revenue complexity hypothesis is thus predicted on a negative coefficient for the HHC.
A more general way of determining the relative importance of the number of taxes in comparison with revenue raised by individual taxes suggested by Heyndels and Smolders (1995) is the HK. The HK can be written as :
HHC. Similarly, when α = 0, the HK corresponds to the inverse of the minimum concentration index; when α = 1, the logarithm of HK becomes the entropy index; and when α = ∞, HK represents the reciprocal of the concentration index. Accordingly, Heyndels and Smolders (1995, p. 131) observe that:
It is clear that capturing the complexity of a tax system through a HK index and by manipulating the α parameter, different relative weights can be given to the number of taxes and to the size inequalities between the different taxes as components of tax fragmentation. This creates the opportunity to determine the relative importance of both elements on an empirical basis.
III. EMPIRICAL METHODOLOGY
have particular elasticities of demand would appear to hold better at the local level than at that of the relatively heterogenous state level (Wildasin, 1979).
Modelling fiscal illusion in this manner is not only consistent with literature on the nature of the demand function for public goods, like Bergstrom and Goodman (1973) and Romer and Rosenthal (1979), but also accords with most previous empirical work on fiscal illusion, such as Wagner (1976), Munley and Greene (1978), Breeden and Hunter (1985), Feenburg and Rosen (1987) and Grossman (1990). Moreover, this methodology has dominated the empirical literature on fiscal illusion at the local level (Wagner 1976; Pommerehne and Schneider 1978; Munley and Greene 1978; DiLorenzo 1982; Grossman 1990; Heyndels and Smolders 1994). Furthermore, a log-linear formulation of a per capita approach has been widely employed [see, for example, Baker (1983), Misiolek and Elder (1988), Heyndels and Smolders (1995)]
Although the hypotheses examined in the present context are primarily concerned with the revenue complexity hypothesis, some consideration is also given to the renter illusion hypothesis since neglecting it would lead to misspecification (Martinez-Vasquez 1983). The renter illusion hypothesis argues that " ...other things being equal, jurisdictions with a relatively large fraction of renters tend to spend more per capita on local public services" (Oates 1988, p. 72). Such an observation is based on the apparent failure of renters to understand the link between the level of local services demanded and the level of rent paid (Oates 1988, p. 72).3
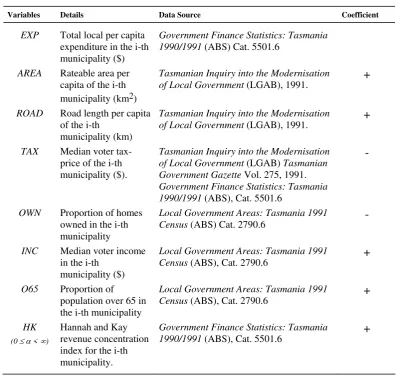
Table 1 outlines the variables employed in the cross-sectional analysis of a sample of forty six local government areas in Tasmania, Australia. The estimating equation is:
lnEXPi = β0 + β1lnAREAi + β2lnROADi + β3lnTAXi +
β4lnOWNi + β5lnINCi + β7lnO65i + β8lnHi(α) + ui (3)
problem. And secondly, EXP is based on constant returns to scale. Notwithstanding these caveats, and given the absence of more suitable dependent variables, we use EXP.5
TABLE 1. Variable specification
Table 1 also contains the set of independent socioeconomic variables required by the Bergstrom and Goodman (1973) demand function approach. These variables seek to capture salient characteristics of the local community that are likely to influence the demand for public good expenditure. Both rateable area per capita AREA and rateable area roads per capita ROAD are expected to exhibit a positive coefficient with respect to expenditure (Wagner 1976; Munley and Greene 1978), particularly since local governments in Australia typically devote considerable resources to these purposes.6 The proportion of the population over sixty five years of age 065 is expected to yield a positive sign since a higher proportion of elderly people should be associated with a greater consumption of public goods (Bergstrom and Goodman 1973). Median voter
Variables Details Data Source Coefficient
EXP Total local per capita expenditure in the i-th municipality ($)
Government Finance Statistics: Tasmania 1990/1991 (ABS) Cat. 5501.6
AREA Rateable area per capita of the i-th municipality (km2)
Tasmanian Inquiry into the Modernisation
of Local Government (LGAB), 1991. +
ROAD Road length per capita of the i-th
municipality (km)
Tasmanian Inquiry into the Modernisation
of Local Government (LGAB), 1991. +
TAX Median voter tax-price of the i-th municipality ($).
Tasmanian Inquiry into the Modernisation of Local Government (LGAB) Tasmanian Government Gazette Vol. 275, 1991. Government Finance Statistics: Tasmania 1990/1991 (ABS), Cat. 5501.6
-
OWN Proportion of homes owned in the i-th municipality
Local Government Areas: Tasmania 1991
Census (ABS) Cat. 2790.6 -
INC Median voter income in the i-th
municipality ($)
Local Government Areas: Tasmania 1991
Census (ABS), Cat. 2790.6 +
O65 Proportion of population over 65 in the i-th municipality
Local Government Areas: Tasmania 1991
income INC is included on the presumption that public goods in general may be defined as normal goods, and on the assumption that it captures unmeasurable and unintentionally excluded income-correlated characteristics like educational attainment, employment, family stability, and “… general success in society” (Hamilton 1983, p. 347). The expected coefficient for INC is positive. Despite the widespread employment of an income variable in the empirical literature, at least two lines of criticism have been directed at its use. Firstly, it is argued the employment of median measures of income may serve to obscure the real income elasticity of demand for the public good, since there is no reason to believe that elasticities are constant across a particular income class for any jurisdiction (Romer and Rosenthal 1979; Wildasin 1988). And secondly, the median voter model assumes that the median taxpayer receives the median income which amounts to assuming income is monotonic. If this is not the case, then the equation may be misspecified (Romer and Rosenthal 1979). However, Wildasin (1988, p. 375) argues that at the “macro-level” (ie. full local expenditure) the impact of any median voter model constraints and assumed monotonicity will be minimal, given “…the error in the income elasticity … is not likely to be very large.”
socioeconomic variables and provided better estimates given “… a possible misspecified production function,” as against the alternative approaches which exhibited “inconsistent parameters”. Hayes (1989, p. 273) observed that the results indicated “… statistical support for the median voter’s tax-share approach”.7 Accordingly, this approach is employed in the present context.
In addition to these socioeconomic variables, past empirical approaches to the analysis of fiscal illusion have included various illusionary factors. Variables selected in this regard depend critically on the powers and institutional processes of particular levels of government. The local level of government expenditure in Australia, as exemplified in our Tasmanian sample, provides a suitable milieu for the analysis of both the revenue-complexity hypotheses and the renter illusion hypothesis. As detailed earlier, the HHC has traditionally been used to test the tax complexity hypothesis. However, following Heyndels and Smolders’ (1995) pioneering paper, we employ the HK measure, with the weighting variable α ranging from zero to infinity, step 0.1.8 Moreover, in common with Heyndels and Smolders (1995), the relative importance of the “number” and “size” components of revenue complexity is assessed by varying the value of α, and optimising with respect to the value of the coefficient of determination.9 Secondly, the renter illusion hypothesis argues that “… other things being equal, jurisdictions with a relatively large fraction of renters tend to spend more per capita on local public service” (Oates 1988, p. 72). Such an observation is based on apparent failure of renters to understand the link between the level of local services demanded and the level of rent paid (Oates, 1988). The variable used to evaluate the renter illusion hypothesis OWN is the proportion of homes owned or being purchased in the municipality (Bergstrom and Goodman 1973; Goetz 1977; Martinez-Vazquez 1983). The renter illusion hypothesis would a priori indicate a negative coefficient since as the proportion of homes owned or being purchased increases, the level of expenditure would fall.
IV. RESULTS
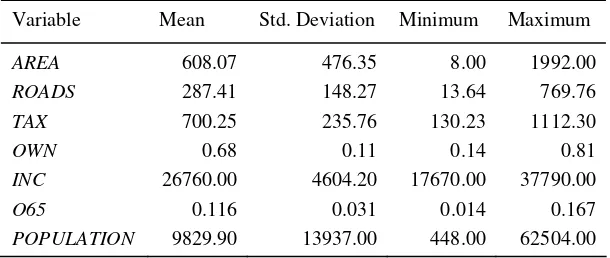
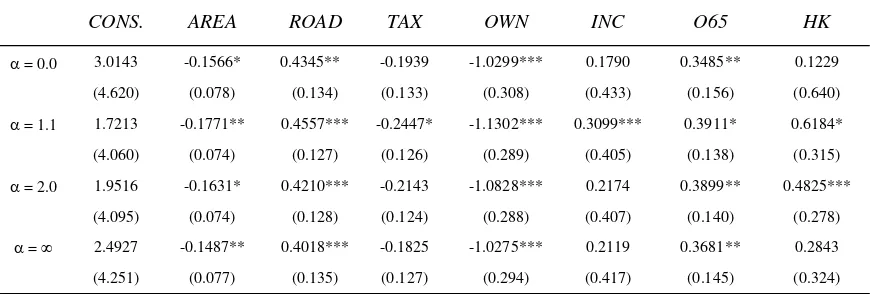
Regression results for the models and hypotheses developed above are presented in Table 3. Selected descriptive statistics are presented in Table 2.
that the composition of the community - that is, the characteristics of the residents themselves - plays a central role in determining levels of important public outputs” (Schwab and Oates 1991, p. 217). Tests for homoskedasticity fail to reject the null hypothesis and we may conclude heteroskedasticity is not present. The Ramsay RESET specification test rejects the null hypothesis of no functional misspecification, whilst a test for model selection favours the log-linear form over an alternative linear formulation. The results supporting the former specification sustain the findings of Baker (1983), Misiolek and Elder (1988), Grossman (1990) and Heyndels and Smolders (1994; 1995) in the econometric suitability of the log-linear over a linear form for demand estimation.
TABLE 2. Descriptive statistics
Variable Mean Std. Deviation Minimum Maximum AREA 608.07 476.35 8.00 1992.00 ROADS 287.41 148.27 13.64 769.76
TAX 700.25 235.76 130.23 1112.30
OWN 0.68 0.11 0.14 0.81
INC 26760.00 4604.20 17670.00 37790.00
O65 0.116 0.031 0.014 0.167
POPULATION 9829.90 13937.00 448.00 62504.00
Most importantly in terms of the present study, the results in Table 3 suggest that the use of the HHC in analysis of this kind may involve sizeable misspecification bias. More particularly, the best fit of the model is optimised at an α value of 1.1.10 Utilising an F-test Wald procedure along the lines of Heyndels and Smolders (1995), the null hypothesis of the α = 2 restriction is rejected against the unrestricted α = 1.1 alternative.
required in the empirical analysis of revenue complexity. However, the results would suggest, at least in the Australian institutional milieu, that the emphasis on the size inequalities of revenue devices (as represented by the HHC) is likely to encompass a lesser degree of misspecification than that posited by the use of a proxy variable which might emphasise the number of such devices. Finally, further tests are undertaken using the preferred specification of α = 1.1. A test for the joint insignificance of the vector of socioeconomic coefficiencts (AREA, ROAD, TAX, INC and O65) is rejected at the 99 percent level. Similarly, an identical test for the joint insignificance of the illusionary variables OWN and HK is also rejected.
Values in parentheses are the corresponding standard errors. Asterisks represent the level of significance *
- 90 percent, ** - 95 percent, *** - 99 percent. V. CONCLUDING REMARKS
Various benefits flow from the present study. Our results support the contention advanced by Heyndels and Smolders (1995) that the widespread use of the HHC may result in misspecification bias by providing corroborative econometric evidence drawn from an alternative institutional milieu and a different data set. There is thus now compelling evidence to suggest that the previous unqualified acceptance of the HHC as a satisfactory measure of revenue simplicity was misplaced. Moreover, our results also provide support for the use of the HK instead of the HHC.
counterparts, and in particular are obliged to rely on far fewer fiscal extraction devices. It is thus reasonable to assume any HHC bias against the numbers of taxes is muted in the Australian context. Finally, and perhaps most importantly, despite its undoubted advantages Heyndels and Smolders (1995) seminal use of the HK does raise questions concerning “data mining”. The selection of an optimising value for α serves to maximise the ex post empirical results at the expense of sound a priori reasoning. The importance of a solid theoretical basis for the analysis of fiscal illusion need hardly be stressed.
NOTES
1
Other hypothesised sources of fiscal illusion are revenue-elasticity, the flypaper effect, renter illusion, and debt illusion.
2 Municipal data was selected from Tasmania for three reasons. The first is that Tasmania does not
have in force "rate ceilings" as found in, say NSW. Municipal decisions on expenditure thus tend to be more disassociated from state control. Secondly, it would be unwise to cross state borders in selecting data sets, as substantial differences in the regulation, revenue raising and administration of local governments exist. Thirdly, Tasmania was the only state to provide concise published data on a local government basis for the 1991 Australian Census.
3
At the local level in Australia, revenue is primarily derived from municipal rates and the usage of municipal services and does not relate directly to income levels within a municipal area. Accordingly, the revenue-elasticity hypothesis is not relevant.
4 Derivation of more suitable measures of public provision brings with it further complications. In US
studies of local education expenditure (Hamilton 1983), use of educational performance is more likely to be an indicator of the socio-economic profile of the community rather than public good demand. In this manner, expenditure as output removes, at the least, the question of endogeneity (Wildasin 1989, p. 359).
5
Some studies have argued convincingly that substantial variation in public good demand may be found within local expenditure. In this manner evaluation of total local public goods may well obscure some of the peculiar conditions surrounding components of this expenditure, such as police, health and education in the United States (Bergstrom and Goodman 1973; Martinez-Vazquez 1983; Grossman 1990).
6
Rateable area and rateable area roads, rather than municipal area and municipal area roads, were selected since many Tasmanian LGAs encompass sizeable wilderness (state-funded) and national park (federally funded) regions. Rateable area and rateable area roads are likely to give a more accurate indication of local fiscal responsibilities.
7
Flowers (1977) has argued that voter equilibrium with two or more tax sources requires the median voter to be identified for each tax source being utilised., rather than a single tax-price across all tax sources.
8
It should be noted that Pommerehne and Schneider (1978) did raise the possibility of employing an entropy measure instead of the HHC, but did not report the empirical results flowing from its use, save to point out that it generated similar results to the conventional HHC. Similarly, Clotfelter (1976) included the relative importance of direct taxes and reliance on user charges in addition to an HHC comprising nine categories of taxation. For a detailed discussion of empirical work in the Wagner (1976) tradition see Dollery and Worthington (1996).
9
Eight revenue classifications are employed; rates, licenses/fees/fines, grants, charges, interest, utility transfers, loans, and other income.
10
REFERENCES
Baker, S. H. (1983), “The Determinants of Median Voter Tax Liability: An Empirical Test of the Fiscal Illusion Hypothesis”, Public Finance Quarterly, Vol. 11, pp. 95-108.
Bergstrom, T.C. and Goodman, R.P. (1973), “Private Demands for Public Goods”, American Economic Review, Vol. 63, pp. 280-296.
Breeden, C.H. and Hunter, W.J. (1985), “Tax Revenue and Tax Structure,” Public Finance Quarterly, Vol. 13, pp. 216-224.
Borcherding, T.E. (1985), “The Causes of Government Expenditure Growth: A Survey of the US Evidence”, Journal of Public Economics, Vol. 28, pp. 359–382.
DiLorenzo, T.J. (1982), “Utility Profits, Fiscal Illusion and Local Public Expenditures,” Public Choice, Vol. 38, pp. 243-252.
Dollery, B.E. and Worthington, A.C. (1996), “The Empirical Analysis of Fiscal Illusion”, Journal of Economic Surveys, Vol. 10, pp. 261-297.
Feenburg, D.R. and Rosen, H.S. (1987), “Tax Structure and Public Sector Growth”, Journal of Public Economics, Vol. 32, pp. 185-201.
Flowers, M.R. (1977), “Multiple Tax Sources, Voting Equilibrium, and Budgetary Size”, Public Finance/Finances Publiques, Vol. 32, pp. 210-224.
Goetz, C.J. (1977), “Fiscal Illusion in State and Local Finance” in T.E Borcherding (Ed), Budgets and Bureaucrats: The Sources of Government Growth (Durham: Duke University Press).
Grossman, P.J. (1990), “The Impact of Federal and State Grants on Local Government Spending: A Test of the Fiscal Illusion Hypothesis”, Public Finance Quarterly, Vol. 18, pp. 313-327.
Hamilton, B.W. (1983), “The Flypaper Effect and Other Anomalies”, Journal of Public Economics, Vol. 22, pp. 347-361.
Hayes, K.J. (1989), “A Specification Test for Choosing the 'Right' Public-Good Price”, Journal of Business and Economic Statistics, Vol. 7, pp. 267-273.
Heyndels, B. and Smolders, C. (1994), “Fiscal Illusion at the Local Level: Empirical Evidence for the Flemish Municipalities”, Public Choice, Vol. 80, pp. 325-338.
Heyndels, B. and Smolders, C. (1995), “Tax Complexity and Fiscal Illusion”, Public Choice, Vol. 85, pp. 127-141.
Holcombe, R.G. (1980), “An Empirical Test of the Median Voter Model”, Economic Inquiry, Vol. 28, pp. 260-274.
Martinez-Vazquez, J. (1983), “Renter’s Illusion or Savvy?”, Public Finance Quarterly, Vol. 11, pp. 237-247.
Misolek, W.S. and Elder, H.W. (1988), “Tax Structure and the Size of Government: An Empirical Analysis of the Fiscal Illusion and Fiscal Stress Arguments”, Public Choice, Vol. 57, pp. 233-245. Munley, V.G. and Greene, K.V. (1978), “Fiscal Illusion, the Nature of Public Goods and Equation Specification”, Public Choice, Vol. 33, pp. 95-100.
Oates, W.E. (1988), “On the Nature and Measurement of Fiscal Illusion: A Survey” in G. Brennan, B.S. Grewel and P. Groenewegen (Eds), Taxation and Fiscal Federalism: Essays in Honour of Russell Mathews (Sydney: ANU Press).
Pommerehne, W.W. (1978), “Institutional Approaches to Public Expenditure: Empirical Evidence from Swiss Cities”, Journal of Public Economics, Vol. 9, pp. 255–280.
Romer, T. and Rosenthal, H. (1979), “The Elusive Median Voter”, Journal of Public Economics, Vol. 12, pp. 143-170.
Schwab, R.M. and Oates, W.E. (1991), “Community Composition and the Provision of Local Public Goods: A Normative Analysis”, Journal of Public Economics, Vol. 44, pp. 217-237.
Wagner, R.E. (1976), “Revenue Structure, Fiscal Illusion and Budgetary Choice”, Public Choice, Vol. 2, pp. 45-61.
Wildasin, D.E. (1989), “Demand Estimation for Public Goods: Distortionary Taxation and Other Sources of Bias”, Regional Science and Urban Economics, Vol. 17, pp. 126–140.