Evaluation of the interfacial shear strength and residual stress of TiAlN
coating on ZIRLO
™
fuel cladding using a modi
fi
ed shear-lag model
approach
Y. Liu
a,*, I. Bhamji
a, P.J. Withers
a, D.E. Wolfe
b, A.T. Motta
b, M. Preuss
a aMaterials Performance Centre, School of Materials, The University of Manchester, M13 9PL, UKbThe Pennsylvania State University, University Park, State College, PA 16801, United States
a r t i c l e
i n f o
Article history: Received 1 March 2015 Received in revised form 31 May 2015
Accepted 2 June 2015 Available online xxx
Keywords:
ATF (accident tolerant fuel) coating Micromechanical modelling Metal-coating interface Fission
Zirconium
Accident tolerant fuels (ATF)
a b s t r a c t
This paper investigates the residual stresses and interfacial shear strength of a TiAlN coating on ZreNb
eSneFe alloy (ZIRLO™) substrate designed to improve corrosion resistance of fuel cladding used in water-cooled nuclear reactors, both during normal and exceptional conditions, e.g. a loss of coolant event (LOCA). The distribution and maximum value of the interfacial shear strength has been estimated using a modified shear-lag model. The parameters critical to this analysis were determined experimentally. From these input parameters the interfacial shear strength between the TiAlN coating and ZIRLO™substrate was inferred to be around 120 MPa. It is worth noting that the apparent strength of the coating is high (~3.4 GPa). However, this is predominantly due to the large compressive residuals stress (3 GPa in compression), which must be overcome for the coating to fail in tension, which happens at a load just 150 MPa in excess of this.
©2015 The Authors. Published by Elsevier B.V. This is an open access article under the CC BY license (http://creativecommons.org/licenses/by/4.0/).
1. Introduction
Zirconium alloys are commonly used as the fuel cladding for water cooled nuclear fission reactors, mainly due to their low neutron cross-section, good corrosion resistance during normal operating conditions and sufficient mechanical strength [1]. Despite high corrosion resistance at normal operating tempera-tures (around 300 C) [2], Zr alloys oxidise very rapidly when exposed to temperatures a few hundred degrees higher. This is an exothermic reaction, which can further accelerate oxidation and, at temperatures beyond 1000C, potentially lead to disintegration of the fuel rods, as highlighted during the Fukushima Daiichi nuclear accident. For this reason new research activities have been initiated worldwide to develop accident tolerant fuels (ATF). Additionally, ATFs could also provide further enhancements in corrosion per-formance during normal operating conditions enabling the
development of fuel assemblies for very high burn-up.
One concept for ATF is to coat the outside of current zirconium tubes with material that has an inherently high temperature oxidation resistance. Refractory metal nitride compounds, such as TiAlN, have been proposed as promising contenders for coatings on Zr for ATF applications[3,4]. The principle idea of TiAlN coating is that during exposure to very high temperatures, aluminium dif-fuses to the surface and reacts with oxygen to form a thin protective oxidation barrier. This significantly improves oxidation perfor-mance of the system, as oxygen diffusion through aluminium oxide is several orders of magnitude lower than through zirconium oxide. However, during service, the fuel cladding displays dimensional instability as a result of irradiation enhanced creep and irradiation induced growth[5e7]. Therefore, an important aspect of coated cladding material is the structural integrity of the system, partic-ularly the coating fracture behaviour, residual stresses in the coating and bond strength between the coating and the zirconium substrate. One common approach for analysing the fracture and adhesion behaviour between a brittle coating and a ductile sub-strate is to employ a model based on the shear-lag approximation [8e12] to predict the transfer of load between substrate and coating. Here, uniaxial tensile loading experiments are used to introduce parallel cracks transverse to the straining direction *Corresponding author.
E-mail addresses:[email protected](Y. Liu),imran.bhamji@manchester. ac.uk(I. Bhamji),[email protected](P.J. Withers),[email protected] (D.E. Wolfe),[email protected](A.T. Motta),[email protected] (M. Preuss).
Contents lists available atScienceDirect
Journal of Nuclear Materials
j o u r n a l h o m e p a g e :w w w . e l s e v i e r . c o m / l o c a t e / j n u c m a t
http://dx.doi.org/10.1016/j.jnucmat.2015.06.003
(transverse cracks) in the coating. Providing the initial residual stress in the coating is taken into account, the fracture strength of the coating can be estimated from the strain attained when the transverse cracksfirst start to appear. Subsequently, the interfacial shear strength can be evaluated by measuring the crack spacing (either the maximum, minimum or average spacing), achieved on further straining to the point at which the transverse crack fre-quency in the coating saturates. To infer the interfacial strength the model proposed by Agrawal and Raj (A-R model) has been used extensively[8,13]. It has been proven effective for many systems having a brittle coating adhered to a ductile substrate[11,13e17]. However, the model assumes that the shear stress is a sine wave having a wavelength equal to the fragment length (i.e. zero at the ends and the mid-point of the fragment), which is not physically based and is unlikely to be the case[9e11].
A modified shear-lag model is used in this paper, aiming to provide an approach, which is both easy to deploy and accurately represents the distribution of the interfacial shear strength (ISS) for a wide range of coating-substrate systems. It requires a knowledge of the coating residual stresses, which was determined by laboratory-based X-ray diffraction (XRD) and Raman spectroscopy. The model was employed to infer the ISS between the TiAlN on a ZIRLO™ substrate. In addition, key input parameters associated with the proposed model were measured experimentally.
The assessment of residual stresses in the coating and bond strength between the coating and the substrate aims to provide a guideline in an effort to develop TiAlN coatings for applications such as ATF.
2. Model formulation
A model based on the shear-lag approximation[18]forfibre/ matrix composites systems has been developed in this work for the evaluation of the interfacial shear strength and is applicable not only for the TiAlN/ZIRLO™structure, as discussed in this paper, but for a wide range of brittle coating/ductile substrate systems.
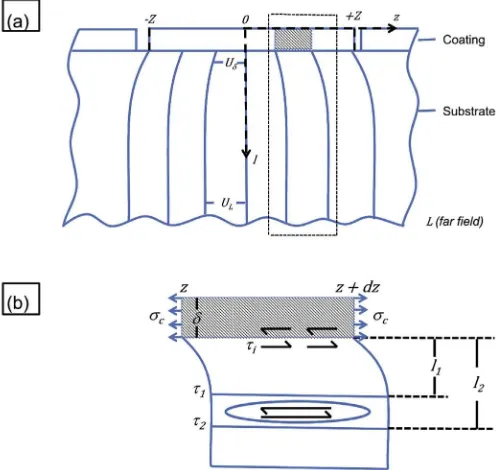
Under increasing tensile loading, a brittle coating eventually cracks before the substrate undergoes plastic deformation. A schematic of the cross-section of a fragmented region of the coating between two cracks, detailing key parameters used in the analysis, is given inFig. 1. For the following shear-lag analysis, the origin of the coordinate system is located centrally at the top of this frag-mented coating where the length of the segment is2Z, from ZtoZ and the coating thickness is
d
.Fig. 1(a) displays z axis is parallel to the coating/substrate interface, whereaslaxis is perpendicular to the interface from the origin into the substrate.Fig. 1(b) shows that when the coating is loaded to fracture, the stress variation
t
in the substrate at given distancez1away from the fragment central alongzaxis, is obtained by balancing the shear force by a neighbouring stress pairt
1 (l1 away from the interface) andt
2(l2away from the interface) over lengthdz.l1$t1$dz¼l2$t2$dz (1)
t1 t2¼
l2
l1 (2)
ti¼ L
d
$tL (3)
where
t
1andt
2are neighbouring shear stress;l1andl2are dis-tances away from the coating/substrate interface;dzis the length of the fragment over which the neighbouring shear forcet
1andt
2arebalanced, as shown inFig. 1;
t
iis the shear stress at the interface between the coating and substrate, andd
is the coating thickness.L represents a large distance (far-field) into the substrate where the shear stress does not change with the depth parameterl.The definition of shear strain gives
g¼du=dl¼tL=Gs¼
ti Gs$
d
L (4)
ZUL
Ud
du¼ti$d Gs$
ZL
d dl
l (5)
UL Ud¼ ti$d
Gs$ ln
L
d
(6)
ti¼ Gs d$ln
L d
$ðUL UdÞ (7)
whereULis the far-field strain andUdis the strain at coating/sub-strate interface, andGsis the shear modulus of the substrate.
The term lnL d
is not very sensitive to the ratio ofLover
d
, as it is in the logarithmic term. It is therefore possible to assumeLto be the substrate thickness in most cases (whenLis still comparable tod
).Equation (7) provides the expression of interfacial shear strength
t
ias a function of the mismatch between far-field strainUL and interfacial strainUd.The build-up of the in-plane tensile stress
s
cis related to the distribution of interfacial shear stresst
, force balance of the thin coating itself requires,Fig. 1.Schematic representation of the occurrence of multiple cracking in the brittle coating upon plastic deformation of the substrate. (a) the strained system where cracks in the coating and displacementUare introduced by uniaxial loading of the system. (b) the variation of neighbouring shear stress and strain in the matrix. Note that fromeZ toZis the coating segment. Detailed description is given in Section2Model Formu-lation. Redrawn after[18].
ti$dz¼ d$dsc (8)
where
s
cis the in-plane stress within the thin coating. Combining Equation(8)and Equation(7)givesdsc
ExpressingGsin terms of the substrate Young's modulusEsand Poisson's ratiovsgives
dsc
In the substrate far-field,
du
whereεcis the coating strain andεsis the substrate strain far-field. Differentiating Equation(10)gives,
Combining Equation(17)with Equation(8)gives,
ti¼ d$
Equation(17)and Equation(18)describe the distribution of the in-plane coating stress
s
cas a function of distancez. It is demon-strated from Equation(17)and Equation(18)that the maximum in-plane stresss
c peaks at the centre of the fragment whereas the interfacial shear stress is peaked at the ends of the fragment (where the cracks are). On applying boundary conditions oft
i¼t
imaxwhen z¼±Zinto Equation(18)givesWhen the peak coating stress in the centre of the fragment reaches the coating fracture strength
s
fthe fragment cracks into two. With increased loading of the substrate this process repeats itself resulting in further fragmentation until the number of cracks saturate. This occurs when the remaining fragments are too short to reach the critical fracture stress.At this saturated cracking level, Equation(17)gives
sf¼Ec$εs$
Combining Eq.(21)with Eq.(20)gives
sf¼j
Until now we have assumed the initial state of the coating to be stress-free; in cases where there is an initial residual stress in the coating
sf¼saþsr¼Ec$εcfþsr (24)
where
s
a is the stress in the coating from the applied load (sa¼Ec$εcfÞands
ris the residual stress. The termεcfis the strain during loading at which cracksfirst appear.By combining Equation(23)with Equation(24),
jtimaxj ¼
If the fragment is slightly longer than the critical length for fracture, it will fracture into two halves while if it is slightly shorter than the critical length it cannot. Hence, at saturation one would expect a distribution of fracture lengths between the critical length and a half the critical length. Based on an ideal normal distribution, the half crack distanceZin Equation(25)is approximately 2=3Z, whereZis the average crack spacing at saturated level after tensile testing.
withnexpressed previously as
Equation(26)provides an expression of the maximum interfa-cial shear stress with measurable parameters. The utilisation of this method is shown below with the example of interfacial shear strength calculation between TiAlN coating and zirconium alloy substrate.
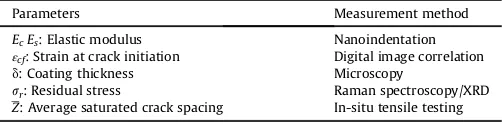
A summary of each parameter and the corresponding method of measurement is given below inTable 1.
3. Experimental methods
3.1. Deposition process
A ~10
m
m thick TiAlN coating was deposited onto a ~1000m
m zirconium alloy substrate (ZIRLO™) using a cathodic arc physical vapour deposition (CAPVD) method. Cathodic arc falls into the classification of Physical Vapour Deposition (PVD) coating tech-niques. The term PVD denotes those vacuum deposition processes where the coating material is evaporated or removed by various mechanisms (resistant heating, ablation, high-energy ionized gas bombardment, or electron gun), and the vapour phase is trans-ported to the substrate forming a coating. PVD is often classified as a“line-of-sight”process in which evaporated atoms travel from the source material to the substrate in a straight path. The residual stresses in the PVD coating are generally compressive due to coating bombardment onto the substrate, but can be controlled depending on the deposition parameters. These compressive stresses are often beneficial as they retard the formation and propagation of cracks in the coating. PVD coating processes generally take place between temperatures of 200Ce500C to minimize stresses associated with thermal expansion mismatch as compared to the high temperatures (1000C) of chemical vapour deposition CVD.
In the cathodic arc deposition process, a pulsed or continuous high current-density, low voltage electric current is passed be-tween two separate electrodes (cathode and anode) under low pressure vacuum, vaporizing the cathode material while simulta-neously ionizing the vapour, forming a plasma. The high current density (usually 104e106A/cm2) causes arc erosion by vaporisation and melting while ejecting molten solid particles from the cathode surface, with a high percentage of the vaporised species being ionised with elevated energy (50e150 eV) and multiply charged.
For example, in the case of TiAlN, as the vaporised titanium-aluminium (cathode target) passes through the arc, it becomes ionised forming plasma. The plasma is directed towards the sub-strate's surface, and in the presence of nitrogen, forms a TiAlN coating. The kinetic energy of the depositing species in cathodic arc, are much greater than those of other PVD processes with energies between 50 and 150 eV. Therefore, the plasma becomes highly reactive as a greater percentage of the vapour is ionized. In addi-tion, the cathodic arc process allows tailoring of the interfacial products, especially in multilayer coatings, and does not produce a distinct coating/substrate interface, which may be undesirable. As a result of the high kinetic energy, an intermixed layer of the sub-strate and coating or between layers of a multilayer coating (1e30 nm thick) can be formed that increases the degree of coating adhesion while minimizing residual stresses.
The main disadvantage of cathodic arc deposition is that it produces macroparticles of metals and liquid droplets that are the result of intense, localized heating from the arc. This heating pro-duces small amounts of liquid metal that become entrapped within the depositing coating and serve as stress concentrations and crack initiation sights. To decrease the number of molten macroparticles,
filtered cathodic arc systems are often used. An electromagnetfield is applied, and due to momentum, the larger macroparticles do not deposit on the substrate surface as they getfiltered away from the substrate. In general,filtered arc deposition usually has a lower deposition rate than unfiltered. In addition, target efficiency can be increased by steering the arc across the cathode surface. A magnetic
field is applied that steers the arc across the surface of the targets and thus reduces the dwell time (localized heating) at any given point.
In the present case, diffraction pattern recorded on the coating suggests that it is Ti0.65Al0.35N (ICDD 04-017-5094). The crystal structure is a cubic rock salt type with the Ti and Al atoms occu-pying the FCC positions and N sitting interstitially.
3.2. Measurement of bulk elastic properties
Nanoindentation has been established as an effective tool to measure the bulk elastic properties[19]. For such elastic modulus measurements, the coated sample was cut and mounted in cross-section, which was ground and polished with colloidal silica OPS. For the indentation experiments, a MTS Nanoindenter XP (Agilent Technologies) was employed. The position of the coating layer was defined using the nanovision stage based on the variation in topography arising from the polishing process. The sample was held on a pneumatic-vibration-isolation table, which was enclosed in a cabinet to ensure thermal stability. Indentation was carried out using the Dynamic Contact Module (DCM II) equipped with a Ber-kovich triangular-diamond pyramid tip. The indent depth was set at 200 nm and 20 indents, located along the centreline of the coating, were recorded for the elastic modulus measurements. The Poisson's ratios were taken from literature with 0.23 for TiAlN[20] and 0.34 for ZIRLO™[2].
3.3. In-situ loading in SEM
In-situ loading using a Kammrath&Weiss micro-tensile-testing
device was conducted in a FEI Quanta 650 field emission gun scanning electron microscope (FEGSEM), operating at an acceler-ating voltage of 20 kV in backscattered electron imaging (BSE) mode.
One purpose of this in-SEM loading experiment was to obtain the fracture (maximum elastic) strain of the TiAlN coating by analysing the images recorded during mechanical loading using digital image correlation. Specimens were strained in increments of 0.05% using a crosshead speed of 5.0
m
m/s. A BSE image of the central gauge region of the specimen was taken after each strain increment. Once thefirst crack was observed, the step size was increased to 0.1% at the same strain rate in order to determine the saturated crack spacing. Each image was taken at afixed magnifi -cation and 5 tensile samples were measured to get statically vali-date results.A systematic measurement of the crack spacing data at each strain level was conducted using ImageJ®image analysis software using a standard line intercept method[16].
3.4. X-ray diffraction sin2
j
method for residual stress analysisResidual stresses in the coating were determined initially by using the sin2
j
method on a Bruker Discover D8 (Cu tube X-ray Table 1Summary of the necessary experimental parameters.
Parameters Measurement method
EcEs: Elastic modulus Nanoindentation
εcf: Strain at crack initiation Digital image correlation d: Coating thickness Microscopy
sr: Residual stress Raman spectroscopy/XRD Z: Average saturated crack spacing In-situ tensile testing
source). A Ni k-
b
filter together with a polycapillary was applied to ensure a parallel beam configuration. Alignment was confirmed by analysing a standard corundum sample with known peak positions. The fundamental equation relating stress and strain for a rota-tionally symmetric biaxial stress state is[21]:dj d0 d0 ¼
1=2Shkl2 s
jjsin2jþ2Shkl1 s
jj (27)
wheredjis the d-spacing measured at a particular tilt angle,
J
,d0 is the stress free lattice parameter, 1=2Shkl2 andShkl1 are diffraction elastic constants ands
jjis the residual stress. Differentiating with respect to sin2
J
gives:vdfj
vsin2j¼1=2S
hkl
2 sfd0 (28)
From this equation it follows that a plot of d-spacing v.s. sin2
J
should be linear with a gradient proportional to the residual stress. d0can be determined by interpolation of the d-spacing v.s. sin2
J
data to the strain free direction of the biaxial stress state,j*hkl[21]:j*hkl¼sin 1
The diffraction elastic constants, 1=2Shkl
2 andShkl1 , were inferred from single crystal elastic constants for TiAlN (C11¼447, C12¼158, C44¼203[22]) using the Kroner model via the software IsoDEC€
[23].
Residual stress in the sample was determined from 3 different diffraction peaks (200, 311 and 222), by independently analysing the d v.s. sin2
j
behaviour of the individual reflections. Scans were conducted inj
mode (i.e. the sample is tilted in a plane perpen-dicular to that containing the source and detector).The 200 peak was not overlapped by substrate peaks, which leant itself to a straightforward analysis of stress using a standard symmetric geometry (i.e. the angle between the X-ray beam and sample surface is half of 2
q
). For the analysis of diffraction peaks in this geometry, data wasfirstly background corrected, before an absorption,Aq2q, (Eq. (30))[21]and Lorentz polarisation,Lp, (Eq. (31))[21]correction.where
m
is the linear absorption coefficient (0.0574m
m 1),t the coating thickness andq
the diffraction angle. After correction, peaks were fitted using a PearsonVII function to determine the peak centres.Conversely, the 311 and 222 peaks were severely overlapped with reflections from the substrate. Therefore, an asymmetric diffraction geometry was needed to lower the X-ray penetration and to limit the influence of the underlying Zr peaks. It was found that an incident angle of 10(between the source and the sample surface) would lower the intensity of the Zr peaks (at
j
¼0) to a level where they were no longer significant. The intensity of the 0114 Zr peak, with different incident angles, was monitored to determine this.In an asymmetric diffraction configuration a constant incidence angle, of 10in this case, is used for all
j
tilts. The sample tilts with this geometry no longer correspond with those in the symmetricq
e2q
geometry. A coordinate transformation is therefore needed[24]:cosj¼cosðq aÞcosjd (32)
where
j
dis the tilt angle of the diffractometer andJ
is then the tilt angle corresponding to that inq
e2q
geometry. Again the diffraction profiles were absorption,Aa, and Lorentz polarization,Lpacorrected [24]:where
a
is the X-ray incidence angle.Lpa¼
1þcos22q
sin2q (36)
The peak position is also affected by refraction and the peak position within the material, 2q0j, is given by:
tan2q0j ¼ tan
and n is the refraction coefficient (for TiN, n¼0.9999845[24]). In addition to single peak analyses, residual stresses were also determined by studying whole diffraction patterns at a number of
j
angles. Rietveld analyses were conduced to determine the lattice parameter at each
j
angle. A plot of lattice parameter,a, against sin2j
was produced and residual stresses calculated according to Eq.(28), but with the d-spacing of the individual reflection replaced with the lattice parameter. By using this method the hkl depen-dence is lost and therefore bulk elastic constants can be used instead of diffraction elastic constants. Bulk constants can be measured more easily and indeed have been obtained experi-mentally in this work using nano-indentation. This technique also limits any issues related to plasticity, which can cause diffraction peaks to display non-linear strain behaviour with stress.For the Rietveld analysis diffraction patterns were obtained in symmetric diffraction geometry. While this geometry created some overlapping of substrate and coating reflections, it did not pose a problem to obtain reliable data as the Rietveld method uses the whole diffraction pattern rather than an individual peak[25].
3.5. Micro-Raman spectroscopy for residual stress analysis
In addition to XRD based residual stress analysis, residual stresses of the coating were estimated by employing a micro-Raman spectrometer (Renishaw-2000) with green laser light (wavelength of 633 nm) and a spot size of ~2
m
m. The spectral resolution of the spectrometer was 1 cm 1, and a depth in the coating of around 1e2m
m is sampled.Before testing, the Raman spectroscope was calibrated using a silicon (Si) single-crystal sample using the characteristic Si peak at a wavenumber of 520 cm 1. Raman peaks were fitted using the Gaussian peak fitting function provided by commercial software Origin®
. The standard deviation for the characteristic Si peak shift was±0.1 cm 1giving a stress resolution of±0.1 GPa.
In order to calibrate the behaviour of the Raman peak shift with stress (i.e. to get a peak shift per increment of stress value) a series of known uniaxial loads were applied to the sample using a Kammrath&Weiss micro-tensile-testing device while determining
the Raman peak position. The laser spot was positioned at the centre of the analytical area. Images and Raman spectra were ob-tained using a light optical microscope with a 50 (numerical aperture ¼0.75) objective lens, before and after each load step during the in-situ loading experiment, without laser light polar-isation. Note that the gauge length of the tensile specimen was approximately 30 mm. At each loading step, a difference in peak position of less than 0.1 cm 1(equivalent to 56 MPa) was found across multiple locations. Raman measurements were undertaken at four different load levels for calibration purposes. Subsequently, the same loading experiments were repeated in a SEM in order to obtain the corresponding strain levels through digital image anal-ysis. The strain was subsequently converted to stress using the Young's modulus of the coating, which had been determined by nano-indentation (Section3.2).
Additionally, a stress-free Raman peak position value is needed before the residual stress in the coating can be determined. This was obtained by further loading the sample to induce cracks in the coating. The sample was subsequently unloaded and Raman mea-surements were undertaken at multiple locations at the fragment ends near the cracks. The crack provides an additional free surface and therefore the stress is zero at the ends of coating fragments near the crack. The average stress free TiAlN peak position was located at 249.6 cm 1, which is similar to the literature values for stress-free TiAlN[26].
Following[19], the stresses canfinally be estimated from the Raman characteristic peak shift through the following equation:
sr¼Dv .Y
u (42)
where
D
v is the Raman peak shift (cm 1), andP
u is the uniaxial piezospectroscopic coefficient (cm 1/GPa), which was calibrated experimentally in this work.4. Experimental results
4.1. Coating thickness and elastic constants
In order to evaluate the interfacial shear strength precisely the aim was to measure the parameters in Equation (26) with high accuracy.
Firstly, the coating thickness was measured with SEM cross-sectional images at multiple locations. Average coating thickness was observed at ~8
m
m.The modulus of the TiAlN coating was determined from 20 nanoindents to be 406.5 GPa±5.3 GPa. The lateral extent (500 nm)
of each indent was optimised to reduce any influence from either the substrate or the resin material. Measurements near the edges were excluded as a reduction in modulus was observed close to the coating surface.
Similarly, the Young's modulus of the ZIRLO™substrate (Es) was measured to be 105.7 GPa±1.6 GPa. Note that for ZIRLO™modulus measurements, a total number of 200 nano-indents were collected to obtain a representative value for the given loading direction. In addition, the nano-indentation depth was 500 nm, which yields an approximate lateral width of the affected zone of 2.5 micron.
The diffraction elastic constants, 1=2Shkl
2 and Shkl1 , for the
re-flections used for XRD residual stress analysis are given inTable 2.
4.2. Residual stress analysis
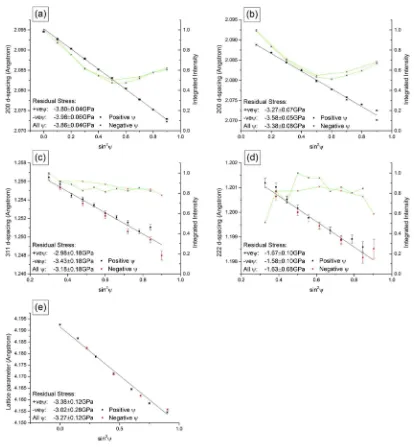
For the residual stress determination based on XRD, the 200 reflection was analysed using a standard symmetry geometry as well as an asymmetric diffraction geometry while the other two reflection were analysed using an asymmetric diffraction geometry only. Together with the Rietveld analysis, this gave the residual stress data presented inTable 2 and Fig. 2. Penetration depths (depth that contains 63% of the integrated intensity[21]) for the various reflections and diffraction geometries are also included in Table 2.
The results obtained from the 200 reflection in both diffraction geometries are fairly consistent ( 3.9 and 3.4 GPa), differing by about 10% (Fig. 2). The result from the 311 reflection was very similar to the result from the 200 reflection measured in asym-metric geometry. However, the stress analysis based on the 222 reflection alters noticeably, giving 1.6 GPa. The result from the Rietveld analysis, 3.3 GPa, corresponds well with the result ob-tained from the 311 and 200 reflections.
Fig. 3displays the shift of the characteristic 249.6 cm 1Raman peaks and the 684.7 cm 1peak as a function of stress. In the case of the 249.6 cm 1peak a linearfit gave a slope of 0.016 and a y-axis intercept of 254.3 cm 1, while the 684.7 cm 1peak gave a linearfit of 0.034 for the slope and a y-axis intercept of 649.9 cm 1. The amount of Raman peak shift between 0.0% strain to 0.3% strain deformation for the two characteristic peaks were determined to be 2.36 cm 1(for the characteristic 249.6 cm 1peak) and 5.11 cm 1 (for the 684.7 cm 1 peak), with corresponding stress increase of 1325 MPa±60 MPa.
Therefore the uniaxial piezospectroscopic coefficient for the two
TiAlN Raman characteristic peaks were calculated to
be: 1.78 cm 1/GPa (for the characteristic 249.6 cm 1 peak) and 3.85 cm 1/GPa (for the 684.7 cm 1peak).
By implementing Eq.(42), the residual stress obtained in this way is 2.64 GPa (±0.35 GPa) for the 249.6 cm 1 peak and e 2.65 GPa (±0.30 GPa) for the 684.7 cm 1peak.
4.3. Coating fracture stress
The in-SEM loading experiments revealed that thefirst cracks appear for a corresponding strain of 0.84% ± 0.02%, Fig. 4 (c), resulting in an applied stress of 3.42 GPa± 0.09 GPa (¼Ec$εcf). Propagated error was calculated using defined functions according to[27]. The coating fracture strength (
s
applied_stressþs
residual_stress) is therefore 150 MPa. The error in the fracture strength is discussed further in section5.2.With increasing strain, further cracks appeared prior to reaching a saturation state, as shown inFig. 4(d), after which little change in crack spacing was evident. The average crack spacing at saturation was measured to be 31
m
m±7.1m
m.4.4. Interfacial shear stress (ISS) distribution analysis
Equation(26)shows that the maximum interfacial shear stress (bond strength) is a function of residual stress. Here the Rietveld XRD residual stress value of 3.27 GPa (±0.12 GPa) was used for interfacial shear strength evaluation. The reason for this choice is given in the discussion. By substituting all the measured or
calculated parameters into Equation(26), the maximum interfacial shear stress between the TiAlN and ZIRLO substrate was calculated to be 120 MPa.
Note that the uncertainty of the results was associated in each step of the experimental measurements, but the propagation of errors through calculation were defined using statistical functions [27]. Although the uncertainty in residual stress is thought to be Table 2
Summary of residual stress results. 1=2S2andS1values for the Rietveld analysis were calculated using bulk modulus and Poisson's ratio values.
Peak Shkl
1 10 6MPa1 1=2Shkl2 10 6MPa1 Geometry Incident anglea Penetration
depth Sin2j¼0
Penetration depth Sin2j¼0.9
Residual stress GPa
200 0.598 3.106 Symmetric q 3.26mm 1.03mm 3.86±0.04
200 0.598 3.106 Asymmetric 10 2.31mm 0.73mm 3.38±0.08
311 0.524 2.882 Asymmetric 10 2.54mm 0.80mm 3.18±0.18
222 0.440 2.631 Asymmetric 10 2.56mm 0.81mm 1.63±0.08
Rietveld 0.615 3.075 Symmetric q 3.27±0.12
Fig. 2.d-spacing v.s. sin2jfor (a) the 200 peak in symmetric configuration, (b), (c) and (d) for the 200, 311 and 222 peaks respectively in asymmetric configuration, using a 10 incident angle. (e) lattice parameter v.s. sin2j. Note that the green lines are for intensity and the black lines for the linearfitting of d-spacing v.s. sin2j. (For interpretation of the references to colour in thisfigure legend, the reader is referred to the web version of this article.)
small in relative terms, it is significant, 120 MPa, in absolute terms, and is also large compared to the interfacial shear strength. The uncertainty in the residual stress value may therefore have quite a large impact on the interfacial shear strength, and the actual value may be significantly higher than 120 MPa.
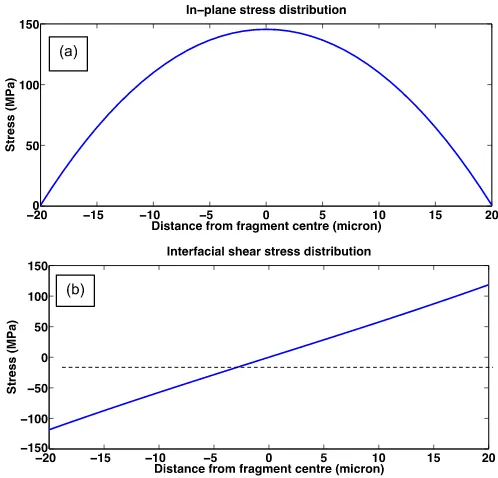
Using the parameters inTable 3the distribution of the interfa-cial shear strength and in-plane stress along a fragment at crack saturation level is plotted,Fig. 5, according to Equation(18) and Equation(17).
5. Discussion
5.1. Residual stress
One of the initial issues encountered in this work was the great variation of residual stresses when using different diffraction peaks or Raman spectroscopy. In metallic materials, the correct choice of reflection is known to be critical for accurate stress analysis by X-ray diffraction since only particular reflections maintain a linear relationship between macroscopic stress and elastic strain in a plastically deformed polycrystalline aggregate. Considering the absence of significant plasticity in TiAlN, one might expect that intergranular strain effects are less of concern here. As two out of the three individually measured reflections agree well with the Rietveld analysis, it might well be the case that the 222 reflection was slightly affected by an underlying Zr substrate reflection. Near surface residual stress profile analysis has been proposed by the use of energy dispersive diffraction taking advantage of the different
penetration depth of the various diffraction peaks for such set up [28]. The use of multiple peaks to analyse the residual stress in ti-tanium nitride coatings has also been advocated[29]. Clearly, the present results demonstrate that such an approach is not valid in the case of TiAlN coatings.
It is also interesting to note that previous residual stress analysis of TiAlN coated samples revealed very similar variations with the 200 reflection indicating ~4 GPa while the 111 reflection only suggested stresses in the range of 1.5 GPa[30]. It was explained that this discrepancy might have been the result of diffraction peaks overlapping with those of a different layer in a multi-layer structure.
Rietveld analysis to accurately determine the lattice parameter for residual stress analysis is generally considered to be the most reliable approach as it has been shown to minimise the effect of intergranular strain on stress analysis[31] and relies on a large number of reflections rather than a single peak. Hence, a Rietveld analysis does not only use a single crystallographic grain family but represents more a bulk response of the material. The Rietveld approach also removes the need to use diffraction elastic constants, which can be difficult to obtain (in this work ab-initio single crystal elastic constants were used from literature and converted to diffraction elastic constants). The Raman spectroscopy analysis gave a considerably higher uncertainty compared to the Rietveld analysis. Considering a spot size of about 2
m
m, it is also difficult to verify that the positions very near the crack edge are indeed stress free. Considering the high reliability from the Rietveld analysis, it was decided to employ the residual stress value obtained from the Rietveld analysis when calculating the interfacial shear strength.5.2. Interfacial shear stress (ISS) distribution between TiAlN and ZIRLO substrate
The interfacial shear stress (ISS) and fracture stress are inferred from different experimental measurements to be 120 MPa and 150 MPa from this work. For each separate experiment critical to the ISS calculation, multiple measurements were taken to get statically validate results. The uncertainty in ISS and fracture strength was calculated using the “propagation of uncertainty theory”commonly used in statistical data analysis, where errors were calculated using defined functions detailed in[27]. Both of these values rely on the addition of the applied tensile stress with the compressive residual stress (see Eq.(26)). The uncertainty in both the applied stress and residual stress (90 MPa and 120 MPa respectively), although small in relative terms, are large in absolute terms and especially large in relation to the interfacial shear strength and fracture strength. Therefore, the interfacial shear strength and fracture strength also have large uncertainties asso-ciated with them, and are only a best estimate.
The shear-lag model predicts a peak shear stress of ~120 MPa in the vicinity of the fragment ends which may be sufficient to introduce small scale yielding in the substrate. Using the Mises' yield criterion[32], local yielding would occur if the yield stress of the substrate
s
0is given bys0< ffiffiffi 3 p
$timax (43)
where
t
imax is the maximum interfacial shear strength possible (upper limit). It's been reported that the yield strength of zirconium alloy (substrate) is approximately 365 MPa[33]suggesting that local yielding of the substrate does not occur according to Equation (43).It is important to note that a number of researchers have used the Agrawal and Raj (A-R) model which assumes a sinusoidal shear stress rather than one that increases continuously towards the Fig. 3.Change of Raman peak position for (a) characteristic 249.6 cm 1Raman peaks
and (b) 684.7 cm1Raman peaks during in-situ loading as a function of relative stress increase. The Raman spectra were taken at stain levels of 0.0%, 0.1%, 0.2% and 0.3%.
fragment ends[8,13]as one might expect. For the A-R model the maximum interfacial shear stress (bond strength) is expressed:
timax¼Ec$εcfþsr $ p$d 1:5$Z
(44)
The A-R model would give an interfacial shear stress estimate (80 MPa), approximately a third smaller than for our approach.
The coating fracture stress is not considerably higher than zero, which suggests that the coating cannot withstand a significant tensile load and fractures almost as soon as the compressive re-sidual stress is overcome by tensile loading. Despite this, the applied tensile stress required to cause fracture is high because of the large compressive residual stress in the coating, which needs to be overcome before the coating can go into tension and fail.
The moderate fracture strength and interfacial shear strength would however have implications if these coatings were to be used in service, as irradiation enhanced creep and irradiation induced
Fig. 4.Backscattered electron (BSE) images showing (a) the TiAlN surface before deformation; (b) image obtained at a deformation level of 150mm; (c) transverse cracksfirst to appear at a strain level of 0.84%; and (d) cracks at saturation. Note that the features highlighted in the blue boxes were used to calculate the local strain. The transverse cracks in Figure (d) were highlighted as black lines. (For interpretation of the references to colour in thisfigure legend, the reader is referred to the web version of this article.)
Table 3
Measured and inferred coating parameters for the determination of interfacial shear strength between TiAlN and ZIRLO substrate.
Parameters Values Uncertainty Status
TiAlN coating thickness (mm) 8.0 ±0.18 Measured Steady state crack spacing (mm) 231.0 ±7.1 Measured Coating bulk modulus Ec (GPa) 406.5 ±5.3 Measured Substrate modulus Es (GPa) 105.7 ±1.6 Measured Maximum elastic strain level (%) 0.84 ±0.02 Measured Residual stress (GPa) 3.27 ±0.12 Measured Applied stress (GPa) 3.42 ±0.09 Inferred Fracture strength (MPa) 150 ±150 Inferred Interfacial shear strength (MPa) 120 ±120 Inferred
Fig. 5.Inferred distribution of (a) in-plane coating stress and (b) interfacial shear strength at crack saturation, calculated using the shear-lag model. The horizontal (dashed) line denotes zero stress. Note the length of this predicted crack is the critical crack length when the maximum stress is equal to the fracture stress. Note that the positive and negative signs on the x-axis indicates different directions away from the crack centre.
growth would likely impose a tensile load on the coating. This tensile load may be able to overcome the initial compressive re-sidual stress in the coating and potentially cause coating fracture.
6. Limitations
Thefindings of the current study should be interpreted with caution due to several limitations. The shear-lag model was set-up in a two-dimensional Cartesian coordinate and the whole coating-substrate system was deformed under a uniaxial loading condition. In reality though, the cladding is in the form of tubes, i.e. circum-ferential geometry. The actual deformation mechanism and stress state would be different compared with the results presented in this work. Nevertheless, the calculated interfacial shear strength is useful as an indication of the bond properties, especially for pro-totype sheet sample products. In addition, the interface was treated as a homogeneousflat region in this work. However, the interface roughness will somewhat influence the load transfer from the substrate to the coating hence affect the interfacial shear strength calculation. Thus, the interfacial shear strength calculated from this study should be considered as an average value of the bond strength rather than a precise measurement of the site-specific interface properties. It is also worth noting that the tests were done at ambient temperature. The performance of the proposed coating at either normal or off-normal service condition is worth investigating, and this is considered in future work.
7. Conclusions
A modified shear-lag model has been presented in this paper to estimate the interfacial shear and fracture strength of a TiAlN coating adhered to a ductile ZIRLO™substrate.
The results indicate that during loading of the TiAlN layer transverse cracks, normal to the deformation direction, start to appear at a strain level of 0.84%. With further deformation, more transverse cracks form between existing cracks until a saturation level is reached.
Both Raman and XRD stress measurement show that highly compressive residual stresses remain in the coating after the deposition process. At ambient temperature, soon after the applied stress exceeds the residual stress, cracks start to appear in the TiAlN coating.
The interfacial shear strength between TiAlN and ZIRLO™ sub-strate has been estimated to be ~120 MPa using the modified shear-lag model, with coating fracture strength of ~150 MPa inferred from the experimentally measured parameters. Hence, the proposed coating candidate demonstrates adequate bonding property. One should note that the coating fails almost as soon as the compressive residual stress is overcome, i.e. most of the apparent strength of the coating comes from the fact that the approximately 3 GPa compressive stress must be overcome before the coating can fail in tension. The moderate fracture strength may have implications if these coatings were used in service, as irradiation enhanced creep
and irradiation induced growth would likely impose a tensile load on the coating.
The work demonstrates that X-ray diffraction based residual stress analysis and interfacial shear strength analysis by the com-bination of multiple techniques can be used in the future to assess bond strength and coating stresses for different manufacturing parameters. It is also planned to use this methodology to determine the evolution of those properties with temperature exposure and autoclave testing.
Acknowledgements
We would like to acknowledge the support of EPSRC through the project of“Ceramic Coatings for Clad (The C^3 Project): Advanced Accident-Tolerant Ceramic Coatings for Zr-alloy Cladding”(Grants EP/K039237/1). Also this research was funded under a DOE-NEUP Integrated Research Project under contract number 12-4722.
References
[1] M.K. Kumar, et al., Mater. Corros. 65 (3) (2014) 244e249. [2] E. Polatidis, et al., J. Nucl. Mater. 432 (1e3) (2013) 102e112. [3] I. Kim, et al., J. Nucl. Mater. 429 (1e3) (2012) 143e148. [4] F. Khatkhatay, et al., J. Alloys Compd. 580 (2013) 442e448. [5] P.A. Rossross, C.E.L. Hunt, J. Nucl. Mater. 26 (1) (1968) 2. [6] G.S. Was, et al., J. Nucl. Mater. 300 (2e3) (2002) 198e216. [7] G.S. Was, et al., J. Nucl. Mater. 371 (1e3) (2007) 176e201. [8] D.C. Agrawal, R. Raj, Acta Metall. 37 (4) (1989) 1265e1270. [9] M.S. Hu, A.G. Evans, Acta Metall. 37 (3) (1989) 917e925. [10] M. Yanaka, et al., J. Mater. Sci. 33 (8) (1998) 2111e2119. [11] B.F. Chen, et al., Surf. Coatings Technol. 126 (2e3) (2000) 91e95. [12] U.A. Handge, J. Mater. Sci. 37 (22) (2002) 4775e4782.
[13] D.C. Agrawal, R. Raj, Mater. Sci. Eng. A-Struct. Mater. Prop. Microstruct. Pro-cess. 126 (1990) 125e131.
[14] W.N. Liu, et al., Metall. Mater. Trans. A-Phys. Metall. Mater. Sci. 42A (5) (2011) 1222e1228.
[15] X.C. Zhang, et al., Comput. Mater. Sci. 50 (1) (2010) 246e252. [16] S. Zhang, et al., Eng. Fract. Mech. 74 (12) (2007) 1884e1893. [17] L. Gan, H. Wang, R.M. Pillar, Biomaterials 26 (2) (2005) 189e196.
[18] T.W. Clyne, P.J. Withers., 1993, Cambridge: Cambridge : Cambridge University Press.
[19] X. Li, B. Bhushan, Mater. Charact. 48 (1) (2002) 11e36.
[20] ø. Szparaga, J. Ratajski, A. Zarychta, Arch. Mater. Sci. Eng. 48 (1) (2011) 33e39. [21] Birkholz, M., 2006: Wiley.
[22] F. Tasnadi, M. Oden, I.A. Abrikosov, Phys. Rev. B 85 (14) (2012). [23] T. Gnaeupel-Herold, J. Appl. Crystallogr. 45 (2012) 573e574.
[24] T. Dummer, B. Eigenmann, D. Lohe, in: European Powder Diffraction, Pts 1 and 2, 321e3, 2000, pp. 81e86.
[25] L. Lutterotti, Nucl. Instrum. Methods Phys. Res. Sect. B-Beam Interact. Mater. Atoms 268 (3e4) (2010) 334e340.
[26] C.P. Constable, J. Yarwood, W.D. Munz, Surf. Coatings Technol. 116 (1999) 155e159.
[27] Bevington, P.R. and D.K. Robinson, 2003: McGraw-Hill.
[28] C. Genzel, C. Stock, W. Reimers, Mater. Sci. Eng.A-Struct. Mater. Prop. Micro-struct. Process. 372 (1e2) (2004) 28e43.
[29] C. Quaeyhaegens, G. Knuyt, L.M. Stals, J. Vac. Sci. Technol. A-Vacuum Surfaces Films 14 (4) (1996) 2462e2469.
[30] E. Vogli, et al., Appl. Surf. Sci. 257 (20) (2011) 8550e8557. [31] M.R. Daymond, et al., J. Appl. Phys. 82 (4) (1997) 1554e1562. [32] Dieter, G.E., Vol. 3. 1976: McGraw-Hill New York.