A whole body vibration perception map and associated acceleration
loads at the lower leg, hip and head
Anelise Sonza
a,b,∗, Nina Völkel
b, Milton A. Zaro
a, Matilde Achaval
a, Ewald M. Hennig
baPost-graduate Program in Neurosciences, Instituto de Ciências Básicas da Saúde, Universidade Federal do Rio Grande do Sul, Sarmento Leite, 500, 90050-170,
Porto Alegre, Brazil
bBiomechanics Laboratory, Institute of Sport and Movement Sciences, University Duisburg-Essen, Gladbecker Str. 182. 45141, Essen, Germany
a r t i c l e
i n f o
Article history: Received 25 May 2014 Revised 21 January 2015 Accepted 16 April 2015 Available online xxx
Keywords:
Whole body vibration Discomfort rate Borg scale
Vibration perception map Accelerometry Vibration transmission
a b s t r a c t
Whole-body vibration (WBV) training has become popular in recent years. However, WBV may be harmful to the human body. The goal of this study was to determine the acceleration magnitudes at different body segments for different frequencies of WBV. Additionally, vibration sensation ratings by subjects served to create perception vibration magnitude and discomfort maps of the human body. In the first of two experi-ments, 65 young adults mean (±SD) age range of 23 (±3.0) years, participated in WBV severity perception ratings, based on a Borg scale. Measurements were performed at 12 different frequencies, two intensities (3 and 5 mm amplitudes) of rotational mode WBV. On a separate day, a second experiment (n=40) included vertical accelerometry of the head, hip and lower leg with the same WBV settings. The highest lower limb vibration magnitude perception based on the Borg scale was extremely intense for the frequencies between 21 and 25 Hz; somewhat hard for the trunk region (11–25 Hz) and fairly light for the head (13–25 Hz). The highest vertical accelerations were found at a frequency of 23 Hz at the tibia, 9 Hz at the hip and 13 Hz at the head. At 5 mm amplitude, 61.5% of the subjects reported discomfort in the foot region (21–25 Hz), 46.2% for the lower back (17, 19 and 21 Hz) and 23% for the abdominal region (9–13 Hz). The range of 3–7 Hz represents the safest frequency range with magnitudes less than 1 g∗sec for all studied regions.
© 2015 IPEM. Published by Elsevier Ltd. All rights reserved.
Abbreviation
WBV whole body vibration.
1. Introduction
Human exposure to vibration includes a wide range of topics in different areas of research, including health sciences and engineering. Research articles have demonstrated that WBV therapy can bring ben-efits for improving muscle strength[5,22], bone remodeling[23,30] and for Parkinson’s disease[12,14]. However WBV can also cause neg-ative effects by decreasing the sensitivity of fast-adapting mechanore-ceptors in the human skin, and affecting balance[11,26,27]; its effects can range from no effect to potentially harmful, depending on the variables selected[10,13,24].
Although WBV uses frequencies and amplitudes lower than occu-pational vibrations, a study[1]estimated that the WBV settings in common vibration training sessions (10 min per day, 30 Hz and 4 mm amplitude) exceeded the recommendations of the International Or-ganization for Standardization (ISO 2631—1:1:1997).
∗ Corresponding author: Tel.:+555132792458. fax:+55 51 3308 3092. E-mail address:[email protected],[email protected](A. Sonza).
Vibration effects on humans are manifold. Due to the large vari-ability of experimental designs, the results in scientific literature are often confusing. This is due to different vibration conditions (ampli-tude, frequency, oscillation mode), varying subject populations (age and health status), and different study designs. There is a need for research to determine the effects of WBV caused by changes in WBV frequencies and amplitudes[27]to various parts of the body.
In this article, emphasis will be placed on discomfort and vibration perception ratings as well as accelerometer measurements for differ-ent body parts in response to WBV exposure at 12 frequencies and two vibration amplitudes. Whole-body vibration training equipment produces high magnitude vibrations well above threshold detection. Subjects exposed to WBV often report discomfort in different parts of the body. Some studies have presented data about WBV transmissi-bility through the body of healthy[25]and injured individuals with conditions such as spinal cord injury[2]. However, in this study, WBV severity perception, discomfort rates and WBV transmissibility were measured.
The human body and its individual organs have different natu-ral frequencies. For example, vertical vibrations in the 5–10 Hz range generally cause resonance in the thoracic-abdominal system[21]. The mechanical energy transmission through the body caused by vibra-tions depends on body posture, body mass and muscle contracvibra-tions
http://dx.doi.org/10.1016/j.medengphy.2015.04.003
1350-4533/© 2015 IPEM. Published by Elsevier Ltd. All rights reserved.
Fig. 1. (a and b). Protocol timeline exemplifying the participant’s alignment (a) and the randomization method (b).
[18]. Resonance will occur if the external vibration frequency trans-mitted approaches or equals the natural frequency.
The entire body or affected body organs can vibrate at an ampli-fied magnitude which is greater than the external source vibration entering the body, especially, if the entering vibration is not damp-ened by other parts of the body before reaching a target organ[9,29] which might be painful for an individual. Normally, the commercially available WBV platforms have frequency ranges of 5–60 Hz, which means resonance of body parts can occur. Therefore the frequency-dependent magnitude of vibration loads on different parts of the body is of interest.
The following hypotheses were tested in our study: (A) The sub-jective perception of vibration intensity is different for various body parts; (B) Specific vibration frequencies can cause discomfort in dif-ferent body parts; (C) Vibration magnitudes at the lower leg, hip and the head vary with different WBV frequencies.
2. Material and methods
All participants signed a consent form and were informed about the research procedures and potential risks. The procedures were approved by the Ethics Committee of the University of Duisburg-Essen (protocol number 13-5652-BO) and were in accordance with the Declaration of Helsinki.
Data collection included anthropometrical measurements as body mass and height, perception of body vibration magnitude and dis-comfort at 12 frequencies between 3 and 25 Hz (3, 5, 7, 9, 11, 13, 15, 17, 19, 21, 23 and 25 Hz) and two intensities (3 and 5 mm amplitude). Two measurement series were performed on a rotational oscillation mode WBV platform. The first one lasted approximately 25 min and the second one 10 min. Data collection was done on two separate days to avoid any cumulative effects from the vibration. Between both measurement series a rest of at least 2 days was ensured.
The young healthy subjects were free from musculo-skeletal dis-orders and without cognitive or physical dysfunctions. Exclusion cri-teria were mainly epilepsy, insulin-dependent diabetes mellitus and other conditions, according to Bautmans et al.,[4]. All subjects were invited to take part in the two measurements series; however, due to time constraints only 40 subjects participated in both experiments.
2.1. First measurement series: WBV perception map and discomfort rate
Whole-body vibration training was performed on a vibration plat-form (Qionic-Board-Classic, QIONIC GmbH, Germany). The subjects stood comfortably on the vibration platform, bare foot, with knees slightly bent at approximately 10–15°in an upright position on a fixed support base. Two thin ropes were used to control the subjects’ alignment; the first one was positioned in front of the participant to avoid forward displacements of the trunk and the second one to achieve the best body posture alignment (Fig. 1, a). The equipment screen was remounted to prevent participants from seeing the
vi-Table 1
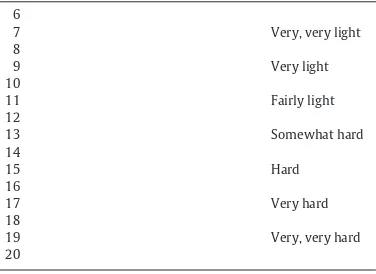
The 15-grade scale for ratings of perceived exertion[7].
6
bration frequency setting at which the vibration occurs. Prior to the experiment, subjects were exposed to all frequencies that they would experience during the measurements. Thus, they were able to sense all vibration modalities occurring in the following experiment.
Platform frequency accuracy was determined at 23 different fre-quency settings (3–25 Hz) by fast Fourier transform (FFT) analysis using the signals from a biaxial miniature capacitive accelerometer model DA 2202-033 (DisynetR
, Germany) with a measuring range of ±33 g. To determine the amplitudes for both vibration intensities of the WBV platform, an ink pen was attached to the platform at the two foot positioning lines on the plate. During these measurements a person with the same characteristics of the participants stood on the platform and the ink pen recorded the platform oscillation am-plitudes on a paper fastened to a stand perpendicular to the plate motion.
The frequency range for our experiments was limited to the avail-able range of the chosen WBV equipment. For both oscillation am-plitudes of 3 and 5 mm subjects were instructed to position the longitudinal axis of their feet on top of the foot positioning lines on the plate. The frequencies and amplitudes were randomized by intensity (two amplitudes) and four frequency increase or decrease sequence conditions (3–13 Hz up, 13 to 3 Hz down, 15–25 Hz up, 25 to 15 Hz down) (Fig. 1, b).
The body map vibration rating perceived exertion was assessed by a modified categorical Borg scale[7]. This 15-point scale (with values ranging from 6 to 20) has become a standard for rating perceived ex-ertion (Table 1). The validated Borg scale[8], translated into German, was used for the subjects to rate vibration magnitude for different parts of the body (head, trunk, upper limbs and lower limbs).
For each condition subjects were also asked to identify the region of the body where they felt most discomfort.
Trunk 3mm
5mm
Upper
Limbs 3mm
5mm
Head 3mm
5mm
and lower limbs). After finishing the Borg scale perception ratings for the four regions of the body, the subjects answered the following two questions: (1) Where in your body do you feel the strongest vibration? and (2) At which part of the body do you perceive discomfort?
After the first 12 vibration exposures the participants had a 5-minute break and then continued the second half of the experiment.
2.2. Second experiment: acceleration measurements
A second experiment was conducted with 40 subjects to measure the accelerations at the lower leg, hip, and at the head. These subjects were measured twice (in the first and second experiments) on two different days.
Three uniaxial miniature capacitive accelerometers, model DA 1202-033 (DisynetR
, Germany), were positioned and fastened at the tibia, spina iliaca anterior superior, and head. The participants were instructed to maintain a fixed bent knee position (between 10 and 15°), head straight and looking forward during the whole procedure. The same frequencies and amplitudes as used in the first experiment were applied.
Two accelerometers were fastened to the skin of the mid-portion of the tibia and the hip on the left side of the body. To decrease skin movement, an elastic rubber band was used to press the tibial accelerometer against the bone. The accelerometer was positioned halfway between the lateral malleolus and the tibial tuberosity. In order to reduce skin vibration at the hip an adjustable firm fitting weightlifter belt was used. The accelerometer was positioned on the belt at the anterior superior iliac spine location. The accelerometer for measuring head vibration was placed between the teeth. The subjects were required to bite and apply pressure to a thin layer of rubber that covered a metal bite bar on which the accelerometer was fastened. The disposable rubber material served to protect the teeth.
2.3. Statistical analysis
All variables (anthropometrical, subjective perception measure-ments and accelerometry data) were tested for normal distribution with the Kolmogorov–Smirnov test for the whole group and the Shapiro–Wilk test for gender comparison. Data were analyzed us-ing Statistical Package for the Social Sciences (Version 17.0, SPSS Inc., Chicago, IL, USA) software.
All anthropometrical data were normal for gender stratification; a mean comparison was applied for equal variances between two samples with a level of significance of
α
=.05.Despite the non-parametric nature of the body map vibration rat-ing perceived exertion data and participants’ subjective assessments of vibrations felt, differences between measurements for different frequencies and amplitudes of WBV exposition were analyzed with a multivariate analysis of variance test for multiple dependent vari-ables (MANOVA), with a level of significance of
α
=.01. With small sample sizes, non-parametric analyses are less likely to detect ef-fects, or the power is reduced, or the confidence intervals are wider. A non-parametric test applied to a large number of factors increases the chances of a Type I error[3,6]. After verification of the effects be-tween the variables, univariate analyses using Tukey’s post-hoc test were applied.The acceleration data were measured in multiples of g and pro-cessed for integrated full-wave rectified signals over a period of 2 s (g∗sec) for a better estimation of the mechanical load at each of the body locations. Since two measurement series were performed on different days, the variable values were averaged across the 2 days and used for further evaluation. The mean variation coefficient (VC) was smaller than 10% for all frequencies and amplitudes between days 1 and 2.
3. Results
3.1. Subjects
A total of 65 healthy subjects, 31 female and 34 male, mean (±SD) age of 23.0 (±3.0) years, mean height 177.3 cm (±9.1) and weight of 73.6 kg (±11.3) were invited to the Biomechanics Laboratory of the University of Duisburg-Essen (Germany), where the experiments were conducted. The subjects were physically active students who engaged in average of 9 h of exercise per week. Nine percent of them had been trained on vibration platforms before. The population was considered normal for the anthropometrical variables.
3.2. Vibration magnitude perception map of the body
Fig. 2. Subjective WBV severity perception (65 subjects) for different body parts while standing on a vibration platform for 12 frequencies (3–25 Hz) at two intensities (3 mm, 5 mm). Single values with standard error (SE) are presented.
The MANOVA, including frequency and amplitude as independent variables, gender as covariant and parts of the body as dependent vari-ables showed effects for all regions except the upper limbs (p=0.25; power=0.69) and amplitude for all regions (p<.01; power between 0.97 and 1). No interaction effects of amplitude versus frequency were found for the four regions.
The general pattern shows (Fig. 2) that vibrations are felt most in the lower limbs, followed by the trunk and head. Vibration magnitude perception was lowest at the upper limbs.
Table 2shows the homogeneous subset groups stratified by fre-quencies for subjective WBV severity perception. Vibration was felt strongest by the participants in the lower limbs. In general, exclud-ing bigger interpolation frequencies the followexclud-ing frequency ranges are the same according to the subjects’ perception: 3 and 5 Hz, from 9 to 15 Hz and between 21 and 25 Hz. The lower frequency range had a Borg scale perception around ‘fairly light’, for the intermediate (9–15 Hz) the perception was ‘hard’. Close to the high frequency range of 21–25 Hz the vibration perception was, according to the Borg scale, between ‘very hard’ and ‘extremely hard’ (Table 1,Fig. 2).
Summarizing the results for the trunk region at both intensities, there are two main frequency groups (Table 2). From 3–5 Hz and 11–25 Hz the vibration perception differs between but not within groups. The vibration perception was ‘very light’ and between ‘some-what hard and hard’, respectively (Table 1,Fig. 2).
No vibration perception differences were found for either intensity of the frequencies in the upper limbs region. This was the region where the subjects felt only a low vibration at all frequencies, judged according to the Borg scale as between ‘very, very light’ and ‘light’ (Table 1,Fig. 2).
For the head region at the low intensity condition (3 mm) a sig-nificant difference for the vibration perception inter groups for the subsets between 3 and 9 Hz and 13 and 25 Hz was found (Table 2). For frequencies above 13 Hz the subjects started to feel the vibration more in the head in comparison to the smaller frequencies, between ‘somewhat hard’ and ‘hard’, according to the Borg scale (Table 1, Fig. 2).
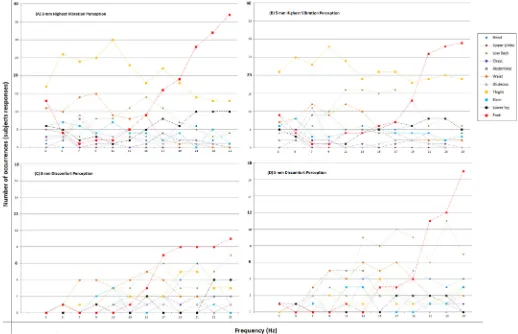
The participants answered two more questions about their vibra-tion percepvibra-tion: firstly, for each frequency they reported at which body part they felt the highest vibration (Fig. 3A and B), secondly, which body part they felt discomfort in for each frequency (Fig. 3C and D). It was possible to give more than one answer for the second question. The results are presented inFig. 3for both WBV intensities (3 mm—A, C and 5 mm—B, D).
In general, it can be observed from the graphs inFig. 3that per-ceptions of highest vibration in the body and most discomfort differ. Take as an example the vibration at the thigh (yellow line). Although thigh vibrations are felt very much in the frequency range 3–15 Hz (Fig. 3A and B), there is little discomfort associated with it (Fig. 3C and D). However, for the head, lower back, lower legs and foot regions the frequencies from the responses ‘feeling most’ and ‘discomfort’ are close or coincide.
Fig. 3. (A–D). Subjective WBV severity perceptions based on participants’ (n=65) subjective perceptions for different platform settings. Figures (A) and (B) represent the number
of responses by the subjects for which parts of the body the subjects felt the most vibration. Figures (C) and (D) represent the number of responses by the subjects for the body parts experiencing vibration discomfort.
For the 5 mm amplitude, the main frequencies causing the highest levels of vibration perception were: at points 13 and 19 Hz for the head (at points 15 and 19), 11–17 Hz for the lower back (at points 17 and 23), 9 Hz for the thigh (15), and between 21 and 23 Hz for the lower legs and 25 Hz for the feet (25).
3.3. Accelerometry vibration loads at tibia, hip and head
Across the body regions, all frequencies, both WBV intensities, and the peak accelerations measured by the three accelerometers placed on the tibia, hip and head covered a range from 0.1 to 10.7 g
(g=earth’s gravitational constant).
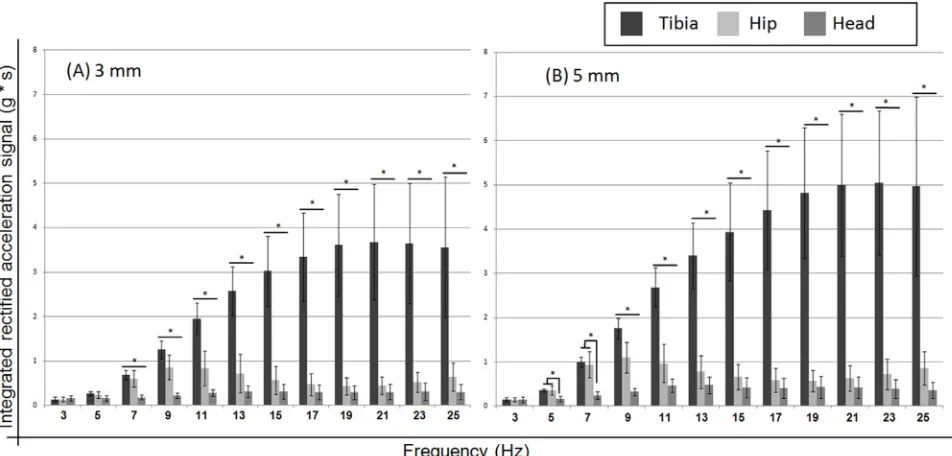
Fig. 4A and B summarizes the platform accelerations in axial di-rections transmitted to the regions of the tibia, hip and head. Great amplification of peak accelerations for these parameter settings oc-curred between 17 and 25 Hz for the region of tibia, 7–13 Hz for the region of hip and between 11 and 25 Hz for the head.
Comparing the regions of the body, the acceleration integrals for the low intensity (3 mm) vibrations differed between all three body regions (except for at 3, 5 and 7 Hz). For the high intensity (5 mm) vi-brations the acceleration integrals differed between all three body regions for all frequencies between 9 and 25 Hz. At 5 and 7 Hz, the acceleration integrals at the head differed from the hip and tibia (Fig. 4A and B).
Comparing the acceleration integrals between the two intensities
and three body regions, they differ (pࣘ.01) between all frequencies
except the frequencies 3 and 5 Hz for the head and 13 and 15 Hz for the hip.
There is a load increase at the tibia for the higher frequencies. However, the tibial loads remain similarly high from 17 Hz onward. At the hip, a loading peak occurs at 9 Hz, becoming smaller until 19 Hz and then increasing again for the highest frequencies. Head acceleration loads slowly increase with frequency and are highest at 13 Hz.
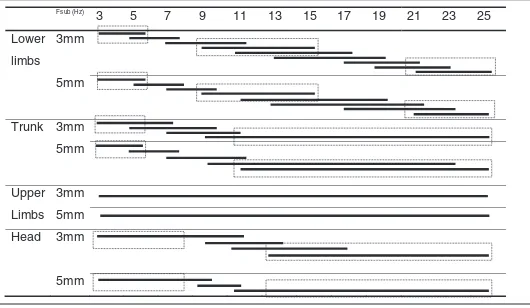
The homogeneous subset groups stratified by frequencies for the acceleration values for the regions of tibia, hip and head are presented inTable 3.
Acceleration values for the tibia region for both WBV intensities (Table 3) have the same frequency ranges (excluding greater inter-polation frequencies): 3 and 5 Hz, 13–15 Hz and between 21 and 25 Hz.
Summarizing the results for the hip region at both intensities,
there are three main homogeneous groups (Table 3). For the frequency
groups 3–5 Hz, 9–11 Hz, and 15–23 Hz the acceleration values differ between but not within groups. For the head region, two main homo-geneous subsets groups were found at 3–7 Hz and 11–25 Hz. Looking atTables 2and3, the main homogeneous groups of frequencies for subjective perception and acceleration values are similar, especially for the lower limbs and the head.
4. Discussion
Fig. 4.(A and B). Rectified integrated accelerations (2 s measuring interval) of the axial accelerations to the human body for different WBV platform settings. Mean intersubjects
and standard deviation (SD) are presented. Figure A represents the low (3 mm) and Figure B the high (5 mm) intensity WBV (n=40). Bars represent the comparison between the
body regions’ intra frequencies (pࣘ.01).
Table 3
Frequencies subsets (Fsub) for accelerometry (40 subjects) in the regions of tibia, hip and
head for 12 frequencies (3–25 Hz) at two intensities (3 mm, 5 mm). Individual bars represent groups of subsets with no statistically significant differences within the frequencies. Inter
groups subsets differ between themselves (pࣘ.01). Dotted boxes are the main subsets
groups. In general, the frequencies with more interpolations were not considered for the main subsets.
Fsub (Hz)
3 5 7 9 11 13 15 17 25 19 21 23
Tibia 3mm
5mm
Fsub (Hz)
3 5 19 21 17 23 15 7 25 13 11 9
Hip 3mm
Fsub (Hz)
3 5 19 21 17 15 23 13 25 7 11 9
5mm
Head Fsub (Hz)
3 5 7 9 25 23 15 17 19 21 11 13
3mm
5mm
determination of acceleration loads at the tibia, hip and head provide further information on the potential risks for the body. The subjective vibration magnitude perception of the body and greatest sensitivities reported may be related to resonance phenomena within the body. This study shows the results for 12 different WBV frequencies and two vibration magnitudes on vibration and discomfort perception. For the regions of the lower limbs, trunk and head, the subjective WBV severity perception based on the Borg scale increased with higher amplitudes and frequencies. However, for upper limbs it was similar across all frequencies and at two intensities (3 and 5 mm).
According to Thuong and Griffin[28]vibration frequency is the main cause of discomfort. A study that measured the vibration prop-agation in men with and without spinal cord injury[2]during passive WBV exposure in different postures, frequencies (25, 35 and 45 Hz)
and amplitudes (0.6 and 1.2 mm) of vibration found that variations in frequency caused the biggest changes in propagation characteristics followed by the knee angle and then amplitude, and this might have happened because both amplitudes were small. In our study, when the amplitude of the platform was increased from 3 to 5 mm the acceleration magnitudes were about 0.7 times higher.
Thresholds for the perception of whole-body vibrations when sit-ting, standing or lying vary with the frequency and direction of vibra-tion, with sensitivity being generally greater when lying than when sitting or standing[19,20]. Such findings have influenced standard-ized frequency weightings for evaluating vibration with respect to the probability of perception[15].
consider that our subjects were healthy sports students and discom-fort ratings are likely to be different for patients and/or elderly sub-jects. However, at 5 mm amplitude, 61.5% of our healthy sport stu-dents felt discomfort in the foot region in the range between 21 and 25 Hz. For the lower back region 46.2% felt discomfort at the fre-quencies of 17, 19 and 21 Hz and 23% felt abdominal discomfort in the frequency range of 9–13 Hz. Discomfort can be related to res-onance phenomena within the body and must be considered as a possible source of undesirable side effects of using WBV[23]. Our re-sults show that perceptions of highest vibration in the body and most discomfort can differ. However, for the regions of head, lower back, lower legs and foot the frequencies from the responses ‘feeling most’ and ‘discomfort’ are close or coincide.
As expected, the highest acceleration loads occurred at the tibia, with maximal values between 19 and 25 Hz. For the hip, the highest acceleration load was at 9 Hz and for the head at 13 Hz. A study[16]
measured four subjects on a WBV platform at different frequencies and amplitudes. For a WBV platform, operating in vertical mode, the authors reported substantial amplification of peak acceleration be-tween 10 and 25 Hz for the knee region, 10 and 20 Hz for the hip, 10 and 40 Hz for the ankle and 10 Hz for the spine. Kleinöder and Mester
[17]measured 30 subjects on a Galileo 2000 platform at different fre-quencies. The subjects performed squats with added weights to the body on the vibration plate. The authors found the highest transmis-sion was to the head at low frequencies.
Transmission decreases rapidly for frequencies higher than 15 Hz
[18]. These findings differ from our results. This may be due to the different position on the vibration plate or due to the additional load which was used.
A study by Abercromby et al.[1]found that the transmission of mechanical vibration energy at 30 Hz and 4 mm amplitude was 71– 189% greater in the upper body and head for platforms generating vertical oscillations compared with platforms working in a pivotal vibration mode. This means that rotational vibrations, as used in this study, are likely to be less harmful compared to vertical oscillations. However, the further apart your feet are from the equipment axis (amplitudes can reach 14 mm in some machines) the mechanical load on the body increases substantially.
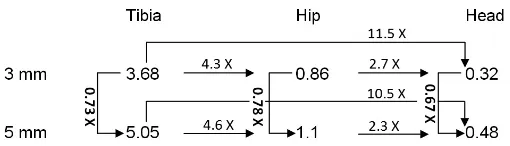
Comparing the maximal acceleration integrals among all condi-tions (regions, amplitudes and frequencies), the lower legs had about 4.5 times higher magnitudes compared with the hip and 11 times higher values than the head. The hip had about 2.5 times higher ac-celeration magnitudes compared with the head (Fig. 5). This demon-strates the attenuation capabilities of the human body from the feet to the head. It is interesting to note that the attenuation from the lower leg to the hip and head is very similar for both vibration inten-sities (Fig. 5). For the lowest frequency (3 Hz) the vertical acceleration magnitudes were about the same for all three measured body regions. Considering acceleration transmissibility, the frequency range from 3 to 7 Hz represents the safest frequency range with magnitudes of less than 1 g.
There is a good match between subjective perceptions (Borg scale) and measured acceleration integrals for the lower limbs and the head. This shows that the subjective perceptions of higher vibration inten-sities can be related to the regions with higher acceleration peaks.
for the frequencies between 21 and 25 Hz. For the head (13–25 Hz) was ‘fairly light’, and ‘somewhat hard’ for the trunk (11–25 Hz). In general, the subjective magnitude estimation of vibration, using the Borg scale, followed a similar trend as the acceleration integral values determined at the lower leg, hip and head. This shows that people are able to estimate the magnitude of vibrations in various parts of their body and it suggests that machine settings should be chosen based on the subject’s sensations (Borg scale). However, we also found that body regions where subjects feel high vibrations do not necessarily correspond with body sites where most pain or discomfort is felt. Fur-thermore, a subjective discomfort or pain perception can be related to hazardous side effects. At 5 mm amplitude, 61.5% of the subjects felt discomfort in the foot region (21–25 Hz), 46.2% in the lower back region (17, 19 and 21 Hz) and 23% in the abdominal region (9–13 Hz). The subject’s perception based on the Borg scale could be an im-portant tool for choosing possible training regimens. If the subject feels discomfort or pain, this could be a sign that the chosen settings (frequency+amplitude+vibration mode) are not appropriate for
this individual. We suggest that the WBV frequency and amplitude settings should be based on an individual’s perceptions.
It was found that the human body is capable of substantially atten-uating vibration magnitudes from the lower legs to the hip and head. The lower legs had about 4.5 times higher magnitudes compared to the hip and 11 times higher values than the head. For the platform ar-rangement and settings used in this study, frequencies from 3 to 7 Hz represented the safest frequency range with acceleration integrals of less than 1 g∗sec for all studied body regions.
Conflicts of interest
None declared.
Ethical approval
All procedures were approved by the Ethics Committee of the Uni-versity of Duisburg-Essen (protocol number 13-5652-BO) and were in accordance with Declaration of Helsinki.
Acknowledgments
CAPES (Comissão de Aperfeiçoamento de Pessoal de Nível Superior)—Government of Brazil. Science without Borders Scholar-ship. Nina Redder for the technical support.
References
[1] Abercromby AFJ, Amonette WE, Layne CS, McFarlin BK, Hinman MR, Paloski WH. Vibration exposure and biodynamic responses during whole-body vibration train-ing. Med Sci Sports Exerc 2007;39:1794–800.
[2] Alizadeh-Meghrazi M, Masani K, Popovic MR, Craven BC. Whole-Body vibration during passive standing in individuals with spinal cord injury: effects of plate choice, frequency, amplitude, and subject’s posture on vibration propagation. PMR 2012;4:963–75.
[3] Bathke A. The ANOVA F test can still be used in some balanced designs with unequal variances and nonnormal data. J Stat Plan Inference 2004;126:413–22. [4] Bautmans I, Van Hees E, Lemper J-C, Mets T. The feasibility of Whole Body
[5] Bogaerts A, Delecluse C, Claessens AL, Coudyzer W, Boonen S, Verschueren SMP. Impact of whole-body vibration training versus fitness training on muscle strength and muscle mass in older men: a 1-year randomized controlled trial. J Gerontol A Biol Sci Med Sci 2007;62:630–5.
[6] Boos DD, Brownie C. ANOVA and rank tests when the number of treatments is large. Stat Probab Lett 1995;23:183–91.
[7] Borg G. Perceived exertion as an indicator of somatic stress. Scand J Rehabil Med 1970;2:92–8.
[8] Borg G. Anstrengungsempfinden und körperliche Aktivität. Dtsch Ärztbl 2004;101:840–5.
[9] Brauer RL. Safety and health for engineersz. 2nd ed. Hoboken, NJ: Wiley-Interscience; 2006.
[10]Castillo AB, Alam I, Tanaka SM, Levenda J, Li J, Warden SJ, et al. Low-amplitude, broad-frequency vibration effects on cortical bone formation in mice. Bone 2006;39:1087–96.
[11]Dickin DC, McClain MA, Hubble RP, Doan JB, Sessford D. Changes in postural sway frequency and complexity in altered sensory environments following whole body vibrations. Hum Mov Sci 2012;31:1238–46.
[12]Ebersbach G, Edler D, Kaufhold O, Wissel J. Whole body vibration versus con-ventional physiotherapy to improve balance and gait in Parkinson’s disease. Arch Phys Med Rehabil 2008;89:399–403.
[13]Floyd WN, Broderson AB, Goodno JF. Effect of whole-body vibration on peripheral nerve conduction time in the rhesus monkey. Aerosp Med 1973;44:281–5. [14]Haas CT, Turbanski S, Schmidtbleicher D. Vibrationstraining in der Rehabilitation
von Gang- und Gleichgewichtsstörungen. Focus Neurogeriatrie 2007;1:18–19. [15]INTERNATIONAL ORGANIZATION FOR STANDARDIZATION. Geneva 1997 ISO
2631- 1:1:1997. Mechanical Vibration and Shock—Evaluation of Human Expo-sure to Whole-Body vibration, Part 1, General Requirements.
[16] Kiiski J, Heinonen A, Kannus P. Transmission of vertical whole body vibration to the human body. 2008;23:1318–25.
[17] Kleinöder H, Mester J. Sicherheit und Leistungsoptimierung im Vibrationstraining. In: BISp-Jahrbuch 2003. Bundesinstitut für Sportwissenschaft, Bonn; 2013. pp. 253–258.
[18]Mester J, Kleinöder H, Yue Z. Vibration training: benefits and risks. J Biomech 2006;39:1056–65.
[19]Miwa T. Evaluation methods for vibration effect: Part 3. Measurements of thresh-old and equal sensation contours on hand for vertical and horizontal sinusoidal vibrations. Ind Health 1967;6:213–20.
[20]Parsons KC, Griffin MJ. Whole-body vibration perception thresholds. J Sound Vi-bration 1988;121:237–58.
[21]Rasmussen G. Human body vibration exposure and its measurement. J Acoust Soc Am 1983;73:22–9.
[22]Roelants M, Delecluse C, Verschueren SM. Whole-body-vibration training in-creases knee-extension strength and speed of movement in older women. J Am Geriatr Soc 2004;52:901–8.
[23]Rubin C, Pope M, Fritton JC, Magnusson M, Hansson T, McLeod K. Transmissibility of 15-hertz to 35-hertz vibrations to the human hip and lumbar spine: determin-ing the physiologic feasibility of deliverdetermin-ing low-level anabolic mechanical stimuli to skeletal regions at greatest risk of fracture because of osteoporosis. Spine (Phila. Pa. 1976) 2003;28:2621–7.
[24]Rubinacci A, Marenzana M, Cavani F, Colasante F, Villa I, Willnecker J, et al. Ovariectomy sensitizes rat cortical bone to whole-body vibration. Calcif Tissue Int 2008;82:316–26.
[25]Silva H, Lourenco A, Tomas R, Lee V, Going S. Accelerometry-based study of body vibration dampening during whole-body vibration training. IEEE Int Symp Med Meas Appl 2011:98–102.
[26]Sonza A, Maurer C, Achaval M, Zaro MA, Nigg BM. Human cutaneous sensors on the sole of the foot: altered sensitivity and recovery time after whole body vibration. Neurosci Lett 2013;533:81–5.
[27]Sonza A, Robinson CC, Achaval M, Zaro MA. Whole body vibration at different exposure frequencies: infrared thermography and physiological effects. Sci World J 2015 12/2014.
[28]Thuong O, Griffin MJ. The vibration discomfort of standing persons: 0.5–16-Hz fore-and-aft, lateral, and vertical vibration. J Sound Vib 2011;330:816–26. [29]Wasserman DE. An overview of occupational whole-body and hand-arm vibration.
Appl Occup Environ Hyg 1996;11:266–70.