Lampiran 1
TABEL
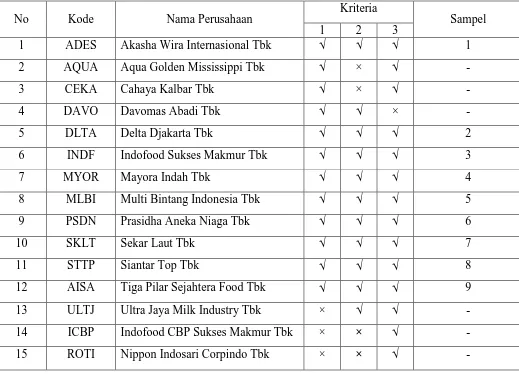
DAFTAR POPULASI DAN SAMPEL PENELITIAN
Lampiran 2
No Kode Nama Perusahaan
1 ADES Akasha Wira Internasional Tbk
2 DLTA Delta Djakarta Tbk
3 INDF Indofood Sukses Makmur Tbk
4 MYOR Mayora Indah Tbk
5 MLBI Multi Bintang Indonesia Tbk
6 PSDN Prasidha Aneka Niaga Tbk
7 SKLT Sekar Laut Tbk
8 STTP Siantar Top Tbk
Lampiran 3
Data Varaibel Penelitian
33 PSDN 2013 0,01 1,91 0,72 6,52 18
34 SKLT 2013 0,01 1,60 0,96 5,52 12
35 STTP 2013 0,05 1,02 2,37 7,13 57
36 AISA 2013 0,09 0,71 1,55 8,26 87
37 ADES 2014 0,11 1,14 4,46 6,08 94
38 DLTA 2014 0,13 2,30 8,99 6,76 16.515
39 INDF 2014 0,05 0,73 1,51 11,26 285
40 MYOR 2014 0,08 1,23 5,90 9,18 1.165
41 MLBI 2014 0,32 1,99 25,60 7,48 22.304
42 PSDN 2014 0,01 1,87 0,52 6,52 5
43 SKLT 2014 0,01 1,87 0,89 5,71 17
44 STTP 2014 0,06 1,15 2,93 7,29 87
45 AISA 2014 0,08 0,80 1,78 8,52 106
Lampiran 4
Hasil Uji Statistik Deskriptif
Descriptive Statistics
N Range Minimum Maximum Mean Std. Deviation Variance
Net Profit Margin 45 ,31 ,01 ,32 ,0991 ,08213 ,007
Total Asset Turnover 45 2,81 ,14 2,95 1,1793 ,61100 ,373
Price to Book Value 45 46,75 ,52 47,27 5,4867 9,12012 83,177
Ukuran Perusahaan 45 6,08 5,18 11,26 7,2711 1,65118 2,726
Return Saham 45 24076 5,00 24081,00 3942,3111 7531,90890 56729651,719
Valid N (listwise) 45
Lampiran 5
Hasil Uji Normalitas Histogram
Histogram Uji Normalitas
Uji Normalitas: Grafik Normal PP Plot
One-Sample Kolmogorov-Smirnov Test
Unstandardized
Residual
N 45
Normal Parametersa,b Mean ,0000000 Std. Deviation 2924,34303271
Most Extreme Differences
Absolute ,087
Positive ,065
Negative -,087
Kolmogorov-Smirnov Z ,585
Asymp. Sig. (2-tailed) ,883
a. Test distribution is Normal.
Lampiran 6
Hasil Uji Multikolinearitas
Model Collinearity Statistics
Tolerance VIF
(Constant)
Net Profit Margin ,510 1,960
Total Asset Turnover ,890 1,124
Price to Book Value ,510 1,961
Ukuran Perusahaan ,941 1,062
Lampiran 7
Hasil Uji Heterokedastisitas
Lampiran 8
Hasil Uji Autokorelasi
Model Summaryb
Model R R Square Adjusted R
Square
Std. Error of the
Estimate
Durbin-Watson
1 ,922a ,849 ,834 3067,07685 2,328 a. Predictors: (Constant), SIZE, NPM, TAT, PBV
b. Dependent Variable: Return
Lampiran 9
Hasil Uji Hipotesis Hasil Uji t
Coefficientsa
Model Unstandardized
Coefficients
a. Dependent Variable: Return_Saham
Sumber: Diolah dengan SPSS, 2015.
Hasil Uji F
ANOVAa
Model Sum of Squares Df Mean Square F Sig.
1
Regression 76100727,591 4 19025181,898 8,517 ,000b
Residual 89347096,734 40 2233677,418
Total 165447824,325 44
a. Dependent Variable: Return_Saham
b. Predictors: (Constant), Size, NPM, TAT, PTB
Lampiran 10
Hasil Uji Koefisien Determinasi
Model Summaryb
Model R R Square Adjusted R
Square
Std. Error of the
Estimate
1 ,678a ,460 ,406 1494,54924
a. Predictors: (Constant), Size, NPM, TAT, PTB