Akreditasi No. 80/DIKTI/Kep/2012
360
STRUCTURAL TRANSFORMATION OF ECONOMY
IN SPECIAL REGION OF YOGYAKARTA
Nur Feriyanto [email protected]
Faculty of Economics, Islamic University of Indonesia
ABSTRAK
Tujuan penelitian ini yang pertama adalah mengetahui hubungan antara laju pertumbuhan PDRB dengan laju pertumbuhan penyerapan tenaga kerja sektoral Provinsi DIY. Kedua, dengan menggunakan analisis Shift share Esteban Marquillas membuktikan apakah telah terjadi transformasi struktural ekonomi di Provinsi DIY selama tahun 2009-2014. Ketiga, mengetahui dampak pertumbuhan ekonomi sektoral Indonesia terhadap pertumbuhan agregat PDRB Provinsi DIY. Hasil penelitian ini adalah: (1) Terdapat ada tiga kondisi melihat hubungan antara laju pertumbuhan PDRB dengan laju pertumbuhan penyerapan tenaga kerja sektoral Provinsi DIY yaitu anomali, regresif dan progresif. (2) Menggunakan analisis Shift share Esteban Marquillas menemukan bahwa di wilayah DIY telah terjadi pergeseran struktur ekonomi dari Sektor Primer ke Sektor Sekunder dan Tersier. (3) Dampak pertumbuhan ekonomi sektoral Indonesia mampu mengakibatkan pertumbuhan agregat PDRB DIY sebesar Rp 539,53 miliar. Saran yang ditawarkan dari penelitian ini antara lain: (1) pengambilan kebijakan oleh pemerintah terkait pembangunan harus memperhatikan hubungan antara pertumbuhan ekonomi dan tingkat pengangguran. (2) pemerintah harus memperhatikan transformasi ekonomi dari sektor Primer hingga Tersier, terutama untuk perencanaan pembangunan; dan (3) pemerintah harus memfokuskan pembangunan ekonomi pada sektor-sektor perekonomian yang dominan di provinsi DIY.
Kata kunci: laju pertumbuhan PDRB, penyerapan tenaga kerja, transformasi struktural ekonomi,
ABSTRACT
The first aim of this study was to determine the relationship between the growth rate of GRDP and the growth rate of sectors’ labor absorption in Special Region of Yogyakarta. The second objective was using the Esteban Marquillas’ Shift-Share analysis to prove whether there has been a structural transformation of the economy in Special Region of Yogyakarta during 2009-2014. The third aim was to determine the impact of economic sectors’ growth in Indonesia on the growth of aggregate GRDP in Special Region of Yogyakarta. Results of this study were: (1) There were three conditions used to observe the relationship between the growth rate of GRDP and the growth rate of labor absorption in Special Region of Yogyakarta namely anomalous, regressive, and progressive. (2) The use of Esteban Marquillas’ Shift-Share analysis showed that in the area of Special Region of Yogyakarta there had been a shift in the economic structure from the primary sector to the secondary and tertiary sectors. (3) The economic sectors’ growth in Indonesia could lead to the growth of aggregate GRDP in Special Region of Yogyakarta as much as 539.53 billion IDR. Suggestions offered by this research are as follows: (1) policy making by the government related to development has to pay attention to the relationship between economic growth and unemployment rate. (2) Government has to address the economic transformation from primary to tertiary sectors, especially for development planning; and (3) government needs to focus on economic development for the dominant sectors of economy in DIY province.
Key words: growth rate of GRDP, labor absorption, structural transformation of economy.
INTRODUCTION
A structural transformation of economy for countries that are growing and
sectors (Xirinachs et al. 2014). This also occurs in provinces as part of a country’s regions. World economists agree that the shift of economy simultaneously occurs as the dominance of agriculture sector has been switched to industry sector (Ungor, 2010). Indonesia has also experienced a structural change in economy from the dominance of Agriculture sector in the GDP of Indonesia into the dominance of Industry sector.
Based on the data from the Central Statistics Agency (BPS), in the Gross Regio-nal Domestic Product (GRDP) of Special Region of Yogyakarta (here in after referred to as DIY Province or DIY), the role of
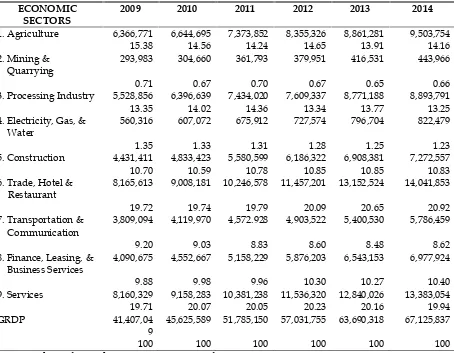
agriculture sector from 2009 to 2014 fluctua-ted yet tended to decline. In 2009, the contribution of Agriculture Sector fell from 15.38 percent to only 14.65 percent in 2012 and continued to decline to 14.16 percent in 2014. Meanwhile, the sector of Trade, Hotel and Restaurant became even more domi-nant in contributing to the GRDP of DIY Province. The Trade, Hotel and Restaurant sector accounted for 19.72 percent in 2009, turned into 20.09 percent, and rose again to 20.92 percent in 2014. Table 1 below illus-trates the detail of the Value and Contri-bution of economic sectors to the Gross Regional Domestic Product (GRDP) of DIY Province from 2009 to 2014.
Table 1
Value and Contribution of Economic Sectors in GRDP at Current Prices of DIY Province Year 2009-2014
ECONOMIC SECTORS
2009 2010 2011 2012 2013 2014
1. Agriculture 6,366,771 6,644,695 7,373,852 8,355,326 8,861,281 9,503,754
15.38 14.56 14.24 14.65 13.91 14.16
2. Mining & Quarrying
293,983 304,660 361,793 379,951 416,531 443,966
0.71 0.67 0.70 0.67 0.65 0.66
3. Processing Industry 5,528,856 6,396,639 7,434,020 7,609,337 8,771,188 8,893,791
13.35 14.02 14.36 13.34 13.77 13.25
4. Electricity, Gas, & Water
560,316 607,072 675,912 727,574 796,704 822,479
1.35 1.33 1.31 1.28 1.25 1.23
5. Construction 4,431,411 4,833,423 5,580,599 6,186,322 6,908,381 7,272,557
10.70 10.59 10.78 10.85 10.85 10.83
6. Trade, Hotel & Restaurant
8,165,613 9,008,181 10,246,578 11,457,201 13,152,524 14,041,853
19.72 19.74 19.79 20.09 20.65 20.92
7. Transportation & Communication
3,809,094 4,119,970 4,572.928 4,903,522 5,400,530 5,786,459
9.20 9.03 8.83 8.60 8.48 8.62
8. Finance, Leasing, & Business Services
4,090,675 4,552,667 5,158,229 5,876,203 6,543,153 6,977,924
9.88 9.98 9.96 10.30 10.27 10.40
9. Services 8,160,329 9,158,283 10,381,238 11,536,320 12,840,026 13,383,054
19.71 20.07 20.05 20.23 20.16 19.94
GRDP 41,407,04
9
45,625,589 51,785,150 57,031,755 63,690,318 67,125,837
100 100 100 100 100 100
The sequence of economic sectors based on their contributions to the GRDP of DIY during 2009-2014 is trade, hotel and restau-rant sector; services sector; agriculture sec-tor; processing industry secsec-tor; construction sector; finance, leasing and business services sector; electricity, gas and water sector, as well as mining and quarrying sector respec-tively. Meanwhile, fundamental structural changes in a region may affect the changes in the economy and income inequality in the region (Dastidar, 2012). In general, a change in a particular field will bring impact to a change in the others, and in this current context, the most fundamental change is in the economic sectors, which can have an impact on the social sector, labor, and other sectors. The structural transformation of economy that has occurred in DIY Province, characterized by the dominance of trade, hotel and restaurant sector, needs to receive more attention because an increase in the value of GRDP in trade, hotel and restau-rant sector should also be accompanied by an increase in the labor absorption of the corresponding sectors. Based on the afore-mentioned background, this study was aim-ed to analyze how the structural transfor-company's organization similar to the spine of human body (Hong et al., 2012). Without labor, a company will not be able to run properly, but labor cannot be separated from wages and incomes (Xhafa, 2014). Similarly, in a regional economy, the role of labor is vital in mobilizing every sector of the region’s economy. In other words, each economic sector requires labor in order to produce output in the form of income for each sector of the economy. The on-going industrialization process today should be able to absorb more labor. The following is a detailed description of the labor absorp-tion according to the economic sectors in
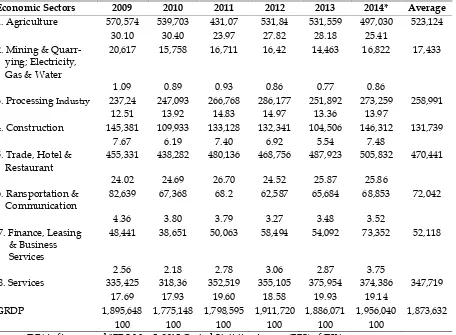
GRDP of DIY Province. Judging from the ability of economic sectors to absorb labor (employment), Table 2 shows that during 2009-2014 Agriculture, Forestry, and Fishe-ries as well as Plantation became the largest sectors in absorbing labor with percentages between 23.97 per- cent and 30.40 percent. Despite a declining trend in every year, the agriculture sector remained dominant compared to the other sectors. In fact, this sector was not the largest sector that contributed to GRDP of DIY Province because it only ranked third; the largest contributing sector in GRDP of DIY Province was Trade, Hotel and Restaurant sector.
Table 2
Number of Labor (People) and the Distribution
Per Economic Sector (%) in GRDP of DIY Province during 2009-2014
Economic Sectors 2009 2010 2011 2012 2013 2014* Average
1. Agriculture 570,574 539,703 431,07 531,84 531,559 497,030 523,124
30.10 30.40 23.97 27.82 28.18 25.41
2. Mining & Quarr-ying; Electricity, Gas & Water
20,617 15,758 16,711 16,42 14,463 16,822 17,433
1.09 0.89 0.93 0.86 0.77 0.86
3. ProcessingIndustry 237,24 247,093 266,768 286,177 251,892 273,259 258,991
12.51 13.92 14.83 14.97 13.36 13.97
4. Construction 145,381 109,933 133,128 132,341 104,506 146,312 131,739
7.67 6.19 7.40 6.92 5.54 7.48
5. Trade, Hotel & Restaurant
455,331 438,282 480,136 468,756 487,923 505,832 470,441
24.02 24.69 26.70 24.52 25.87 25.86
6. Ransportation & Communication
82,639 67,368 68.2 62,587 65,684 68,853 72,042
4.36 3.80 3.79 3.27 3.48 3.52
7. Finance, Leasing & Business Services
48,441 38,651 50,063 58,494 54,092 73,352 52,118
2.56 2.18 2.78 3.06 2.87 3.75
8. Services 335,425 318,36 352,519 355,105 375,954 374,386 347,719
17.69 17.93 19.60 18.58 19.93 19.14
GRDP 1,895,648 1,775,148 1,798,595 1,911,720 1,886,071 1,956,040 1,873,632
100 100 100 100 100 100
Source: DIY in figures, and *BRS May 5, 2015 Central Statistics Agency (BPS) of DIY
GDP GROWTH RATE AND LABOR ABSORPTION
GDP is the total of added value generated by the whole population in a country. Its growth rate can be a reference in measuring the country's economy since GDP measures the total goods and services produced by the economy (Chioma, 2009). While Umair and Ullah (2013) found there is no significant correlation between GDP and unemployment rate in Pakistan. As explain-ed earlier, theoretically, the increasing rate of economic growth in an economic sector of a country will also increase the labor absorption in the corresponding sector.
Such condition is explained as follows, if the growth rate of economy in a country is higher, then it indicates that the GDP value in the country experience an increased
growth compared to the previous year. This increase of GDP is only possible if the economic activities in the country also experienced an improvement. The increase of economic activities also opens more opportunities for business activities to further increase their output by adding the absorption of workers to support the increase of planned output. The increase of the produced output will be absorbed by the market since the economic growth has also been increased, this also indicates that consumption activities by the population has also been increased, considering that the largest percentage of GDP in several developing countries are through the private consumption.
GDP in Romania, it was discovered by Armeanuet al. (2015), more detail according to the entrepreneurial sector needs to innovate in order to face the economic challenges in the country.
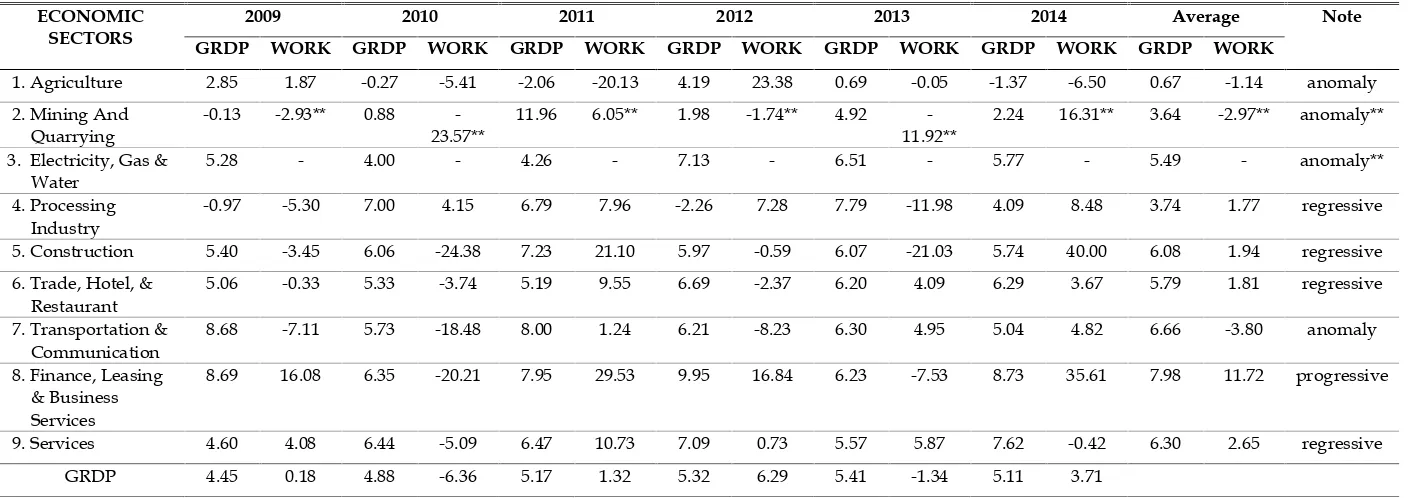
However, in the case of DIY Province's economy, an interesting phenomenon occurred in the relationship between the economic growth (GRDP growth rate) and the rate of labor absorption (employment) in the economic sectors of DIY from 2009 to 2014. As shown in Table 3 below, the growth of the economic sectors’ contri-bution to GRDP of DIY Province is not always followed by an increase in the rate of labor absorption.
There were three conditions that occurred in DIY Province in relation to the causal relationship between the growth rate of GRDP (economy) and the growth rate of employment, which are: a) Anomaly, when the growth rate of GRDP (economy) resul-ted in a negative growth rate of employ-ment.
This condition occurred in the Agri-culture sector, Mining and Quarrying sec-tor, Electricity, Gas and Water secsec-tor, and Transportation and Communication sector; b) Regressive, when the growth rate of GRDP (economy) led to a lower rate of employment growth. This occurred in the Processing Industry sector, Construction sector, Trade, Hotel and Restaurant sector, and Services sector; c) Progressive, when the growth rate of GRDP (economy) caused a higher growth rate of employment. It occur-red in the Finance, Leasing, and Business Services sector.
THEORETICAL REVIEW
Mecik and Afsar, in one of his studies, found a significant relationship between the structural transformation of economy that occurred in the member countries of OECD (Organization for Economic Cooperation and Development) and the labor market in those countries. His findings indicated that the working labor’s productivity has a nega-tive influence on labor absorption, but it
positively affects the long-term unemploy-ment rate (Mecik and Afsar, 2014).
This indicates that a shift has happened from a less productive employment to a more productive employment. Only work-ers with a significant added value in GDP which will be hired by the employment market. A natural selection has happened as the modern economics become more developed, where the economic activities prefer employees with bigger contribution to the economy. The economy has become more selective in hiring employees and there has been an increased competition in the employment market. A less productive employee will be eliminated in the ever more competitive market and therefore will increase the unemployment rate.
It was similar to what happened in China. The structural transformation of economy in China was inevitable. Migration from rural to urban areas was increasing; in addition, the shift of economic sectors from agriculture to non-agriculture also occurred massively. This condition has become an attraction factor for workers from the more rural areas to migrate to the cities and attempt to change their fate and improve their living conditions. Developing indus-tries in the cities in China with the existing technology is capable of absorbing the potential migrating workers through trai-nings which are intended to improve their skills, so they can compete in the industrial sectors in the urban areas
The difference was that the structural transformation of economy in China was still able to absorb labor as described by Liwenet al. in his paper that the urban areas in China remained able to accommodate the migration of labor from rural to urban areas (Liwenet al., 2011).
explained that for the areas which are classified as ‘strong’, are recommended to strengthen their scientific positions and rational exploitation so that the character-istics of the areas are more visible. For the areas in the ‘medium’ category still need to conduct a preparation to perfect the transformation. Meanwhile, for the areas in the ‘weak’ category, are recommended to change their activities from passive transfor-mation to active transfortransfor-mation.
In Vietnam, too, the structural transfor-mation of economy occurred in the import-export, investment, production and con-sumption sectors. Trinh in his research revealed that the contribution of TFP (Total Factor Productivity) to GDP of Vietnam during 2006-2010 decreased by 10 percent compared with the previous 2000-2005 period (Trinhet al., 2012).
This caused by the struggle faced by the small and medium enterprises in dealing with the high rate of the central bank. Other obstacles faced by small and medium enterprises are including access to capitals, distribution of transportation, administra-tive procedure, and other extra expenses. Furthermore, the rate of tax in the country is still the highest in the world, which is about 25-27%, not to mention other expenses as well as ‘hidden’ inflation tax.
These factors are causing the business world in Vietnam to experience structural transformation, which put the country under pressure. As the implication, Bui Trinh gave several recommendation for policies in his research, such as control by banking regarding the policy of funding distribution especially for those with high interest rates. Government also should give a special attention to sectors such as real estate and other business. Aside from that, loval government and the authority should begin to simplify the administrative of business process, and cut all the ‘hidden’ cost.
Several other studies have also found the structural transformation of the countri-es they studied, among which are Zidek
(2014) in Hungary, Armah et al. (2014) in several countries in Africa, Diene (2014) in Senegal, Kedir (2014) in Ethiopia, Matotay (2014) in Tanzania and Reddy & Rampersad (2012) in South Africa.
Indeed, most countries in Eastern and Southern Asia experienced rapid economic growth and structural transformation, but these were not balanced by an increase in the productivity of the corresponding sec-tors (Freire, 2013). Countries in the region of South Asia in the past decade is having a rapid economic growth. From 2000-2010 in average the growth of economy in South Asia is as high as 7.08% and higher than the average of the world’s economic growth. However, the growth is not balanced by the structural transformation and advancement of production capacity. South Asia is populated with 24% world’s population, yet it only produces 3% of world’s GDP.
Regarding to this, Freire (2013) recom-mends that structural transformation of the economy and the improvement of produc-tion capacity in South Asia is soon to be created by doing product diversifications and technological innovation. Goverments in all the South Asia countries have to give assistance in succeeding the product diver-sification as well as the innovation in technology. Other recommendation is to conduct a substitution in export and import to create incentive to improve production capacity. Hence, the structural transfor-mation of economy as well as improvement of production capacity in South Asia can be created, with support by other policies with wider scope.
said structural transformation of economy. Industrial sectors (especially manufacturing and banking) are not easy sectors for work-ers to move from the agriculturals. It is important for the workers to have special education and skill to enter such industrial sectors. For workers who are unable to join the industrial sectors, usually hired in the informal sectors of economic activities which rely more on entrepreneurship and capabilities of the worker.
Gries (2010) added that to change the economic structure from traditional to modern through entrepreneurship sector is able to conduct in a several ways such as: (1) creating new job opportunities outside corporations; (2) absorbing workers from traditional sectors; (3) providing innovation and intermediation between production factors as well as output of the result from company production; (4) encouraging spe-cific specialization in each company; and (5) improving productivity and welfare of the workers in the traditional as well as modern sectors.
Meanwhile, the countries in Africa experienced economic stagnation in the first five decades, but it changed after entering the new millennium. The failure at industri-alization strategy, economic deceleration in the agriculture sector, and rapid growth of population has drawn the attention of many countries to conduct a structural transfor-mation of economy immediately. Badiane et al. (2012) consider that the focus of African countries currently is to conduct a continu-ing acceleration in the basic level of improvement process, creating policies regarding the improvement of the agri-cultural sector’s productivity, and a total revitalization in the modern industrial sector.
In order to create a successful structural transformation of economy, two strategic approaches are needed. First, by improving a continuing productivity in the sector of agriculture as well as rural economy, and second, by doing a product diversification with an added value on the service sector
and urban industry. Both of these strategic approaches need to be supported with adequate physical resources and human resources, qualified information technology and institution, and accomodative coordi-nation and government’s policy.
The approach was through a structural transformation of economy in the traditional agriculture sector in order to release the snare of economic stagnation and poverty (Kim and Ncube, 2014). Their research is inspired by the condition of African coun-tries who mostly experienced economic stagnation and high rate of poverty. Econo-mic stagnation in the African continent is caused by the communal ownership or land in rural areas, which makes a private ownership by farmers is very limited. While in fact the communal ownerships control the majority of agricultures, this caused a vicious cycle with a number of concerns such as lack of investments, low producti-vity of land, income inequality among far-mers, low quality of workers, and scarcity of domestic savings to support industrial development.
Therefore, the government need to do a policy reform in accordance with the recommendation by Kim and Ncube (2014) which are as follows: (1) pursuing a large scale of commercial agriculture improve-ment policy package, (2) opening inter-national economy and trade, and (3) im-proving agricultural sector development with a basis of wide-range areas.
One of the countries in Africa, such as Nigeria also experienced the same thing, where the process of structural transfor-mation of the economy is running very slow. In the research, Naiya and Manap (2013) stated that despite being the country of research, Nigeria, the structural transfor-mation is considered very minimum, yet there is a long-term significant relationship between structural transformation of econo-my with poverty and income inequality.
rise of oil commodity which is turned into a leading sector and hence, ignoring the other real sectors. The failure of the government to manage the outcome of the oil commo-dity in supporting the process of structural transformation resulting in Nigeria to become a country with a number of ‘para-doxes’ one of which is ‘a rich country with poor people’.
Another process of structural transfor-mation in other European countries, such as Hungary, as explained in the research by Zidek (2014) that the main goal of transfor-mation is to change the paradigm of econo-my with the basis of centralistic toward the submission to the market. The process of transformation during the 1989-2004 period is considered succeeding in achieving its goal, this can be seen from the whole econo-mic structure that has changed. Aside from that, the GDP per capita has also doubled in that period. The most obvious is that Hungary has finally been accepted as a member of European Union in its final years of the successful process of the economic transformation.
However, it does not mean that there are no occuring problems, Zidek (2014) mentioned that Hungary also face a pro-blem of economic recession which recently has destroyed the economy in Greece. Another problem is the debt of foreign currency which is increasing due to the currency depreciation in the country.
The problem caused by structural transformation has also been experienced by Russia. Anisimov (2014) in their research has stated that the process of structural transformation in the country has caused a few negative effects, such as shadow econo-my, corruption, and difficulties in bureau-cracy. A few scholars considered this as a deviant phenomenon, because most coun-tries with economic transformation has been successful yet it did not happen in Russia.
The structural transformation of econo-my in the aforementioned countries should potentially increase the demand for labor. Meanwhile, the aggregate demand for labor
is an important measure for economic acti-vities. Therefore, it seemed that there was a discrepancy between structural transfor-mation of economy and the economic growth of this country (Sassi, 2011).
Up to this moment, the unemployment rate is still used to measure the rate of labor absorption; in addition, it is also used as a benchmark for wasted human resources, performance of labor market, and even for the success and failure of economic policy (Sylla, 2013).
The number of unemployment is calcu-lated by the number of jobless individuals and are not currently looking for a job. While, the number of employment is mea-sured by the number of working individuals despite only working for 1 hour per day, and also individuals looking for jobs. According to Sylla (2013), this type of calcu-lation is no longer relevant, the unemploy-ment rate is not an important indicator for the economic performance if the workers only have low qualification.
Sylla added that the most important things in solving the problem of employ-ment are as follows: (i) how to create job fields with employees that are not salary oriented; (ii) increase the productivity of the existing job fields; (iii) and equality of employment absorption for countries with large demographics.
Table 3
GDP Growth Rate at Constant Prices and Employment per Economic Sector (%) in DIY Province Year 2009-2014
ECONOMIC SECTORS
2009 2010 2011 2012 2013 2014 Average Note
GRDP WORK GRDP WORK GRDP WORK GRDP WORK GRDP WORK GRDP WORK GRDP WORK
1. Agriculture 2.85 1.87 -0.27 -5.41 -2.06 -20.13 4.19 23.38 0.69 -0.05 -1.37 -6.50 0.67 -1.14 anomaly
2. Mining And Quarrying
-0.13 -2.93** 0.88 -23.57**
11.96 6.05** 1.98 -1.74** 4.92 -11.92**
2.24 16.31** 3.64 -2.97** anomaly**
3. Electricity, Gas & Water
5.28 - 4.00 - 4.26 - 7.13 - 6.51 - 5.77 - 5.49 - anomaly**
4. Processing Industry
-0.97 -5.30 7.00 4.15 6.79 7.96 -2.26 7.28 7.79 -11.98 4.09 8.48 3.74 1.77 regressive
5. Construction 5.40 -3.45 6.06 -24.38 7.23 21.10 5.97 -0.59 6.07 -21.03 5.74 40.00 6.08 1.94 regressive
6. Trade, Hotel, & Restaurant
5.06 -0.33 5.33 -3.74 5.19 9.55 6.69 -2.37 6.20 4.09 6.29 3.67 5.79 1.81 regressive
7. Transportation & Communication
8.68 -7.11 5.73 -18.48 8.00 1.24 6.21 -8.23 6.30 4.95 5.04 4.82 6.66 -3.80 anomaly
8. Finance, Leasing & Business Services
8.69 16.08 6.35 -20.21 7.95 29.53 9.95 16.84 6.23 -7.53 8.73 35.61 7.98 11.72 progressive
9. Services 4.60 4.08 6.44 -5.09 6.47 10.73 7.09 0.73 5.57 5.87 7.62 -0.42 6.30 2.65 regressive
GRDP 4.45 0.18 4.88 -6.36 5.17 1.32 5.32 6.29 5.41 -1.34 5.11 3.71
Source: DIY in figures; Central Statistics Agency (BPS) of DIY Note: At Constant Prices 2000
(7) increasing the internal resistance, and (8) disaster mitigation.
In relation to GDP, Holm (2014) has conducted research in Denmark, where the result stated that the structural transfor-mation of a significant effect on the productivity of GDP, structural transfor-mation occurred towards labor intensive than capital intensive. Likewise, as hap-pened in Assam, India, Baruahet al. (2014) it is discovered that a structural transfor-mation of the economy there occurred in the fisheries sector.
RESEARCH METHODOLOGY
The data in this study were secondary data consisting of the value and contri-bution of various economic sectors in Indo-nesia's GDP and GRDP of DIY Province. The data were taken during 2009 to 2014 period published by the Central Statistics Agency (BPS) that were summarized in Statistics of Indonesia Year 2011 and 2015, as well as DIY in Figures Year 2010-2015.
The tools for analysis were the classic shift-share analysis and Esteban Marquil-las’s shift-share analysis as well as LQ analysis. The classic shift-share analysis was used to analyze and determine the shift and role of economy in the region (Ma’mun and Irwansyah, 2013):
Dij = Nij + Mij + Cij Description:
Dij = Eij.t – Eij = Changes in the regional variable of sector i in special region of Yogyakarta
Nij = Eij. Rn = Changes in the GRDP of sector/sub-sector i in special region of Yogyakarta caused by the influen-ce of the refereninfluen-ce region's economic growth (larger region)
Mij = Eij (rin – rn) = Mixed industry of sector i in special region of Yogya-karta/Changes in the GRDP of sector i in special region of Yogya-karta caused by the influence of the reference region's economic growth (larger region)
Cij = Eij (rij – rin)= Competitive advantage of sector i in special region of Yogyakarta
Eij = GRDP of sector i in Yogyakarta spe-cial region in the initial year of analysis
Eij.t = GRDP of sector i in special region of Yogyakarta in the final year of analysis
Rin = (Ein.t – Ein)/Ein = growth rate of sector i in the reference region rij = (Eij.t – Eij)/Eij = growth rate of
sector i in the analyzed special region of Yogyakarta
rn = (En.t – En)/En = growth rate of the reference region
Ein.t = GRDP of sector i in the reference region in the final year of analysis Ein = GRDP of sector i in the reference
region in the early initial of analysis En.t = GRDP of the reference region in the
final year of analysis
En = GRDP of the reference region in the early year of analysis
The shift-share equation for sector i in the analyzed area (j) is:
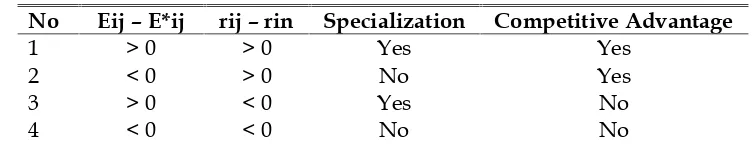
Dij = Eij.rn + Eij (rin – rn) + Eij (rij –rin) To determine the level of economic specialization in an area the Esteban Mar quillas’ Shift-Share (SS-EM) is used. To determine the allocation effect, the follow-ing formula can be used:
Aij = (Eij – E*ij) (rij – rin) Description:
(Eij – E*ij) : level of specialization of sector i in special region of Yogya-karta
(rij – rin) : level of competitive advantage of sector i in special region of Yogyakarta
Dij = Eij (rn) + Eij (rin – rn) + Eij (rij – rin) + (Eij – E*ij) (rij – rin)
The possibilities that will occur due to the allocation effect are illustrated in Table 4 below:
Table 4
Esteban Marquillas’ Shift-Share Analysis
No Eij – E*ij rij – rin Specialization Competitive Advantage
1 > 0 > 0 Yes Yes
2 < 0 > 0 No Yes
3 > 0 < 0 Yes No
4 < 0 < 0 No No
The Location Quotient (LQ) Analysis is a comparison between the scale of the role of a sector in an area and the scale of the role of the sector nationally. In this study, LQ is a method for calculating the relative ratio between the added-value contribution of a sector in DIY Province and the added-value contribution of the corresponding sector in Indonesia. LQ analysis can also be used to find the basic economic activity as the region’s mainstay sector. The formula to calculate LQ is as follows:
LQ = (Xr/GRDP)/(Xn/GDP) Description:
Xr = GRDP of sector i in special region of Yogyakarta
GRDP = Gross Regional Domestic Product of special region of Yogyakarta Xn = Gross Regional Domestic Product
of sector i in Indonesia
GDP = Gross Domestic Product of Indo-nesia
If LQ> 1, it means the sector is a basic sector, so the role of this sector in the region is more prominent than the role of this sector nationally. Whereas if LQ <1, it means the sector is a non-basic sector, so this sector’s role is less than the sector’s role nationally.
ANALYSIS AND DISCUSSION Shift-Share Analysis
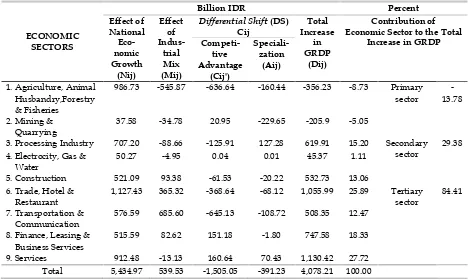
An increase in economic activities indicated by a rise in GRDP of a region can be decomposed into three influencing
factors/components (Sjafrizal, 2008). In detail, the three influencing factors are, first, the increase in GRDP caused by external factors (national/provincial policy) or often referred to as the effects of regional econo-mic growth (Nij). The second influence is the effect of the growth structure of a sector and sub-sector or often called industrial-mix effect (Mij), and the last influence is the effect of competitive advantage in the study area (Cij).
However, recently a fourth effect emer-ges as the effect of regional economic specialization (Aij). The addition of this effect was developed by Esteban Marquillas presented in the model of reinterpreted shift-share analysis written in the Regional and Urban Economist journal entitled A Reinterpretation of Shift-Share Analysis (Este-ban Marquillas, 1972). The Shift-Share Ana-lysis by Esteban Marquillas is then known as the SS-EM.
Table 5
Components of Economic Growth in DIY Province for 2009 dan 2014
ECONOMIC Economic Sector to the Total
Increase in GRDP
986.73 -545.87 -636.64 -160.44 -356.23 -8.73 Primary sector
-13.78
2. Mining & Quarrying
37.58 -34.78 20.95 -229.65 -205.9 -5.05
3. Processing Industry 707.20 -88.66 -125.91 127.28 619.91 15.20 Secondary sector
29.38 4. Electrocity, Gas &
Water
50.27 -4.95 0.04 0.01 45.37 1.11
5. Construction 521.09 93.38 -61.53 -20.22 532.73 13.06 6. Trade, Hotel &
Restaurant
1,127.43 365.32 -368.64 -68.12 1,055.99 25.89 Tertiary sector
84.41
7. Transportation & Communication
576.59 685.60 -645.13 -108.72 508.35 12.47
8. Finance, Leasing & Business Services
515.59 82.62 151.18 -1.80 747.58 18.33
9. Services 912.48 -13.13 160.64 70.43 1,130.42 27.72 Total 5,434.97 539.53 -1,505.05 -391.23 4,078.21 100.00
Source: Central Statistics Agency (BPS), processed
aggregate GRDP of DIY Province by IDR 539,530,000, the effect of competitive advan-tage giving a negative growth of aggregate economy of Yogyakarta special region as much as IDR 1,505,050,000, as well as the influence of economic specialization in DIY Province, which could give a negative growth of IDR 391,230,000.
The position of province as a forming part of the national territory makes the policy made by the central government affect the regional economy (province) as well either directly or indirectly. The deve-lopment of Indonesia's economy as indica-ted by the rate of economic growth will affect the economic development in DIY Province.
The following Table 6 shows the performance of the Indonesian economy that proved to have a major contribution to the economic performance of Yogyakarta special region. In reality, this external growth has resulted in increased GRDP of DIY Province as much as 5434.966 billion
IDR. This condition indicates that the 133.27 percent increase in GRDP of DIY Province was caused by the aggregate economic growth in Indonesia, which was the external factor of DIY Province. By sectors, the influence of the Indonesian economy was evident in several sectors, such as Proces-sing Industry Sector (114.08 percent), Transportation and Communication Sector (113.42 percent), Electricity, Gas and Water Sector (110.82 percent), and Trade, Hotel and Restaurant Sector (106.76 percent).
Table 6
Effect of Indonesia's Economic Growth on the Increase in GRDP of DIY Province In 2009 and 2014
ECONOMIC SECTORS
Billion IDR Percent
Effect of National Economic Growth
Nij
Total Increase in GRDP
Dij
Influence of External Factors
1. Agriculture, Animal Husbandry, Forestry, and Fisheries
986.7261 -356.225435 -276.995
2. Mining and Quarrying 37.58378 -205.895984 -18.2538
3. Processing Industry 707.1974 619.906224 114.0814
4. Electricity, Gas and Water 50.27468 45.3665141 110.8189
5. Construction 521.0934 532.726601 97.81629
6. Trade, Hotel and Restaurant 1,127.426 1,055.9887 106.7649 7. Transportation and
Communication
576.5893 508.346172 113.4245
8. Finance, Leasing and Business Services
515.5921 747.58415 68.96777
9. Services 912.4834 1,130.41736 80.72093
Total 5,434.966 4,078.2143 133.2683
Source: Central Statistics Agency (BPS), processed
Effect of Indonesia’s Industrial Mix on the Economy of DIY
The effect of industrial mix or the structure of economic growth in Indonesia could increase GRDP of DIY. This effect occurred because the Indonesian industry greatly affected the growth of GRDP of DIY. In Table 7, it can be seen that the effect of industrial mix has caused GRDP of DIY Province to increase by Rp 539.53 billion. The rise in GRDP of DIY Province shows that the structure of the national economic growth could boost the economy of DIY Province as much as 13.23 percent. The economic sectors in DIY Province that obtained a positive impact from Indonesia’s industrial mix were Transportation and Communication sector (Rp 685.60 billion), Trade, Hotel and Restaurant sector (Rp 365.32 billion), Construction sector (Rp 93.38 billion) and Finance, Leasing and Business Services sector (Rp 82.62 billion).
Then, the sectors that received a negative effect from the national industrial mix were Agriculture, Animal Husbandry, Forestry and Fisheries sector (Rp 545.87
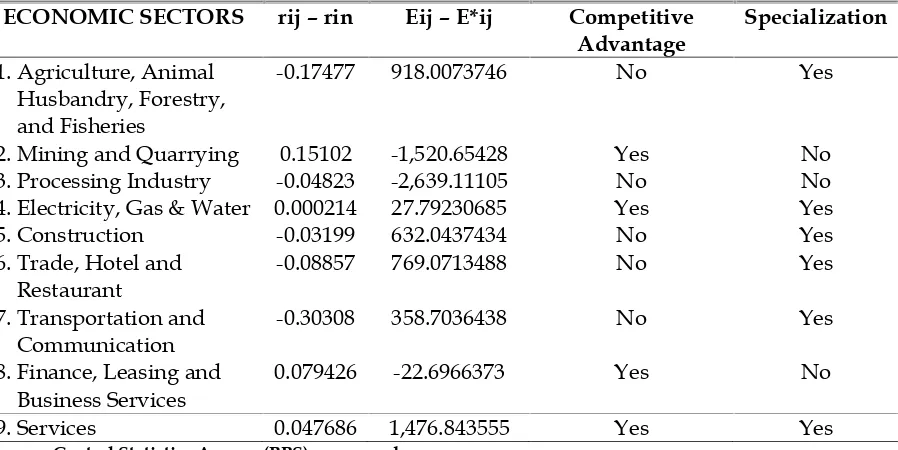
billion), Mining and Quarrying sector (Rp 34.78 billion), Processing Industry sector (Rp 88.66 billion), Electricity, Gas and Water sector (USD, 4.95 billion) and Services sector (Rp 13.13 billion). The advantage of SS-EM is that it is capable of detecting the econo-mic sectors that have a competitive advan-tage and specialization in an area. An economic sector is considered to have a competitive advantage as well as speciali-zation at once when its growth and role are better than the growth and role of the same sector in the national economy.
Then, the sectors that had both a competitive advantage and specialization
were Electricity, Gas, and Water sector as well as Services sector.
Table 7
Impact of the Growth of National Economic Sectors On the Increase in GRDP of DIY in 2009 and 2014
ECONOMIC SECTORS
Billion IDR Percent
Effect of Industrial Mix
(Mij)
Total Increase in GRDP (Dij)
Effect of External Factors
1. Agriculture, Animal Husbandry, Forestry, and Fisheries
-545.87 -356.225435 153.2373
2. Mining and Quarrying -34.7848 -205.895984 16.89434
3. Processing Industry -88.6585 619.906224 -14.3019
4. Electricity, Gas and Water
-4.95386 45.3665141 -10.9196
5. Construction 93.38413 532.726601 17.52947
6. Trade, Hotel and Restaurant
365.3203 1,055.9887 34.5951
7. Transportation and Communication
685.6041 508.346172 134.8695
8. Finance, Leasing and Business Services
82.615 747.58415 11.05093
9. Services -13.1279 1,130.41736 -1.16133
Total 539.5282 4,078.2143 13.22952
Source: Central Statistic Agency (BPS), processed
Table 8
Identification of Competitive Advantage
And Specialization in the Economy of DIY Province in 2009 and 2014
ECONOMIC SECTORS rij – rin Eij – E*ij Competitive
Advantage
Specialization
1. Agriculture, Animal Husbandry, Forestry, and Fisheries
-0.17477 918.0073746 No Yes
2. Mining and Quarrying 0.15102 -1,520.65428 Yes No
3. Processing Industry -0.04823 -2,639.11105 No No
4. Electricity, Gas & Water 0.000214 27.79230685 Yes Yes
5. Construction -0.03199 632.0437434 No Yes
6. Trade, Hotel and Restaurant
-0.08857 769.0713488 No Yes
7. Transportation and Communication
-0.30308 358.7036438 No Yes
8. Finance, Leasing and Business Services
0.079426 -22.6966373 Yes No
9. Services 0.047686 1,476.843555 Yes Yes
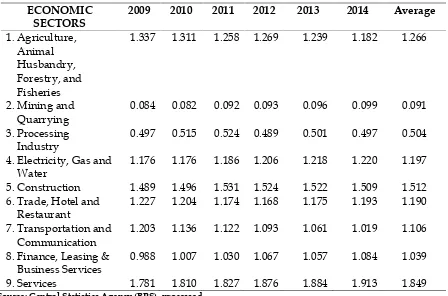
LQ Analysis
A region’s leading sector can give a major contribution not only to the region itself but also to the fulfillment of the needs of other regions. The Location Quotient (LQ) analysis tool can be used to identify the competitive advantage of economic activities in DIY Province by comparing it to the National. If the economy has a number of LQ> 1 then the sector is a sector basis where the sector is more prominent role than the role of the sector nationally. It has a meaning that the sector in the region will be a surplus of certain products and can be exported to other regions and become the leading sectors in an area that has great potential to be developed as a driver of the regional economy.
Meanwhile, if an economic sector has a number of LQ <1 then it means that the role of the sector is smaller than the role of the
sector nationally. It implies that the sector is only able to meet the needs for the region only and does not constitute a dominant sector and less potential to be developed as an economic sector driving the regional economy.
Based on this LQ analysis, with the value of LQ>1 DIY Province had seven economic sectors that owned a competitive advantage, namely: Agriculture, Animal Husbandry, Forestry and Fisheries sector, Electricity, Gas, and Water sector, Construc-tion sector, Trade, Hotel and Restaurant sector, Transportation and Communication sector, Finance, Leasing and Business Services sector, and Services sector.
Then, the sectors that had LQ <1 indicated that these sectors were not the basic sectors in DIY; they were Mining and Quarrying sector (0.091) and Processing Industry (0.504).
Table 9
Value of Location Quotient in DIY Province per Economic Sectors Year 2009-2014 ECONOMIC
SECTORS
2009 2010 2011 2012 2013 2014 Average
1.Agriculture, Animal Husbandry, Forestry, and Fisheries
1.337 1.311 1.258 1.269 1.239 1.182 1.266
2. Mining and Quarrying
0.084 0.082 0.092 0.093 0.096 0.099 0.091
3. Processing Industry
0.497 0.515 0.524 0.489 0.501 0.497 0.504
4. Electricity, Gas and Water
1.176 1.176 1.186 1.206 1.218 1.220 1.197
5. Construction 1.489 1.496 1.531 1.524 1.522 1.509 1.512
6. Trade, Hotel and Restaurant
1.227 1.204 1.174 1.168 1.175 1.193 1.190
7. Transportation and Communication
1.203 1.136 1.122 1.093 1.061 1.019 1.106
8. Finance, Leasing & Business Services
0.988 1.007 1.030 1.067 1.057 1.084 1.039
9. Services 1.781 1.810 1.827 1.876 1.884 1.913 1.849
CONCLUSIONS AND SUGGESTIONS Three conditions that occurred in DIY Province relating to the influential relation-ship between the growth rate of GRDP (economy) and the growth rate of employ-ment were: a) Anomaly, when the growth rate of GRDP (economy) resulted in nega-tive employment growth rate. This conditi-on occurred in the Agriculture sector, Mining and Quarrying sector, Electricity, Gas and Water sector, and Transportation and Communication sector; b) Regressive, when the growth rate of GRDP (economy) led to a small growth of employment rate. This condition occurred in the Processing Industry sector, Construction sector, Trade, Hotel and restaurant sector, and Services sector. c) Progressive, when the growth rate of GRDP (economy) caused a higher growth rate of employment. This condition occur-red in Finance, Leasing, and Business Servi-ces sector.
The shift-share analysis results showed that in DIY Province in the period of 2009-2014 a positive growth occurred with GRDP value as much as Rp 4078.21 billion, in which the contribution of sectors to the shift of total GRDP growth in DIY Province for Primary sector reached -13.78 percent, for Secondary sector as much as 29.38 percent and 84.41 percent for Tertiary sector. This means that in the area of DIY Province there has been a structural transformation of economy from the Primary sector to the Secondary and Tertiary sectors.
Based on the LQ analysis, with LQ> 1, seven leading sectors had the potential to be developed as a driving force of the economy in DIY Province, which would further encourage the development of national economy. They were Agriculture, Animal Husbandry, Forestry and Fisheries sector, Electricity, Gas and Water sector, Construc-tion sector, Trade, Hotel and Restaurant sector, Transportation and Communication sector, Finance, Leasing and Business Servi-ces sector, and ServiServi-ces sector. Then, the sectors that had LQ value <1 indicated that they were not the basic sectors of DIY,
namely Mining and Quarrying sector (0.091) and Processing Industry sector (0.504). The sectors with LQ value <1 mean that these sectors were not basic sectors and less potential to be developed as a driving force for the economy of DIY Province.
Based on the findings of the research, there are three suggestions this paper would like to offer. First, Local governments, in making the development policy in the pro-vince, must pay attention to the relation-ship between economic growth rate and the employment rate, so it can determine the proper field, especially for the absorption of a large workforce. As for progressive employment, it occurred in the Finance, Leasing and Business Services sector. Regressive employment occurred in the Processing Industry sector, Construction sector, Trade, Hotel and Restaurant sector, and Services sector.
Second, the economic transformation that occurred in the province from the Primary sector to the Secondary and Tertia-ry sectors should be noticed by policy makers, especially those relating to develop-ment planning.
The final suggestion of the research is that local governments can be more focused in developing economies of the DIY Pro-vince in several dominant sectors of the economy, namely Agriculture, Animal Husbandry, Forestry and Fisheries sector, Electricity, Gas and Water sector, Construc-tion sector, Trade, Hotel and Restaurant sector, Transportation and Communication sector, Finance, Leasing and Business Servi-ces sector, and ServiServi-ces sectors.
ACKNOWLEDGEMENT
The author would like to express gratitude to Bappeda DIY for supporting the raw data and the funding of this research.
BIBLIOGRAPHY
Anisimov, R. 2014. Result of The Economic Transformation in The Social Cons-ciousness of Russians, Economics and Sociology7(3): 155-169.
Armah, B., M. Keita., A. Gueye., J. Ameso. dan Z. Chinzara. 2014. Structural Transformation for Inclusive Develop-ment in Africa: The role of active government policies. Development 57(3-4): 438-451.
Armeanu, D., N. Istudor, dan L. Lache. 2015. The Role of SMEs in Assessing the Contribution of Enterpreneurship to GDP in the Romanian Business Environ-ment. Amfiteatru Economic 17(38): 195-211.
Badiane, U. dan Badibanga. 2012. Structural Transformation among African Econo-mies: Pattern and Performance. Develop-ment55(4): 463-476.
Baruah, D., U. Talukdar, dan K. C. Talukdar. 2015. Emerging Trends and Structural Transformation of Fishery Sector: The Case of Assam. Economic Affairs60(3): 487-493.
Chioma, N. J. 2009. Causal Relationship between Gross Domestic Product and Personal Consumption Expenditure of Nigeria.African Journal of Mathematics, and Computer Science Research 2(8): 179-183.
Clovis, F. 2013. Strategies for Structural Transformation in South Asian Countri-es,Seoul Journal of Economics26(3): 311. Dastidar, A. G. 2012. Income Distribution
and Structural Transformation: empiri-cal Evidence from Developed and Developing Countries. Seoul Journal of Economics25(1): 25.
Diene, M. 2014. Inequalities in the Context of Structural Transformation: the Case of Senegal.Development57(3-4): 540-546.
Freire, C. 2013. Strategies for Structural Transformation in South Asian Countri-es,Seoul Journal of Economics26(3): 311. Gries, T. dan W. Naude. 2010.
Enterpreneur-ship and Structural Economic Transfor-mation. Small Bussiness Economic 34:13-29.
Holm, J. 2014. The Significance of Structural Transformation to Productivity Growth. Journal of Evolution Economic 24: 1009-1036.
Hong, E., L. Z. Hao., R. Kumar., C. Ramen-dran. dan V. Kadiresan. 2013. An Effectiveness of Human Resource Management Practices on Employee Retention in Institute of Higher Lear-ning: A Regression Analysis. Internati-onal Journal of Business Research and Management3(2): 60.
Kedir, A. M. 2014. Inclusive Growth and Inequalities in the Context of Structural Transformation: Evidence from Ethio-pia.Development (57)3-4:512-520. Kim, H., dan M. Ncube. 2014. Agricultural
Sector Development and Structural Transformation: Sub-Saharan Africa versus East Asia. Seoul Journal of Econo-mics(27)3: 349.
Liwen, X dan Yumei. 2011. Rural Labor Absorption Efficency in Urban Areas Under Different Urbanization Patterns and Industrial Structures: The Case of Chine.IZA Discussion PaperNo. 6189. Ma’mun dan Irwansyah. 2013. Analisis
Pergeseran Struktur Ekonomi dan Identifikasi Sektor Potensial Wilayah Pengembangan (Studi Kasus di Kabu-paten Bekasi, Provinsi Jawa Barat), Jurnal Social Economic of Agriculture2(1): 7-28.
Matotay, E. 2014. Inequalities and Structural Transformation in Tanzania. Develop-ment57(3-4): 591-600.
Naiya dan Manap. 2013. Structural Transformation, Poverty and Inequality in Nigeria: an ARDL Bound Testing Technique.International Journal of Econo-mic and Finance5(4): 141.
Reddy, K. dan R. Rampersad. 2012. Ethical Business Practices: The Consumer Protection Act and Socio-Economic Transformation in South Africa. African Journal of Business Management 6(25): 7403-7413.
Sassi, M. 2011. Convergence Across the EU Regions: Economic Composition an Structural Transformation, International Atlantic Economic Society(17): 101-115. Shijun, W dan L. Jiang. 2010. Economic
Transformation Capacities and Developmental Countermeasures of Coal-resource-based Counties of China, Chinese Geographical Science 20(2) :184-192.
Soeherman, A. D. G., D. Mursinto. dan T. Ratnawati. 2014. The Influential of Private Investment, Public Investment on Economic Growth and Labor Absorption and Public Welfare of District/City in East Java Province. GSTF Journal on Business Review (GBR)(3)4.
Sylla, N. 2013. Measuring Labour Absorp-tion Problems in Developing Countries: Limitations of the Concept of Un-employment.International Labour Review (52)1.
Thomas, G. dan N. Wim. 2010. Enter-preneurship and Structural Economic Transformation. Small Bussiness Econo-mic34: 13-29.
Trinh, B., K. Kobayashi., P. L. Hoa. dan N. V. Phong. 2012. Vietnamese Economic Structural Change and Policy Implications, Global Journal of Human Social Science, Socio- logy, Economics and Political Science(12)9.
Umair, M. and R. Ullah. 2013. Impact of GDP and Inflation on Unemployment Rate: A Study of Pakistan Economy 2000-2010. International Review of Mana-gement and Business Research2(2): 388. Ungor, M. 2010. Structural Transformation
and Globalization, Dissertation, Faculty of the USC Graduate School, University of Southern California.
Xhafa, E. 2014. Trade Union and Economic Inequality, Perspectives, Policies, and Strategies. International Journal of Labor Research(6)1.
Xirinachs, J. M. S., I. Nubler. dan R. K. Wright. 2014. Transforming Economies: Making Industrial Policy Work for Growth, Jobs and Development, Geneva: International Labour Organi-zation.