CHAPTER III
RESEARCH METHOD
This study investigated the effect of reading on incidental vocabulary acquisition through reading online newspapers. The subjects were the third semester students at the English education study program of IAIN Palangka Raya because of their learning is learning based internet. The purposes of the study are: 1) To measure the effect of reading online newspaper toward students’ vocabulary acquisition incidentally by the third semester students at the English education study program of IAIN Palangka Raya; 2) To describe the third semester students’ attitudes at the English education study program of IAIN Palangka Raya towards vocabulary acquisition incidentally through reading English texts and online newspapers. This chapter discusses the method of the study related to research design, research type, population and sample, time and place, research instruments, data collection procedures, and data analysis.
A. Research Type
This study used a quantitative design because this study concerned with
the effect of reading online newspapers to students’ vocabulary acquisition
incidentally, then to gather the data the researcher used numerical data. In quantitative research, research design are classified into three broad categories, (1) descriptive research designs, (2) relationship research designs, (3) experimental research designs.51
51
Muhammad Adnan Latief. Research Methods on Language Learning an Introductions. 2014. Malang: UM Press. p. 122
The quantitative approach to the study of social and behavioral phenomena holds that the aim and methods of the social sciences are, at least in principle, the same as the aim and methods of the natural or physical sciences. Quantitative research more typically relies on measurement tools such as scales, tests, observation checklists, and questionnaires.52 Quantitative research is explaining phenomena by collecting numerical data that are analyzed using mathematically based methods (in particular statistics).53
B. Research Design
The research design used in this study was experimental research design, especially quasi-experimental. Experimental research measures the effect of one manipulated and controlled (independent) variable to another (dependent) variable.54 There are several types of experimental research, some of them are true experimental, quasi-experimental, and pre-experimental.55 Then, quasi-experimental designs are use when random selection of groups cannot be achieved. However, the control group and the experimental group are matched as nearly as possible. If a control group is not used, then parallel groups are experimented on to compare the consistency of the outcomes. The results of these designs are not as reliable as true experimental designs.56
There were two groups in this study, the first group is control class and the second group is experimental class. Both groups were given pre-test to
52
Donald Ary, et al. Introduction to Research in Education. (Eight Edition). 2010. Canada: Wadsworth. p. 420-421
53
Daniel Muijs. Op.cit. p. 1
54
Mohammad Adnan Latief. op. cit. p. 93 55
Mohammad Adnan Latief. Ibid. p. 92 56
measure the students’ score before treatment given. Then, the treatment was
given for experimental class. After that, post-test was given for both groups to
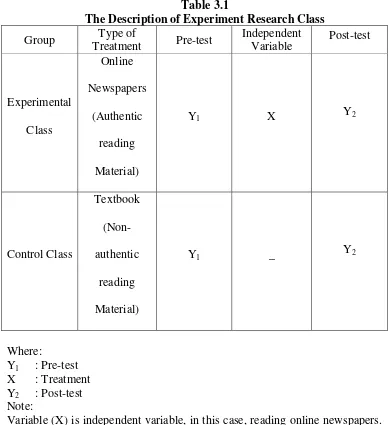
measure the students’ score after the treatment given. Thus, the researcher
made a table about description of experiment research class as follows: Table 3.1
The Description of Experiment Research Class
Group Type of
Treatment Pre-test
Independent Variable
Post-test
Experimental Class
Online Newspapers
(Authentic reading Material)
Y1 X Y2
Control Class
Textbook (Non-authentic
reading Material)
Y1 _ Y2
Where:
Y1 : Pre-test
X : Treatment Y2 : Post-test
Note:
C. Population and Sample
1. Population
According to Ary, et al., population is defined as all members of any well-defined class of people, events, or objects.57 According to Borg, W. R & Gall, M.D in Muhammad Adnan Latief, that target population in educational research usually is defined as all the members of a real or hypothetical set of people, events, or objects to which educational researchers wish to generalize the results of the research.58
Population of this study is all of the third semester students at the English education study program of IAIN Palangka Raya. The number of population is about 45students.
Table 3.2
The Number of The Third Semester Students at The English Education Study Program of IAIN Palangka Raya
No. Interpretive Reading Class The Number of Students
1. Class A 16
2. Class B 16
3. Class C 13
Total 45
Where:
Class A : Tryout class Class B : Control class Class C : Experiment class
57
Donald Ary, et al. op.cit. 148
58
2. Sample
According to Ary, et al., sample is a small group that is observed which is a portion of a population.59 Charles, C.M. state in Muhammad Adnan Latief, defines a sample as a small group of people selected to represent the much larger entire population from which it is down. The sample for Junior High School students taking national English examination in Malang are some of those students taking the national English examination.60
The population of the study is all of the students of English Study Program at State Islamic Institute of Palangka Raya academic year 2015/2016. The number of population is about 45 students. It is classified into three classes.
Cluster sampling, according to Ary, et al., is where the unit chosen is not an individual but, rather, a group of individuals who are naturally together.61 Thus, the samples were class B and C. Class B become the control class, class C became the experimental class, and class A become try out class for instrument of the test.
D. Time and Place
This study conducted for two months include doing the try out, taking the data, and interpreting the data. It will take place in English Education Study
59
Donal Ary, et al., loc.cit p. 148
60
Mohammad Adnan Latief. op. cit. p. 181
61
Program in State Islamic Institute of Palangka Raya, located in St. G. Obos 9, Complex Islamic Center Palangka Raya, Central Kalimantan, Indonesia. E. Research Instruments
1. Research Instruments
a. Test
In this study, the researcher used vocabulary levels test to answer the first question. In this test consists of unknown words to be tested, where the text adopted from Jakarta Post which related with the students environments. The total numbers of the target words were 60 words: noun (26), verb (19), adjective (14), and adverb (1). The test used twice, before and after the students read the texts, as a pre- and post-test. The pre-test is administered at the first meeting, then reading session take place one week after pre-test (next meeting) about 2 times meeting. The post-test is administered after reading session, exactly after it and they have no opportunity to look back at the text. According to Nation, this administration as forgetting occurs most rapidly immediately after the initial learning, it was assumed that a post-test administered immediately after the reading would show inflated results.62 Penguin series of graded readers is limited according to this scale:
62
Table 3.3
Penguin Series of Graded Readers
Level Number of
words
Easystarts 200
level one Beginner 300
level two Elementary 600 level three pre-Intermediate 1200 level four Intermediate 1700 level five upper-Intermediate 2300
level six advanced 3000
Beside that, According to Hu & Nation the students have to know 98% coverage of various kinds of text. When the students has 98% coverage of a text, adequate unassisted comprehension is possible.63 According to Nation and Beglar the vocabulary size test samples from the most frequent 14.000 words families of English. The test consists of 140 items (10 from each 1000 word level).64
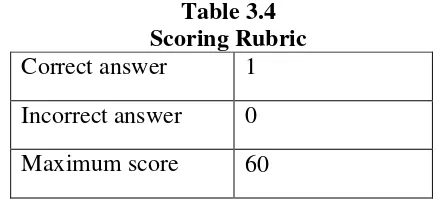
Rubric scoring based on Seyed Jafar Ehsanzadeh’s study, as follows: Table 3.4
Scoring Rubric Correct answer 1 Incorrect answer 0 Maximum score 60
So, from the table above, because of the correct point is 1 and the incorrect is 0, so the score were:
Minimum score : 0 x 1 = 0 Maximum score: 60 x 1 = 60
63
The Jepan Association for Language Teaching (JALT). July, 2007. Vol. 31, No. 7. p. 9 64
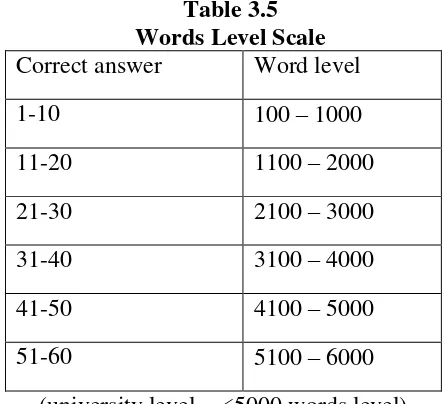
According to Nation and Beglar 10 item each 1000 words level, thus graded scale, as illustrated below:
Table 3.5 Words Level Scale Correct answer Word level
1-10 100 – 1000
11-20 1100 – 2000
21-30 2100 – 3000
31-40 3100 – 4000
41-50 4100 – 5000
51-60 5100 – 6000
(university level = <5000 words level)
b. Questionnaire
Questionnaire is an instrument in which respondents provide written responses to questions or mark items that indicate their response.65 Questionnaire is a written instrument consisting of questions to be answered or statements to be responded by respondents. It is used to gather information about fact or about opinion/attitude.66
The researcher will use Likert scales to measure the students’
attitudes toward vocabulary acquisition incidentally through reading. Likert scale consist of a series of statement all of which are related to
65
Donal Ary, et al. op. cit. p.648.
66
particular target (which can be among others, an individual person, a group of people, an institution, or a concept.67
This instrument adapted from Wilaiwan Lebkatem’s thesis, any five
-point Likert scale from “strongly agree” to “strongly disagree”
questionnaire was used to determine the subjects’ attitudes towards learning words through reading English text and newspaper.68
The questionnaire is to find the data from the five-point rating scale were calculated for means and standard deviations. The ranges of the mean scores for each level are employed for interpreting the level of agreement presented as follows.
4.21 – 5.00 = Strongly agree 3.41 – 4.20 = Agree
2.61 – 3.40 = Moderately agree 1.81 – 2.60 = Disagree
1.00 – 1.80 = Strongly disagree
Beside that, this data is concerned on attitudes towards any object or on any issue varied along the same underlying negative‐to‐positive dimension. To reflect
the students’ position on that dimension is illustrated below:
67
Rahmiyati. op. cit. p. 31.
68
Figure 3.1
The Students’ Attitudes Position
(source from Rob Johns (University of Strathclyde), Survey question bank: Methods fact sheet 1 on March 2010)
2. Research Instruments Try Out
The try out of instrument was conducted in class A on Wednesday, 14th September 2016 with the number of student was 13 students from 16 students because 3 students were absent. The researcher analyzed the test instruments to gain the information about the instruments quality that consists of instrument validity and instrument reliability. The procedures of the try out as follows:
a. The researcher give try out to the students.
b. The researcher give score to the students’ answer, then the researcher interpreted the result of data to know the instruments validity, instruments reliability, index of difficulty and discrimination power. c. After that, the researcher tested the test for the real sample.
3. Research Instruments Reliability
The reliability of a measuring instrument is the degree of consistency with which it measures whatever it is measuring. This quality is essential
Strongly disagree (1)
Negative Neutral Positive
Disagree (2)
Undecided (2)
in any kinds of measurement69. Afterwards, on a theoretical level, reliability is concerned with the effect of error on the consistency of scores. Thus, the high level of credibility if the score is consistent.
The researcher used Kuder-Richardson 21 (KR-21) formula. According to Ary, et al, Kuder-Richardson procedures Kuder and Richardson (1937) developed procedures that have been widely used to determine homogenity or internal consistency. There are two formulas, KR-20 and KR-21. In this study, the researcher will use KR-21 because KR-20 cannot be calculated by computer. KR-21 is computationally simpler but requires the assumption that all items in the test are of equal difficulty.70 The formula for KR-21 as follows:
Where:
r
xx = reliability of a whole testK = number of items in the test
= varians of the score
= mean of the score
The steps in determining the reliability of the test were: a. Making tabulating of testes’ scores.
69
Donal Ary, et al. op.cit p.236
70
Donal Ary, et al. ibid. p. 245
b. Measuring the mean of the testes’ scores with the formula :
M=
N Y
c. Measuring the total variants with the formula:
Vt=
d. Calculating the instrument reliability using KR-21.
e. The last decision is comparing the value of 11 and t
f. Knowing the level of reliability of instrument, the value of 11 was
interpret based on the qualification of reliability as follows:
11
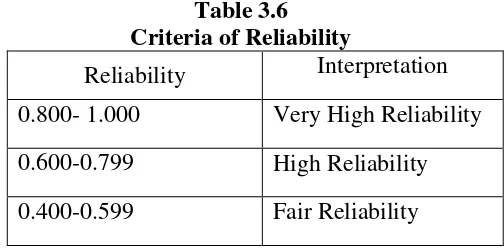
To interprete the reliability of instrument, the researcher used the criteria of reliability as shown below:
Table 3.6 Criteria of Reliability
0.200-0.399 Poor Reliability 0.000-0.199 Very Poor Reliability
From the measurement of instrument try out reliability it is known that the whole numbers of test items are reliable and can be used as the instrument of the study.
4. Research Instruments Validity
Validity was defined as the extent to which an instrument measured what it claimed to measure71.
a. Content Validity
According to Heaton, a good test should possess validity: that is it should measure what is intended to measure and nothing else.72 The test must be valid if its content was related to what students learned.
The test based on the students’ need that contains unfamiliar words
suitable with their material in the classroom. The content specification of items test, as illustrated below:
Table 3.7
Content specification of items test
No. Item Question/Definition Source Key Answer Part of speech 1 1 of or connected with the making
and distribution of medicine
Paragraph I Pharmaceutical Noun 2 2 a place from which an organization
is controlled
Paragraph I Headquarters Noun
3 3 not genuine Paragraph II Fake Verb
4 4 not genuine Paragraph III Counterfeit Verb 5 5 to say or show that one is
6 6 go forward Paragraph IV Ongoing Adjective 7 7 coming before a more important
action or event
Paragraph IV Preliminary Adjective 8 8 a person who sells food or other
small items from a stall in the open air
Paragraph VI Vendor Noun
9 9 having or showing suspicion Paragraph VII Suspicious Adjective 10 10 a child who has only recently
learnt to walk
Paragraph VII Toddler Noun 11 11 group of buildings where goods are
manufactured or assembled
Paragraph VII Factories Noun 12 12 a person suspected of a crime, etc Paragraph VIII Suspect Noun for others and having no freedom
Paragraph III Servitude Noun
4 16 wrong or excessive use of one’s power, position, etc
Paragraph III Abused Verb 5 17 very distressing Paragraph IV Harrowing Adjective 6 18 to succeed in creating a particular
feeling or attitude in oneself or in other people
Paragraph IV Mustering Verb
7 19 the ability to control fear when facing danger, pain, opposition, etc
Paragraph IV Courage Noun
8 20 to become free Paragraph IV Escape Verb
9 21 to end the existence of a law, practice, and institution
Paragraph IV Abolish Verb 10 22 to express approval or admiration
for somebody or something
Paragraph V Praised Verb 11 23 to keep somebody in a place from
which they want to move but cannot
Paragraph VII Trapped Verb
12 24 a women servant in a large house Paragraph VII Housemaid Noun
No. Item Question Source Key Answer Part of
speech 1 25 to allow something to be seen Paragraph I Revealed Verb 2 26 to give somebody/something a
particular name
7 31 to cover or make something cover a large or increasing area
Paragraph VI Spread Verb 8 32 that can not be stopped or
prevented
Paragraph VI Unstoppable Adjective 9 33 financial resources Paragraph VI Fund Noun 10 34 spreading easily from one person
to another
Paragraph VI Contagious Adjective 11 35 to give something to somebody or
front from which things are sold in a market, in a railway station, etc
Paragraph I Stall Noun
2 38 celebration; happiness and enjoyment
Paragraph V Engaging Adjective 8 44 to make sure of something Paragraph VI Ensure Verb 9 45 done without advance preparation,
practice or thought
Paragraph VII Impromptu Adjective
10 46 an area of short, regularly cut grass in the garden of a house or in a public park
Paragraph VII Lawn Noun
11 47 a thing passed to somebody by people who lived before them or from earlier events
Paragraph VIII Legacy Noun
12 48 cloth decorated with patterns sewn in thread or various
Paragraph VIII Embroidery Noun
No. Item Question Source Key Answer Part of
speech 1 49 to become or make something
stricter
Paragraph I Tightened Verb 2 50 a sudden appearance or start of
something
Paragraph I Outbreak Noun 3 51 to start something Paragraph III Launch Verb 4 52 quick to notice things and to think
or act
Paragraph III Alert Adjective
something bad
6 54 Mainly Paragraph V Mostly Adverb
7 55 a general feeling of illness, without clear signs of a particular one
Paragraph V Malaise Noun 8 56 not severe or harsh Paragraph V Mild Adjective 9 57 intended to prevent something
undesirable
Paragraph VI Preventive Adjective 10 58 to cover somebody or something
with soil, rocks, leaves
Paragraph VI Burying Verb
11 59 to arrange things or people in a particular way or position
Paragraph VI Disposing Verb 12 60 relating to or containing heat Paragraph VII Thermal Adjective
b. Face Validity
To face validity of the test items as follows:
1) The unfamiliar words based on the online newspapers and the definition based on the oxford dictionary.
2) Language was used English
3) The test items were suitable with the course outline of interpretive reading class
c. Construct Validity
To test the construct validity of the questionnaire, factor analysis was used by correlating score item of instrument by using Pearson product moment formula as follow.73
Where:
73
r
= correlation coefficientƩX = total score of an item
ƩY = total score of all items
n = number of respondent
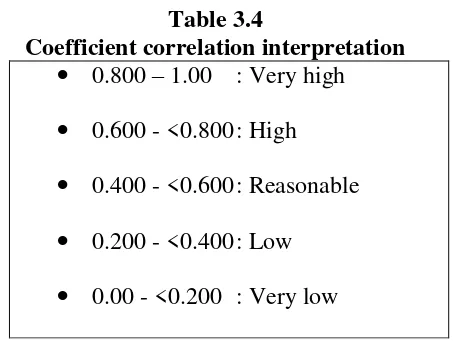
After gathering the results r11, the researcher interprets the result by
using coefficient correlation interpretation table as bellow: Table 3.4
Coefficient correlation interpretation 0.800 – 1.00 : Very high 0.600 - <0.800 : High 0.400 - <0.600 : Reasonable 0.200 - <0.400 : Low 0.00 - <0.200 : Very low
If the score item upper or equal with 0.400, the item is valid and acceptable. But, if the score item under 0.400, the item is invalid and unacceptable.
F. Data Collection Procedures
In this study, the researcher collected the data from pre-post test and questionnaire.
1. The researcher prepared the instruments test, those are pre-post test and questionnaire.
3. The researcher calculated the result of tryout to find the reliability and validity of test.
4. After found the reliability and validity of test, the researcher applied it in the experimental class and control class.
5. The researcher determined the class into experimental class and control class.
6. The researcher gave pre-test to the experimental class and control class before treatment.
7. The researcher gave treatment to experimental class using online newspaper.
8. The researcher gave post-test to the experimental class and control class after treatment.
9. The researcher gave questionnaire to experimental class at the end of meeting.
10. The researcher calculated, analyzed and interpreted the result of test and questionnaire
11.The researcher drew conclusion from the data finding and theories about Incidental Vocabulary Acquisition through Reading Online Newspaper by The Third Semester Students at The English Education Study Program of IAIN Palangka Raya
G. Data Analysis
The data of this study were the students’ score of pre-test, post-test and
researcher used ttest to solve the research problems of this study about
Incidental Vocabulary Acquisition in Reading Online Newspaper by The Third Semester Students at The English Education Study Program of IAIN Palangka Raya. In order to analyzed the data, the researcher did some way procedures, as follows:
1.Tabulated the data into the distribution of frequency of score table, then
found out the mean of students’ score, standard deviation, and standard
error of variable X1 (experimental class) and X2 (control class) by using the formulas below:
a. Mean of students’ score : =
Where:
= total of score
n = total of the students
b. Standard Deviation
S=
c. Standard Error
SEmd=
Where:
S= Standard deviation
n1= the number of the experimental group
n2= the number of the control group
N= Number of Case
d. Normality Test
It is used to know the normality of the data that is going to be analyze whether both groups have normal distribution or not. Chi square was used.
X2observed=
Where:
X2observed = Chi square
= frequency from observation
= expected frequency
Calculation result of X2observed was compared with by 5%
and 1% degree of significance. If X2observed was lower than
so the distribution list was normal.
Then, in this study, the researcher used One-Sample Kolmogorov-Smirnov Test to test the normality.
e. Homogeneity Test
It is used to know whether experimental group and control group, that were decided, come from population that has relatively same variant or not. The formula was:
Notice:
≤ , is homogeneity.
≥ , is not homogeneity.
If calculation result of was lower than
by 5% degree of significance, it meat both groups had same variant.
In this study, the writer used Levene Test Statistic to test the homogeneity of variance.
f. Calculated the data by using ttest to test the hypothesis of the study,
whether the using of online newspaper gave effect to the students’
vocabulary acquisition scores or not. To examined the hypothesis,
the researcher used ttest formula as follows:
tobserved=
Where:
Mn1 = the mean score of experimental group
Mn2 = the mean score of control group
S12= variance of experimental group
S22= variance of control group
n1= total of experimental group students
n2= total of control group students
To know the hypothesis was accepted or rejected using the
and Ho is rejected. If tobserved (the value)≤ttable, it means Ha is
rejected and Ho is accepted.
In this study, the researcher used Paired Sample T Test to test the hypothesis was accepted or not.
g. Interpreted the result of ttest. Previously, the researcher accounted
the degrees of freedom (df) with the formula:
df = (N1+N2-2)
Where:
df: degrees of freedom
N1: Number of subject group 1
N2: Number of subject group 2
2: Number of variable
After that, the value of ttest will be consulted on the ttable at
the level of significance 1% and 5%. If the result of ttest was higher
than ttable, it meat Ha was accepted. But if the result of ttest was
lower than ttable, it means Ho was accepted.
h. The researcher made the conclusion of data analysis obtained.
i. In addition, the researcher used SPSS 18.00 program to compare
the data.