Informasi Dokumen
- Penulis:
- Cindi Howson
- Pengajar:
- Mark Hammond, Technical Editor
- Sekolah: McGraw-Hill Education
- Mata Pelajaran: Business Intelligence
- Topik: Successful Business Intelligence: Unlock the Value of BI & Big Data
- Tipe: book
- Tahun: 2013
- Kota: New York
Ringkasan Dokumen
I. BI and Big Data from the Business Side
This chapter introduces the core concept of Business Intelligence (BI) and its relationship to Big Data, emphasizing that BI's value hinges on its effective use by people across the organization, not just the technology itself. The chapter establishes BI's broad applications and clarifies the sometimes-confusing terminology surrounding it, differentiating BI from related terms like "business analytics" and explaining the characteristics of Big Data (volume, velocity, variety). The importance of the human element is stressed repeatedly, highlighting how data interpretation and action are crucial for realizing BI's potential.
1.1 Business Intelligence by Other Names
This section addresses the ambiguity of the term "Business Intelligence," noting its varied interpretations depending on the audience. It emphasizes the importance of using terminology familiar and positively perceived by intended users. The section also differentiates BI from similar concepts like "business analytics," highlighting that while the terms are often used interchangeably, a key distinction can be made around the incorporation of predictive modeling and advanced statistical analysis. The discussion underscores the importance of focusing on the ultimate value of BI: enabling data access, interaction, and analysis for improved business management and efficiency.
1.2 How Business Intelligence Provides Value
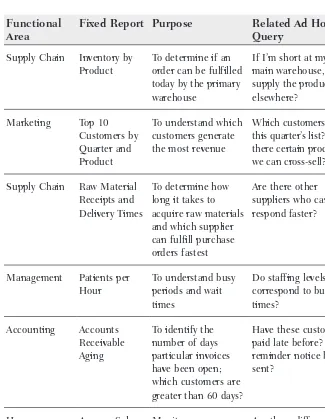
This section explores the multifaceted ways BI adds value across various organizational levels and functions. It shows how BI enables management and control through timely access to key performance indicators (KPIs) such as sales, expenses, and inventory levels, allowing for proactive interventions. The section also demonstrates BI's role in improving performance by identifying areas for enhancement in marketing, accounting, and manufacturing, as well as its use in operational efficiency, optimizing processes, and enhancing customer service. A compelling example of BI's application in improving the world is also provided, showcasing its role in public safety, healthcare, education, and disaster response.
1.3 The Business Intelligence Market
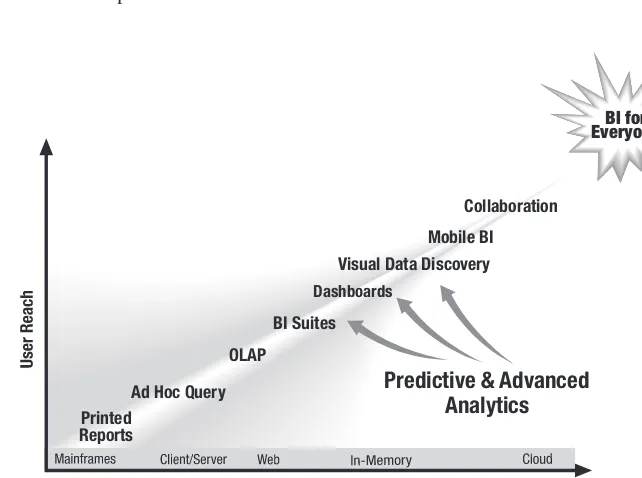
This section provides a market overview of BI, citing its high ranking among companies' IT investment priorities and its significant market value. It discusses the historical evolution of BI and the technological and business forces driving its increased adoption. These forces include globalization, heightened competition, a tech-savvy workforce, and the need for greater transparency and accountability. The section also highlights the crucial role of technology advancements, including cloud computing, in-memory computing, mobile BI, and visual data discovery, in expanding the reach and accessibility of BI tools. Finally, it emphasizes the need for relevance in BI deployment, ensuring that information provided is pertinent to diverse user groups.
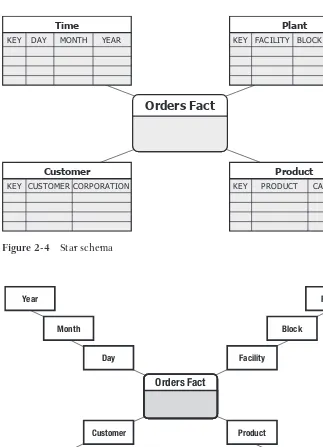
II. Technobabble: Components of a Business Intelligence Architecture
This chapter delves into the technical architecture of a BI system. It details the components involved in collecting, processing, and presenting data, focusing on the relationship between operational systems, data transfer mechanisms, data warehouses, and the technology platforms used to support them. A significant portion is dedicated to Big Data technologies and their integration into the BI architecture.
III. The Business Intelligence Front-End: More Than a Pretty Face
This chapter focuses on the user interface and tools that enable interaction with the BI system. It covers various front-end technologies, emphasizing user-friendliness and accessibility. Key concepts like self-service BI, business query and reporting, visual data discovery, dashboards, scorecards, mobile BI, and online analytical processing (OLAP) are explained, along with their applications and benefits. The importance of integrating BI with existing tools like Microsoft Office is highlighted.
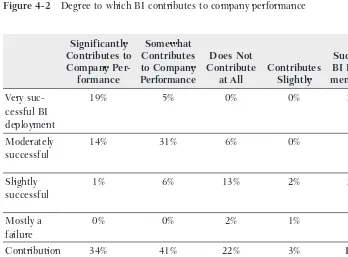
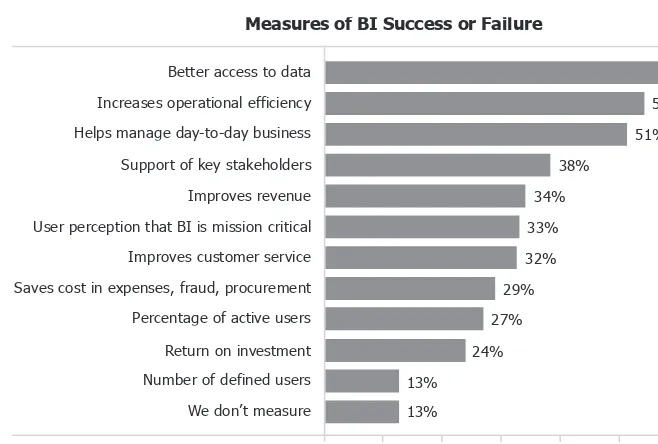
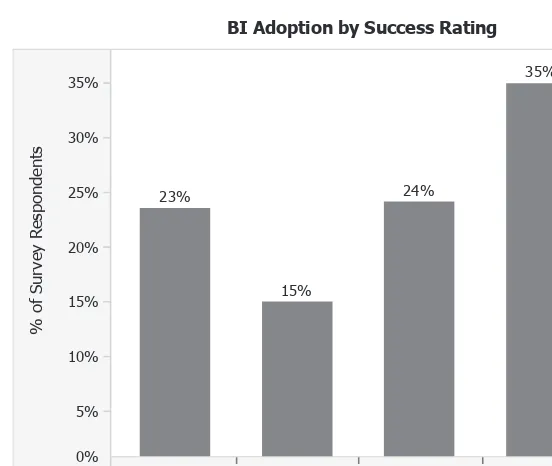
IV. Measures of Success
This chapter shifts the focus from technology to the measurement of BI success. It explores how to define and measure the business impact of BI initiatives, moving beyond simple technical metrics. Case studies from companies like Netflix, Learning Circle, and Constant Contact illustrate various approaches to measuring success, highlighting the importance of quantifiable results and return on investment (ROI).
V. Catalysts for Success: The LOFT Effect
This chapter introduces the "LOFT Effect" – Luck, Opportunity, Frustration, and Threat – as key catalysts for successful BI implementation. It examines how these factors influence the adoption and success of BI initiatives. The chapter explores how the interplay of these elements creates the impetus for change and innovation within organizations, emphasizing that even without a strong LOFT effect, successful BI deployment is still possible, although more challenging.
VI. Executive Support and Culture
This chapter underlines the crucial role of executive sponsorship and organizational culture in determining the success of a BI project. It discusses the importance of securing and maintaining executive buy-in, identifying the ideal characteristics of an executive sponsor, and fostering a data-driven culture within the organization. The significance of executive leadership in driving change and overcoming resistance to BI adoption is highlighted.
VII. The Business–IT Partnership
This chapter emphasizes the importance of collaboration between business and IT teams for successful BI implementation. It explores the challenges and opportunities inherent in this partnership, emphasizing the need for effective communication, shared understanding, and a collaborative approach to problem-solving. Case studies illustrate successful examples of this crucial partnership.
VIII. D Is for Data
This chapter delves into the critical aspect of data quality and management. It explores different dimensions of data, including breadth, quality, and architecture. Master data management and the concept of "right-time data" are discussed, highlighting their importance in ensuring data accuracy, completeness, and timeliness. The chapter addresses the challenges of data quality and its impact on the success of BI initiatives.
IX. Relevance
This chapter centers on the concept of relevance in BI, arguing that providing users with information pertinent to their needs is key to successful implementation. It demonstrates how relevance enhances decision-making across various fields such as healthcare and education, and emphasizes the importance of incentives and personalization in tailoring BI solutions to specific user requirements. The challenge of making sense of Big Data is addressed.
X. Agile Development
This chapter compares traditional waterfall development methodologies with agile approaches in the context of BI projects. It explains agile development techniques, particularly Scrum, and their advantages in delivering BI solutions iteratively and adapting to changing requirements. Case studies from companies like Netflix and Medtronic showcase the benefits of agile in BI development.
XI. Organizing for Success
This chapter discusses the organizational aspects of BI implementation. It contrasts enterprise-wide BI with departmental deployments, explaining the advantages and challenges of each approach. The role of BI steering committees and competency centers (BICC) in coordinating and managing BI initiatives is detailed. The importance of assembling a skilled BI team and selecting effective team leaders is also discussed.
XII. The Right BI Tool for the Right User
This chapter emphasizes the importance of selecting appropriate BI tools based on the needs and skills of different user groups. It discusses the role of BI standardization and the process of defining user segments based on their specific requirements. The concept of choosing the “right tool for the right user” is explored in depth, alongside case studies demonstrating the successful implementation of specific BI tools in varied contexts.
XIII. Other Secrets to Success
This chapter explores additional factors contributing to successful BI implementation. It includes a discussion on the significance of innovation, effective communication, comprehensive training programs, and the power of visual representations in effectively conveying insights. The chapter highlights the importance of actively promoting BI capabilities and training users to effectively leverage the system's potential.
XIV. The Future of Business Intelligence
This concluding chapter provides a forward-looking perspective on the future of BI. It discusses emerging trends such as BI search and text analytics, enhanced collaboration features, deeper integration with tools like email and Microsoft Office, and the evolving relationship between traditional data warehouses and Hadoop-based Big Data platforms. The chapter also addresses issues of data privacy in the context of Big Data and emphasizes the ongoing need for organizations to adapt and evolve their BI capabilities to stay competitive.