Business Intelligence Strategy
and Big Data Analytics
A General Management Perspective
Steve Williams
AMSTERDAM•BOSTON•HEIDELBERG•LONDON NEW YORK•OXFORD•PARIS•SAN DIEGO SAN FRANCISCO•SINGAPORE•SYDNEY•TOKYO
Copyrightr2016 Elsevier Inc. All rights reserved.
No part of this publication may be reproduced or transmitted in any form or by any means, electronic or mechanical, including photocopying, recording, or any information storage and retrieval system, without permission in writing from the publisher. Details on how to seek permission, further information about the Publisher’s permissions policies and our arrangements with organizations such as the Copyright Clearance Center and the Copyright Licensing Agency, can be found at our website:www.elsevier.com/permissions.
This book and the individual contributions contained in it are protected under copyright by the Publisher (other than as may be noted herein).
Notices
Knowledge and best practice in this field are constantly changing. As new research and experience broaden our understanding, changes in research methods, professional practices, or medical treatment may become necessary.
Practitioners and researchers must always rely on their own experience and knowledge in evaluating and using any information, methods, compounds, or experiments described herein. In using such information or methods they should be mindful of their own safety and the safety of others, including parties for whom they have a professional responsibility.
To the fullest extent of the law, neither the Publisher nor the authors, contributors, or editors, assume any liability for any injury and/or damage to persons or property as a matter of products liability, negligence or otherwise, or from any use or operation of any methods, products, instructions, or ideas contained in the material herein.
British Library Cataloguing-in-Publication Data
A catalogue record for this book is available from the British Library.
Library of Congress Cataloging-in-Publication Data
A catalog record for this book is available from the Library of Congress. ISBN: 978-0-12-809198-2
For Information on all Morgan Kaufmann publications visit our website athttps://www.elsevier.com/
Publisher:Todd Green
Acquisition Editor:Todd Green
Editorial Project Manager:Lindsay Lawrence
Production Project Manager:Priya Kumaraguruparan
Designer:Mark Rogers
Steve Williams is the founder and President of DecisionPath Consulting. He specializes in helping clients formulate business-driven, technically-savvy strategies for leveraging business intelligence (BI), analytics, and big data to improve profits. As a strategy consultant, he blends general
management experience and education with nearly 30 years’ experience
in the information technology (IT) industry—the last 15 of which have been focused on BI and analytics. Steve’s strong business, IT, and BI backgrounds enable him to bring a holistic, business-focused perspective that differs from the traditional technology-centric approaches to BI and analytics strategy. While technology-led innovation is a valid approach, the challenges in the world of BI, analytics, and big data are predomi-nantly on the business and organizational side. Approaches to meeting those challenges require a general management perspective.
Over the past 15 years as a BI strategy consultant, Steve has had the privilege of working with successful companies in retail, distribution, manufacturing, transportation and logistics, consumer packaged goods, financial services, government, and utilities. His clients have included:
• ArcBest
• Heinens Fine Foods
• Louisville Gas and Electric
• Navy Federal Credit Union
• Northwestern Mutual Life
• Partners Federal Credit Union
• Pinnacle Foods Group
• Principal Financial Group
• Toronto Hydro Electric System
• United Natural Foods
• U.S. Social Security Administration
• U.S. Treasury
While the industries and companies are different, what has become clear through this consulting experience is that there are many common chal-lenges when it comes to leveraging BI, analytics, and big data to enhance profitability and organizational effectiveness. Steve understands these challenges, and he provides proven methods for meeting them.
Starting in 2006 with the publication of The Profit Impact of Business
Intelligence, coauthored with Nancy Williams, the business-driven BI and analytics strategy methods that Steve and Nancy pioneered have been the subject of many print magazine articles. A representative list of Steve’s articles includes:
• “Big Data Strategy Approaches: Business-Driven or
Discovery-Based?”Business Intelligence Journal, 4th Quarter 2014
• “Analytics: A Tool Executives and Managers Need to Embrace”
MWorld (The Journal of the American Management Association, Winter 2012 13
• “Five Barriers to BI Success And How to Overcome Them”
Strategic Finance, July 2011
• “Power Combination: Business Intelligence and the Balanced
Scorecard”Strategic Finance May 2008)
• “BI Impact: The Assimilation of Business Intelligence into Core
Business Processes” Business Intelligence Journal, 4th Quarter 2007 (w/ Mohamed Elbashir)
• “Delivering Strategic Business Value”Strategic Finance, August 2004
In addition to widely sharing his thinking about BI, analytics, and big data, Steve has also served as a judge since 2001 for the annual TDWI Best Practices in Business Intelligence and Data Warehousing Competition. In this capacity, he has seen hundreds of BI case studies and worked with fellow judges who are leading instructors and consul-tants in the field.
Most executives are familiar with big data, business intelligence (BI), analytics, business performance management, business process management, and fact-based decision-making, but they are uncertain about how to best deploy them to create business value. For every organization that is doing wonderful things (think Amazon), more are struggling to effectively implement these innovations (though most are not that new).
Steve Williams’ book reminds me of a meeting that I had with the CIO of a major university who wanted to discuss the development of a data warehouse and various BI applications. In the meeting I learned that the school’s provost was interested in having a campus-wide score-card system and the ability for business managers to “slice and dice” (ie, OLAP) financial and student data.
The CIO wasn’t sure where to start with this request. After learning that there wasn’t a good data infrastructure in place, and knowing how different the target applications were, I discussed the importance of thinking both short and long term. While both of the desired appli-cations were feasible, they differed dramatically in terms of the scope of the data requirements, the required financial resources, the technol-ogy infrastructure, the amount of senior management support, and the demands and implications of organizational change. There needed to be frameworks and a roadmap for moving forward, along with plans for creating the required data infrastructure and developing and rolling out specific, prioritized applications that would generate quick and long-term wins. In other words, she needed to think about BI strategically.
technological challenges seem daunting, ensuring that the work is busi-ness driven is even more challenging.
Steve Williams, along with his wife Nancy, have successfully run their own BI consulting firm for over 15 years, focusing on helping compa-nies develop and implement BI (and now big data) strategies. In the process, he has developed frameworks and approaches and gained practical insights and experiences in numerous firms and industries. I formally met Steve several years ago and since then he has shared his knowledge in my BI classes at the University of Georgia and in the arti-cles he has written for theBusiness Intelligence Journal(I serve as Senior Editor) and elsewhere. I’ve been consistently impressed with the business sense, practicality, and clarity of his thinking and approaches, and I’ve integrated his materials into my BI courses. This book codifies much of what Steve has experienced and learned over the years and passes this knowledge on to the reader, whether the person is an executive or a BI/ IT professional who wants to take a strategic approach to BI.
In this book you will find both content and features that will help you plan and execute BI strategically. Terms are carefully defined. The var-ious kinds of BI applications are described and illustrated. Use cases in a variety of industries are provided so you better understand the poten-tial use, value, and challenges of BI. Frameworks and methodologies help you to understand and execute what must be done. The links between BI and the improvement of decision making, business pro-cesses, and performance management are clearly shown. The potential barriers to success and approaches for overcoming them are presented. Key points are summarized, along with skill development opportu-nities to practice what you have learned. Questions are interspersed throughout the book to help you think about the materials.
The frameworks, approaches, and methodologies will help you think strategically about big data.
After I read Steve Williams book, it made me think of my meeting with the university CIO. Much of the advice I gave was consistent with the recommendations and practices described in his book, though not as well thought out, organized, and presented. If you need to think about BI (and all the related topics) strategically in your company, I’m confident that you will find this book to be very helpful.
Hugh J. Watson
This book reflects what I think I have learned about BI, analytics, and big data over the past 15 years. It is based in no small measure on empirical evidence gained through in-depth interviews and surveys within the client companies we have served. It is also based on what I have learned from talking with smart people in the industry—some of whom are occasional competitors, and all of whom are respected peers. I would include people such as Evan Levy, Chris Adamson, Claudia Imhoff, Dave Wells, Bill Inmon, Jill Dyche, and Mike Gonzales, among many others. And I would be remiss if I failed to mention the exchanges of ideas and perspectives I’ve had over the years with Hugh Watson at the Terry School, University of Georgia and with Barb Wixom, now at the MIT Center for Information Systems Research.
As a consultant, I’ve had the privilege of working with some excep-tional colleagues at DecisionPath. Our BI, analytics, and big data strategy work has always addressed technology. This includes technical readiness, technology strategy, technical risk mitigation, tool selection, and data architecture. In this area, I’ve learned much from Mohan Srireddy and Tom Victory—two senior colleagues who are great at explaining technical issues and the costs and benefits of the options. Over the years, they have also shared what they have learned from the technical implementation work they do for our clients, which has informed some of my perceptions about the technical imple-mentation challenges associated with enterprise data warehousing, BI, and analytics initiatives.
We’ve served some of the same clients, and some different clients. This allows us to see what challenges seem to be common, to share our insights from our different experiences, and to challenge and hone the thinking we bring to our clients.
THE CHALLENGE OF FORMULATING BUSINESS INTELLIGENCE STRATEGY
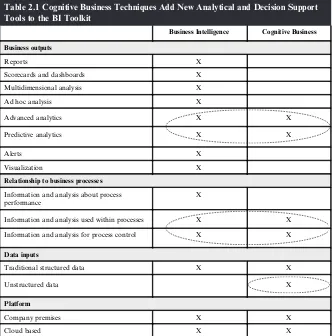
Pick up any business newspaper or periodical these days and you’re likely to find an article about big data or an advertisement about cog-nitive business—or both. These concepts are positioned as if they rep-resent big advancements, and it is true that there are new types of data for businesses to leverage using new kinds of analytical tools. But if we drill down below the surface, the business benefits of big data and cognitive business are the same benefits that have been delivered by business intelligence (BI) for at least 15 years.
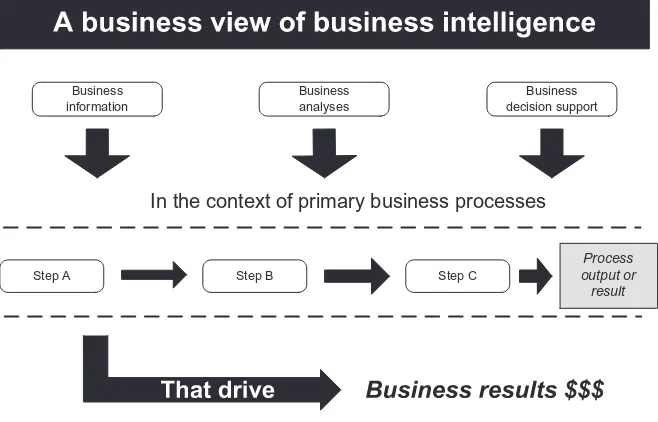
From a business perspective, BI has always been about leveraging busi-ness information, busibusi-ness analyses, and decision support to improve profitability. The business benefits of BI may be couched in different business terms, such as“customer intimacy”or“supply chain agility”or the like, but there has to be a connection between achieving those things and incremental profitability. Otherwise, it is economically impossible to achieve a return on investment (ROI). So the strategic challenge for BI has always been to figure out how to leverage BI in the context of the core business processes that drive business results. We can now add the challenge of figuring out how to leverage stored digital content such as photos, texts, location data, music files, and other newer forms of data— which is the core of what is new about big data and cognitive business. That having been said, the business-driven BI strategy formulation meth-ods described in this book apply equally well to traditional data and to big data, and they have been proven in practice since 2001. With this in mind, we’ll use the term BI to include leveraging the new types of digital content known collectively as big data. Where appropriate, we’ll also dis-cuss big data and cognitive business as specific concepts.
business people responsible for achieving business results. Our focus is on the business side of BI, because that is where the ROI is actually created. We can think of the technical side as creating an information asset, and the business side as leveraging the asset. From a general management perspective, pursuing BI-enabled business improvement opportunities is largely about designing the asset, creating it, and using the asset within and across the company to generate incremental profits. Accordingly, a business-driven BI strategy must address those topics.
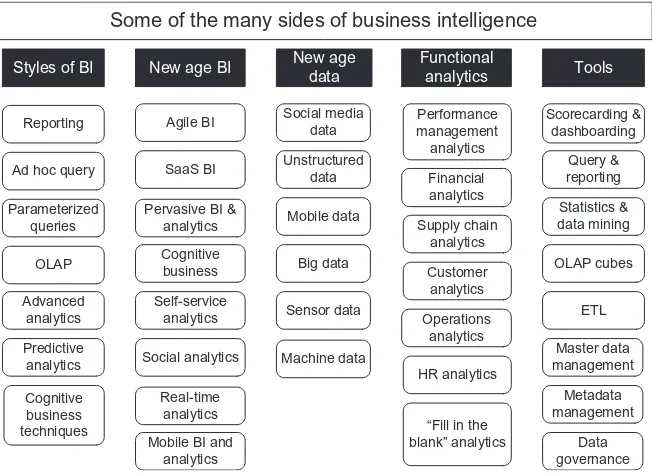
To formulate a BI strategy, it helps to have a common understanding of what BI is. When we talk with business leaders, managers, and analysts about their BI opportunities, the picture that emerges is of BI as a multi-faceted business improvement tool kit. The specific tools include reports, scorecards, dashboards, multidimensional analyses, ad hoc analyses, advanced analytics, predictive analytics, and alerts. Accordingly, BI can be used in many different ways to achieve many different business purposes.
Since Nancy Williams and I wrote The Profit Impact of Business
Intelligence in 2006, we have had many additional opportunities to
work with leading companies in a wide range of industries. In the course of helping them formulate and execute BI strategies and pro-gram plans, we have seen firsthand that otherwise successful compa-nies struggle in two key areas when it comes to BI:
• BI Strategy: understanding how they can leverage BI in core
busi-ness functions such as marketing, sales, customer service, opera-tions, distribution, supplier management, cost improvement, and financial management; and
• BI Program Execution:effectively prioritizing, aligning, and executing the diverse workstreams that are critical for achieving an ROI, includ-ing BI applications development, integratinclud-ing BI applications into targeted business processes, and managing changes in how information and analyses are used to inform high-impact business decisions.
Essentially, we have seen that BI can deliver competitive advantages and substantial economic benefits,but only if companies overcome these
commonly-encountered challenges. There is no shortage of excellent
executing the BI strategy. Further, there is a need for managers to fully understand that BI initiatives are really business initiatives that require business units to change how they use information and analysis to drive and improve business results—particularly profits.
Business Intelligence Strategy and Big Data Analyticsis written for busi-ness leaders, managers, and analysts—people who are involved with advancing the use of BI at their companies or who need to better under-stand what BI is and how it can be used to improve profitability. It is also written for BI directors and enterprise data architects—the IT people who have to understand the business purposes that drive technical requirements and designs. The book is written from a general manage-ment perspective and it draws on observations at 12 companies whose annual revenues range between $500 million and $20 billion. Over the past 15 years, my company has formulated vendor-neutral business-focused BI strategies and program execution plans in collaboration with manufacturers, distributors, retailers, logistics companies, insurers, investment companies, credit unions, and utilities, among others. Through an intensive process that typically lasts 10 12 weeks, we work with business leaders, managers, and analysts across all major functions to identify specific ways that BI can be leveraged to impact business results. We also use surveys and interviews to identify any organiza-tional, business unit, and/or technical execution barriers or risks. It is through these experiences that we have validated our business-driven BI strategy formulation methods and identified common enterprise BI pro-gram execution challenges. The ultimate goal of this book is to share methods and observations that will help companies achieve BI success and thereby increase revenues, reduce costs, or both.
OVERVIEW OF THE BOOK
Business Intelligence Strategy and Big Data Analyticsis written to both advance the reader’s understanding of BI and to introduce proven practical methods and frameworks for:
• Determining the strategic importance of BI in an industry and company;
• Documenting and prioritizing an enterprise and/or business unit portfolio of BI opportunities;
• Articulating and documenting business-driven BI requirements; • Identifying business and technical readiness gaps, risks, and barriers
to success;
• Identifying typical execution challenges;
• Understanding the key BI program execution workstreams; and • Understanding options and tactics for organizing and executing
enterprise BI initiatives.
In addition, we provide optional “skill development opportunities” which readers can avail themselves of if they wish. These are end-of-chapter exercises that afford opportunities to practice the methods or apply the frameworks that are introduced in the various chapters.
ORGANIZATION OF THE BOOK
One of the challenges companies face when it comes to BI is develop-ing a common understanddevelop-ing of what BI is and how it works as a busi-ness process and busibusi-ness performance improvement tool. There is a lot of hype in the marketplace for BI tools and services, driven by large advertising budgets. This causes confusion. We’ll cut through the con-fusion in the first two chapters. Chapter 1 The Personal Face of
Business Intelligence uses an actual case study to illustrate what BI
looks like to the business people in a company whose identity has been disguised.Chapter 2 Business Intelligence in the Era of Big Data and
Cognitive Business seeks to sort through the hype, provide
business-oriented definitions of key concepts, and provide industry and func-tional views of what BI success looks like.
The next three chapters cover various aspects of BI Strategy.
Chapter 3 The Strategic Importance of Business Intelligence drills
Portfolio. Chapter 5 Prioritizing BI Opportunities (BIOs) discusses factors to consider when prioritizing BIOs and introduces some methods for doing so. Applying the concepts, methods, and frame-works from these three chapters results in a specific and effective business case for investing in BI. At this stage, a company knows how it wants to leverage BI to increase revenues, reduce costs, or both.
Assuming a company can meet the technical challenges of a BI pro-gram, a topic we’ll table for now, it next faces the task of leveraging BI within the core business processes that drive business results. Once one or more specific BI applications have been built, the onus for leveraging BI to create business value falls on the business unit or units for which the BI application was built. In Chapter 6 Leveraging BI for Performance Management, Process Improvement, and Decision
Support we use business examples to demonstrate how to leverage BI
for improving the business processes that drive business results. We also show how BI can enhance business performance management capabilities. Essentially, companies need to leverage BI in ways that “move the needle”and this chapter provides frameworks for doing so.
We mentioned at the outset that many companies struggle with executing an enterprise or business unit BI program. In Chapter 7 Meeting the
Challenges of Enterprise BI, we share observations from our experience
over the past 15 years, along with some frameworks for identifying risks, organizing for success, and synchronizing the work to be done. Many of the challenges of enterprise BI are predictable and they can be overcome by effective general management methods.
Finally, Chapter 8 General Management Perspectives on Technical
Topics is intended to provide business people with an overview of
some of the concepts that are bound to arise when it comes to executing the technical side of an enterprise BI initiative. Business leaders and managers are often asked to endorse six-figure and seven-figure technol-ogy budgets for BI, and thus it is important to understand some of the choices and implications when it comes to BI-related architecture and technologies.
CLOSING THE LOOP
CHAPTER
1
1
The Personal Face of Business Intelligence
One way to develop a useful perspective about what business intelligence (BI) is and its importance in the business world is to look at what business people talk about when the subject is BI. Developing a BI Strategy using
the methods we’ll describe in this book is a people-intensive process—as
it should be. We can leverage proven techniques, but the quality of the
results depends to a significant degree on“getting into the heads”of key
executives and managers. How do they see their world, what are they looking to accomplish, and how do they want BI to help them? We can
build a business case that is “bullet-proof” from a logical, corporate
perspective, but it also has to resonate with business people on a more intuitive level that squares with what they believe they would be able to achieve if they had better BI. So to put a human face on BI, this chapter will step through the business challenges and BI gaps identified by top
executives in a manufacturing company we’ll call Big Brand Foods
(BBF). We’ll then summarize the BI Vision and BI Portfolio that
emerged from the strategy formulation process and offer some generaliza-tions about BI opportunities (BIOs) for other manufacturing companies.
While we’ve chosen a manufacturing company for this BI case study, the
logic and process of identifying industry challenges, company strategies, functional challenges, and BIOs applies to any company in any industry. Further, the views of executives in the different business functions may be of value to executives in the same function but different industries.
1.1 BI CASE STUDY SETTING
1.1.1 Industry Setting
Food manufacturing is a large, complex industry that generates over $800 billion in annual sales. Typical food manufacturers produce hundreds or thousands of end products (called stock-keeping units, or SKUs) that are sold through a complex network of brokers, food dis-tributors, and food service distributors to tens of thousands of retail outlets and restaurants. At the retail level, once the sole province of grocery stores and restaurants, food products are sold in many
Business Intelligence Strategy and Big Data Analytics. DOI:http://dx.doi.org/10.1016/B978-0-12-809198-2.00001-4
different places—by mass merchandizers, drug stores, convenience stores, and warehouse clubs, among others. Industry data suggest that less than half of food product sales are through traditional grocery stores. Other key industry trends are increased concentration of retail sales (Walmart alone accounts for over 50% of food sales), the rise of healthier products, and the diversity and increased quality of private label products that are now available. As a result of these and other trends, food manufacturers must cope with increased complexity and intense margin pressures, both of which impact profitability and cus-tomer service. Faced with these challenges, more and more food manu-facturers are recognizing the strategic importance of BI.
1.1.2 Company Situation
BBF is a very successful manufacturer of widely known branded food products. Acquisition of known brands from competitors who were fine-tuning their brand portfolios allowed BBF to achieve $4 billion in revenue, and to be first or second in market share in most of the prod-uct categories in which it competed. With that growth came challenges. BBF was essentially a roll-up of acquired brands, plants, people, and systems, and it lacked the mature, well-synchronized business processes sometimes found in larger companies in the industry. BBF was addres-sing that challenge through an infusion of upper management talent from global competitors, such as Kraft, Unilever, Coca Cola, and Nestle. These seasoned professionals quickly figured out that BBF had substantial gaps in its ability to cope with industry complexity and manage its profitability in the face of industry dynamics. Further, they were aware that BBF was behind the times when it came to leveraging sophisticated BI and business analytics to improve profitability.
1.2 BBF BI OPPORTUNITIES
Recognizing that BI advances were critical to future business success—
and to his own career—BBF’s Chief Information Officer (CIO)
launched an enterprise BI strategy project. His objective was to iden-tify specific opportunities to leverage information and sophisticated
analytics within BBF’s major business functions and processes, such as
challenges and BIOs were identified via interviews with executives, managers, and analysts across all major functions within BBF.
1.2.1 The CEO’s View of Business Challenges and BIOs
After earning an MBA from a top-tier business school, John McCoy rose quickly through the ranks in sales and marketing for consumer packaged goods companies. When BBF was put together by a large private equity firm (LPE), it was with a view toward further acquisitions and eventually going public. The original CEO moved too slowly along this strategic path, and thus LPE brought in McCoy, who was known to a LPE direc-tor who had been CEO of a multibillion dollar food manufacturer.
Within less than a year, McCoy had grown frustrated. While acquisi-tion plans were coming along nicely, BBF lacked the ability to actively manage revenues and costs. McCoy realized that execution is critical in the packaged food industry, and to get better at it he and his leadership
team needed better visibility into all aspects of BBF’s operations. As an
industry veteran, McCoy understood that the packaged food business is
complex—getting hundreds of products to thousands of retail shelves
and making a profit despite fluctuating purchasing patterns and grow-ing retailer purchasgrow-ing power due to increased concentration.
As he considered what it would take to conquer complexity and move BBF to a point where all levels of the company had the visibility needed to be successful, his thoughts turned to BI and the results of a 2009 survey within the packaged food manufacturing industry. The results were troubling:
• over 50% said they wanted better information for cost and financial
analysis;
• over 60% reported gaps in fundamental information and analytics
needed for customer service analysis, and a third of those reported major gaps;
• over 80% reported gaps in fundamental information and analytics
needed for performance management, and a quarter of those reported major gaps;
• over 80% reported gaps in fundamental information needed for sales
and operations planning; and
• over 70% said that a key obstacle to BI success was lack of
McCoy considered these results and wondered whether
the results would be the same within BBF—or even worse. At the
same time, he knew that BBF’s performance depended on
execution, and he knew the old adage that “what gets measured
gets managed.” He considered where to add a BI-related objective
to the BBF’s overall strategic objectives, and decided that it
fit under the objective “Leverage Information.” With that in
mind he added the subobjective “Create Business Intelligence
Scorecards.”
•••
Questions to Consider:1. What does McCoy need to do to ensure that BBF is
successful in leveraging BI and analytics to achieve its business objectives?
2. What should be the relationship between BI, analytics, and a strategy map?
3. Is it likely that people within BBF have a common definition of BI? 4. What should the dashboards display, and at what level of detail? 5. Who should be involved in dashboard design?
6. Which business functions should receive their dashboard first? Second? Why?
7. What does“visibility”mean in this context?
1.2.2 The Chief Operating Officer’s View of Business
Challenges and BIOs
After graduating in the mid-1970s with a B.S. in Industrial Engineering from a leading engineering school in the US manufactur-ing belt, Fred Sutcliff went to work in operations for a leadmanufactur-ing bever-age manufacturer. He spent over 20 years in various manufacturing
and supply chain jobs, culminating in the role of Vice President—
Supply Chain. In that capacity, he was responsible for movement of products that resulted in $6 billion in revenues annually. Intrigued by what he perceived to be entrepreneurial possibilities, Fred joined BBF as Chief Operating Officer (COO).
Once onboard, Sutcliff’s top priority was to put together a complete
his hands-on business information and analyses that would answer some of his most pressing questions:
• How are the 11 manufacturing plants performing in terms of cost,
quality, safety, and customer service? What are the root causes of any unfavorable variances?
• How are plant assets performing in terms of equipment downtime
and capacity utilization? What are the root causes of any unfavor-able variances?
• Within the plants, which production lines are performing best?
What are the root causes of any performance differences?
• Who are our strategic suppliers and how are they performing? Do
we have supplier scorecards?
• How do our inbound logistics costs and service levels compare with
others in our industry? With our targets? What are the root causes of any unfavorable variances?
• How are our distribution centers performing in terms of operating
costs and customer service? What are the root causes of any unfa-vorable customer service variances?
• How is our customer service department performing against
cus-tomer service metrics? What metrics are we using?
• How effective are we at demand forecasting, and at sales and
opera-tions planning process?
• What are our costs-of-goods and gross margins and trends for the
last several years? Are we getting better?
What Fred found was a mixed-bag of fragmented information, mostly in the form of a monthly PowerPoint decks that contained
501 pages of report-style information lifted from spreadsheets and
traditional reports. Despite having two decades’ experience, he found
it difficult to see the big picture based on the PowerPoints. In frustra-tion, he asked the VP of Finance assigned to Operations whether there were plans underway to provide the operations function with the infor-mation and analyses needed to manage the key performance variables
that would determine the success—or failure—of company efforts to
“data guy,” he was pleased to learn from the VP of Finance of the
strategic objective to “Create Business Intelligence Scorecards.”
Further, he was pleased to learn that the enterprise BI strategy project was underway and that his 11 direct reports were slated to be inter-viewed about their views of business challenges and BI opportunities.
•••
Questions to Consider:1. What does Sutcliff need to do to ensure that he and his direct reports obtain the business information and analyses they require to manage the performance variables for which they are accountable?
2. By what method might they determine what information and analyses they require?
3. How should he and his direct reports determine the right set of key performance indicators?
4. For Operations, is it more important to have a dashboard or to have other forms of BI, such as advanced analytics, predictive analytics, alerts, reports, or multidimensional analyses?
5. Who should drive scorecard design?
6. Which operations function—procurement, plant operations, transpor-tation, distribution, customer service, cost optimization, or sales and operations planning—should receive their dashboard first? Second? Why?
1.2.3 The Chief Marketing Officer’s View of Business
Challenges and BIOs
Rachel Smith was another hard-charging, fast-mover on the BBF man-agement team. After graduating from a top-tier MBA program, Smith advanced through a traditional succession of marketing jobs for three different manufacturers of branded consumer products. Her many years of marketing experience were mostly in the packaged food pro-ducts industry, and she was well-prepared for her new role as Chief Marketing Officer (CMO) when she joined BBF.
Much of the pressure for profits that the Board was placing on the
management team fell squarely on Smith’s shoulders. She was
group and other market research, market share data, and brand profit and loss (P&L) statements generated through laborious
spreadsheet-based processes. She was not a “data” person in the same sense that
the operations people were, and thus her perception was that BI and analytics were essentially better reporting. When the subject of
com-mitting her business resources to the strategic objective “Create
Business Intelligence Scorecards” was raised in a meeting of BBF’s
Executive Team, Rachel made it clear that BI was certainly not among the top five objectives for Barry Green, her VP of Marketing.
As it turned out, however, Barry Green was very aware of the potential for BI and analytics to help meet the business challenge of
optimizing the profitability of BBF’s brand portfolio. His group felt
the pain week in and week out of trying to make good marketing deci-sions without having a complete picture of current performance or the ability to effectively model the P&L impact of various courses of action. Green identified the key gaps as:
• the people in the marketing, sales, and finance departments lacked a
common set of business facts, figures, and terminology for discuss-ing actual revenues and profits in relation to the targets in annual operating plans and quarterly updates;
• due to business information gaps and inconsistencies, marketing
lacked a complete picture of product shipments in its various distri-bution channels, making it nearly impossible to determine and respond to unfavorable volume performance in, for example, the grocery, mass merchandizer, drug store, convenience store, food ser-vice, and/or warehouse club channels;
• due to departmental boundaries and business information gaps and
inconsistencies, marketing lacked a timely, automated way to determine
the return-on-investment on the 40,0001promotional campaigns BBF
executed every year, which made it difficult to optimize brand P&L;
• due to business information gaps and inconsistencies, marketing
lacked an automated, efficient way to manage the brand portfolio by region, customer, and SKU;
• due to departmental boundaries, information gaps, and differences
• the people who provide financial planning and analysis services to the marketing department have been limited by lack of investment in modern financial management systems, which means that a $4 billion company with nearly 1000 SKUs is being managed with manually intensive, error-prone, and spreadsheet-based budgeting and variance analysis processes.
In a business where small market share losses can translate to materially adverse P&L impacts, marketing execution is key, and Barry Green was sure that BBF needed to more dynamically manage its marketing activities. He was happy to provide his views of the business challenges and BI opportunities for the marketing depart-ment. At the same time, BBF was a pretty lean operation, and Green had plenty to do. The irony occurred to him that he and his market-ing colleagues were so busy domarket-ing thmarket-ings the hard, slow way that they might not have the time needed to work with the BI team to design and deliver modern, dynamic BI and analytics. Having those capabil-ities would overcome fundamental gaps in marketing efficiency
and effectiveness—allowing marketing managers and analysts to
focus much more time on optimizing the profitability of the brand portfolio.
•••
Questions to Consider:1. What can be done to help the CMO evolve her understanding of the profit impact of BI and analytics?
2. What can the CEO do to ensure that the CMO is on
board with the strategic objective “Create Business Intelligence Dashboards”?
3. What might a Brand Management Dashboard include?
4. With nearly 1000 SKUs distributed through eight major channels to customers who might operate more than 1000 stores across the United States, how could a Brand Management Dashboard be designed to
“conquer complexity”?
5. For Marketing, is it more important to have a dashboard or to have other forms of BI, such as advanced analytics, predictive analytics, alerts, reports, or multidimensional analyses?
1.2.4 The Chief Sales Officer’s View of Business Challenges and BIOs
Like others on the BBF Executive Team, Bob Alvarez had progressed through successively more responsible positions with larger packaged food product manufacturers. For over 25 years in sales, he had moved up the ranks by being aggressive in driving revenues to meet targets. Bob was known for his skill in developing effective professional rela-tionships at the highest levels with key customers. By the time he joined BBF, he had also proven to be a very effective coach and men-tor to his sales teams.
At BBF, the scope of the Chief Sales Officer’s (CSO’s) job was
defined to include top-to-top sales, directing regional sales managers, managing the business relationship with their primary food broker, managing trade promotion spending in concert with brand strategies, and managing a business development organization, whose function was to translate brand strategies and plans into executable sales plans
and tracking results. BBF’s food broker handles sales within the
gro-cery, warehouse club, drug store, convenience store, and military chan-nels. BBF handles sales to Walmart and to deep discount chains, such as Dollar General and Family Dollar. BBF and its broker collaborate on brand planning, volume forecasting, trade spending, and joint sales calls. The broker handles day-to-day in-store execution of pricing actions, promotions, and merchandizing.
As Bob Alvarez settled into his position, he quickly realized that BBF could not provide the quality of business information and
analy-ses he was accustomed to seeing at his former employer—at least not
their business challenges and BI gaps. His people identified the following gaps:
• due to business information gaps and inconsistencies, BBF’s sales
teams and business development teams lacked timely, automated access to key performance measures to help them understand sales per-formance in relation to brand volume plans, and help them determine what actions to take to address any unfavorable performance trends;
• the current processes for trying to obtain needed business
informa-tion involved extensive hunting for data and reformatting for vari-ous analytical purposes, and while this was viewed as suboptimal, getting the optimal information from the information technology (IT) department was so hard they has stopped asking and had adapted to suboptimal conditions;
• due to business information gaps, the sales teams and business
development teams lacked historical performance information that would have enabled them to analyze and model the relationships between product demand and various marketing mixes, that is, price, trade promotions, consumer promotions, and merchandizing;
• due to business information gaps and overreliance on the
spread-sheets described above, the sales teams and business development
teams were not able to leverage dashboards to “manage by
excep-tion” and quickly focus in on the performance variances that were
the most important and had the greatest financial impact—it was
too hard to separate the wheat from the chaff;
• due to business information gaps, and because the sales, business
development, and finance departments lacked a common set of busi-ness facts, figures, and terminology, it was very difficult to manage product profitability, that is, timely and accurate product-level profit measurement was very difficult to deliver for the nearly 1000 SKUs, and thus it was hard to determine the impact of varying the marketing mix on product profitability;
• while many in the industry were talking about supply chain
collabo-ration between retailers and manufacturers, BBF business
develop-ment teams lacked consistent access to its customers’ Point-of-Sale
data and inventory levels, which made it difficult to get a true pic-ture of demand for each of the nearly 1000 SKUs;
• due to departmental boundaries and business information gaps and
inconsistencies, the business development teams lacked a timely, automated way to determine the return-on-investment on the
40,0001 promotional campaigns BBF executed every year, which
• due to business information gaps, the business development teams lacked a timely and efficient way to measure, manage, and
improve in-store execution of trade promotions by BBF’s broker
and the fields sales teams, and to measure incremental volume and lift; and
• due to business information gaps, it was very laborious to measure
and track trends for key performance indicators (KPIs), such as cost per incremental case, cost per shipped case, cost per consumed case, merchandizing efficiency, ROI, share-of-market, distribution points.
As Alvarez looked at the list of gaps, he was impressed that his sales teams and business development teams were able to perform as well as they were. At the same time, he wondered how much revenue and profit was being left on the table due to all of the fundamental
gaps in BI and analytics—and it occurred to him that without better
BI and analytics it would be nearly impossible to figure that out.
•••
Questions to Consider:1. Assuming that BBF will invest in creating a Sales and Business Development Dashboard, how might the dashboard be designed to help the CSO and his direct report manage by exception?
2. What might be the key ways to look at performance variances? 3. With nearly 1000 SKUs distributed through eight major channels to
customers who might operate more than 1000 stores across the United States, how could a Sales and Business Development Dashboard be designed to“conquer complexity”?
4. To what degree might the Brand Management Dashboard and the Sales and Business Development Dashboard overlap in the business information and analyses to be presented?
5. For Sales and Business Development, is it more important to have a dashboard or to have other forms of BI, such as advanced analytics, predictive analytics, alerts, reports, or multidimensional analyses?
1.2.5 The Chief Financial Officer’s View of Business
Challenges and BIOs
first major initiatives was reducing IT and operating costs, which pro-vided him with a deep understanding of how the company worked day in and day out and allowed him to contribute to meaningful improve-ments in profitability.
The scope of Steve’s responsibilities made him both a producer and
a consumer of BI and analytics. On the producer side, he was counting
on the CIO—one of his direct reports—to lead the charge in
formulat-ing the Enterprise BI Strategy. As CFO, Hayes had a lot on his plate, including a directive from the Board to shift the mix within the $900 million advertising and promotion budget toward a more balanced allocation between trade promotion spending and consumer advertis-ing and promotion. At the same time, he was concerned because his CIO was more of an operations professional and less so an IT
strate-gist/technologist or BI visionary. The CIO’s strong background in
operations had been extremely useful during Steve’s early effort to
reduce supply chain and operations costs. That background had also been useful because BBF managed IT as a cost to be minimized rather than as a profit enabler.
As a consumer of BI and analytics, Hayes knew there were
big gaps at BBF, and he was concerned about the CIO’s ability
to successfully close the gaps and meet his needs and those of his
peers on the Executive Team. On the other hand, with BBF’s
yet-to-be-announced acquisition of a well-known maker of packaged food products about to be announced, and with all the postmerger integration work to be done, Hayes felt he had bigger fish to fry than pushing ahead with BI and analytics. Even so, he had his direct reports meet with the enterprise BI strategy team and lay out the business challenges and BI opportunities. His people identified the following gaps:
• due to business information gaps and processing inefficiencies, the
plant controllers reported that it was difficult for plant managers to
manage the various drivers of plant profitability—including such
variables as production costs, batch yields, and equipment
effective-ness—in relation to forecasted and actual order volumes and mixes;
• due to information gaps, plant managers and plant controllers lack
• due to information gaps, plant managers and plant controllers lack standard automated variances analyses in relation to operating bud-gets, quarterly budget updates, and standard costs;
• due to information gaps and processing inefficiencies, senior
finan-cial planning and analysis professionals were handcuffed in their ability to dynamically measure, manage, and improve the financial
performance of BBF’s supply chain and production operations—the
monthly cost-of-goods sold report consisted of 501 pages of
spreadsheets that was hard to produce, delivered more information than could be usefully consumed, and provided no ability to manage by exception; and
• due to information gaps and processing inefficiencies, senior
finan-cial planning and analysis professionals were handcuffed in their ability to dynamically support marketing, sales, and business devel-opment teams with SKU-level and customer-level P&L statement and variance analyses in relation to annual operating plans, brand plans, and quarterly updates.
As Steve Hayes reviewed these gaps he knew there were others, but the list did a good job of reflecting the fact that BBF lacked ready, efficient access to vital cost and financial information about the guts of the business. Manufacturing, supply chain, and sales and marketing expenses were a huge portion of the company P&L and BBF needed to improve and optimize those expenses in order to meet Board profit expectations.
•••
Questions to Consider:1. How can Hayes balance the need for better BI and analytics across BBF with the demands of postmerger integration and the fact that the CIO is not a BI visionary or IT strategist?
2. In the role of producer of BI and analytics for BBF (through the CIO), how might Hayes think about priorities between his own needs as a consumer and the needs of his peers on the Executive Team? What factors should be considered when setting priorities?
3. Is there a systematic way to evaluate which business requirements for BI and analytics are common among the various BBF business units?
1.2.6 The CIO’s View of Business Challenges and BIOs
Ralph Milan was a key player in BBF’s strategic objective—Create BI
Scorecards. His background in supply chain systems, enterprise opera-tions planning, project management, and information systems had allowed him to make important early contributions to improvements
in BBF’s supply chain and operations performance. Further, he had a
prior 4-year working relationship with his boss, Steve Hayes (the CFO), and they were philosophically aligned with the idea of manag-ing IT as a cost. Like most of BBF, the IT department ran lean, and Milan ran his 70-person department without the benefit of an adminis-trative assistant.
BBF’s primary foray into BI and analytics was embodied by a
10-year old marketing data warehouse (MDW), which had been developed and delivered by a prominent public accounting firm. The
information in MDW was pulled from BBF’s enterprise resource
planning (ERP) system and from its trade promotions management system, a nightly process that took over 8 hours due to flaws in the original design and approach to refreshing the MDW. The information in MDW was a key input to a large number of reports generated by
BBF business units using outdated BI tools—reports that provided raw
data to business users across BBF for the various manually intensive, department-specific monthly reports prepared in standard spreadsheet templates. Milan was aware that BBF was falling behind in its use of modern BI and analytics, and thus he launched the 3-month Enterprise BI Strategy project. The project produced a number of key deliver-ables, including an assessment that identified the following technical gaps and challenges:
• reports take a long time to run;
• a typical data usage scenario is that business users pull data from
the data warehouse into the BI tool, cut and paste data from a BI report into a spreadsheet, combine data from multiple reports and spreadsheets into a single spreadsheet for formatting and calcula-tions, and then cut and paste information from spreadsheets into PowerPoint presentations;
• business users want dashboards and reports where they can use
pick-lists to specify and filter what information is to be presented;
• business users want prestaged information about key performance
• business users want to leverage alerts and management by exception;
• business users want to leverage automated variance analyses; and
• business users want to have standardized, automated P&L
state-ments and associated drill-downs.
As Milan looked the list, it seemed to him that many of the business
users’ wishes could be met by upgrading to a modern BI tool that
enabled user self-service. He knew there were power users in the key department, and he believed that if they were armed with a better BI tool that they could create BI dashboards for their purposes. While not an official member of the Executive Team, Milan also knew that a major acquisition was about to be announced, and he had been through a postmerger integration before. He wondered if the business community would engage as needed to develop BI dashboards. With these considerations in mind, Milan approved an acquisition of a mod-ern BI tool and then decided to sit back and gage business interest in BI Scorecards before pushing ahead.
•••
Questions to Consider:1. Is it likely that deployment of a new BI tool will enable BBF to over-come the business challenges and capitalize on the BI opportunities described in the CEO, COO, CMO, CSO, and CFO sections of this chapter?
2. Based on the information presented, what do you believe is likely to happen at BBF with respect to the strategic objective—Create Business Intelligence Dashboards?
3. How important does BI appear to be in the food manufacturing industry?
4. If BI is important, how might the CIO proceed to create BI dashboards?
1.3 THE BBF BI VISION AND BI OPPORTUNITY PORTFOLIO & BUSINESS CASE
described a desired future state for BI and analytics at BBF. The BI Opportunity Portfolio & Business Case described key business-driven opportunities to leverage BI and analytics and the value proposition for doing so. Highlights from these BI Strategy documents are pro-vided below.
1.3.1 The BBF BI Vision
The BBF BI vision is intended to describe a general direction for how BI will be leveraged to improve business performance. Specific BIOs and projects will be described in Section 7.3.2.
1. Automate and improve information-intensive aspects of recurring business planning, performance management, variance analysis, root cause analysis, and corrective action planning. Current pro-cesses are inefficient, error-prone, inflexible, and suboptimal for managing the complexities of our business.
2. Automate and accelerate timely generation of enterprise and business-unit dashboards and KPIs to focus our attention on key customers and channels that drive our desired results, measure our performance against established KPI targets, and leverage manage-ment by exception strategies. Our current manually intensive perfor-mance reporting processes are slow and expensive.
3. Automate trade promotion effectiveness analysis in order to cope with the volume of trade promotions being executed and enable a surgical approach to shifting trade support to consumer advertising
and marketing. There is a “huge opportunity” to leverage BI for
promotion level analysis and scenario planning in relation to spe-cific situations, brands, and customers so that our substantial investment in trade support achieves optimal results.
4. Deliver standardized and comprehensive historical business infor-mation/facts as inputs for the various enterprise plans and budgets and for short-interval control. Having ready access to transactional details and relevant summaries of gross revenues, shipments, con-sumption, market share, trade spending, net sales, production volumes and yields, inventory levels and ages, costs of products manufactured/sold, operating expenses, and other operational and financial information would enable efficient and effective planning and control.
profitability and performance by customer, segment, category, brand, product, SKU, plant, and channel. Managing profitability at granular levels, for example, by customer, would enable us to be more proactive in managing the business situations, relationships, and processes that have a substantial impact on sales, costs, service, and profits.
6. Deliver business information and business analytics in ways that match the usage preferences and styles of the various constituencies in the business community. Our business professionals report a range of usage preferences, including standard reports, ad hoc access to large data sets, slice-and-dice and drill down/across (OLAP), scorecards and dashboards, and predictive analytics. In general, most users want simple, easy-to-use screens that allow
them to specify variables of interest and “as-of” dates on reports
and analyses that run quickly.
7. Renovate the current data warehousing and reporting processes to mitigate or eliminate performance problems with the current envi-ronment. Many reports take far too long to run, and in some case the reports are not available in a timely fashion, which drives the need for workarounds and hampers business performance in cases where more timely information makes a difference.
When the BBF BI Vision is fully realized:
• If they so choose, BBF executives will be able to easily monitor
enterprise and functional performance via scorecards, dashboards, and exceptions-based alerts presented on their desktops and/or lap-tops. They will also have the option to drill down on any KPI of interest, to see such information as customer, brand, segment, prod-uct, and plant performance and P&Ls, and to monitor leading indi-cators, such as brand equity, distribution, and pricing. For executives who are not as hands-on with computers, all this informa-tion will be staged so that it can easily be delivered by static reports.
• Directors and managers will have role-based access to the same
• Customer-facing and market-facing professionals will have complete views of customers, categories, brands, trade spending, and products so that they can more effectively manage key relationships and pro-grams and achieve brand marketing and sales plans, including vol-ume objectives, price points, and distribution objectives.
• Power users and analysts in all areas of the company will have access
to prestaged business information (cubes) so they can write their own ad hoc queries and so they can perform true OLAP analyses. These users will be able to easily access time series data for user-specified periods of interest, to access data for planning, budgeting, and fore-casting purposes, to access data for deep-dive variance analyses, for modeling scenarios, and many other data-intensive analyses.
To achieve this broad vision, we have defined specific BIOs that can be prioritized and sequentially delivered. These are discussed below.
1.3.2 The BBF BIO Portfolio
The BIOs that BBF professionals identified are discussed and defined below.
1. Enterprise Performance Scorecards and Dashboards.
This BIO would implement custom-designed scorecards, dash-boards, and exception reporting to compare planned versus actual performance in financial and operational terms for key dimensions of business performance, including performance with customers and by brands, plants, carriers, distribution centers, and so forth.
2. Revenue Management Analytics.
This BIO would integrate and deliver timely, granular information about revenues, shipments, volume, prices, consumption, share,
margin, inventory, and net sales—which is essential for enterprise
demand planning, brand planning, customer service analysis, cate-gory analysis, price and promotion optimization, budgeting, finan-cial analysis, and variance analysis. This BIO will help drive revenue growth and help to effectively manage revenue attainment on a customer-by-customer basis across all channels of distribution. 3. Trade Promotion Analytics.
whose performance has been proven. There is a huge opportunity to more effectively allocate the $900 million in trade support investments by leveraging BI to automate the postpromotion analysis process and view promotions by customer and type. This will allow us to accu-rately judge trade promotion effectiveness, profit, lift, and ROI by customer, brand, product, channel, and other relevant dimensions. 4. Inventory Management Analytics.
This BIO would integrate and deliver timely and granular inventory information for supply planning, customer service, and inventory optimization purposes. It would also enable adoption of customer
service and inventory optimization techniques that would
allow BBF to differentiate its service to the top customers who drive the preponderance of its revenue and profits, assuming that suitable process changes are also adopted. Further, it would also provide inventory availability information for comparison to pro-jected demand to better avoid or manage stockouts.
5. Cost and Financial Analytics.
This BIO would enable deeper understanding of the operational
dri-vers of BBF’s costs so they can be actively managed and optimized.
Further, it would stage cost and financial information for planning, budgeting, cost estimating, establishing standard costs, cost analy-sis, variance analyanaly-sis, financial modeling, and other financial
man-agement purposes—all tools that are needed to more tightly and
cost-effectively control productivity, profit and free cash flow. 6. Supply Chain and Operations Analytics.
This BIO would integrate fundamental operating information from our ERP, logistics, human resources, timekeeping, process control, and factory execution systems to provide a comprehensive,
end-to-end picture of BBF’s supply chain and operations performance and
productivity. The information and analytics delivered would be used to improve supply planning, vendor negotiations, capacity planning, warehousing and transportation performance, productiv-ity, plant and copacker performance, and customer service.
7. Enterprise Planning and Budgeting.
This BIO would provide standard historical information for planning and budgeting, automate sales and operations planning processes and exception reporting, and automate conversion of operating plans expressed in case volumes to financial plans expressed in dollars.
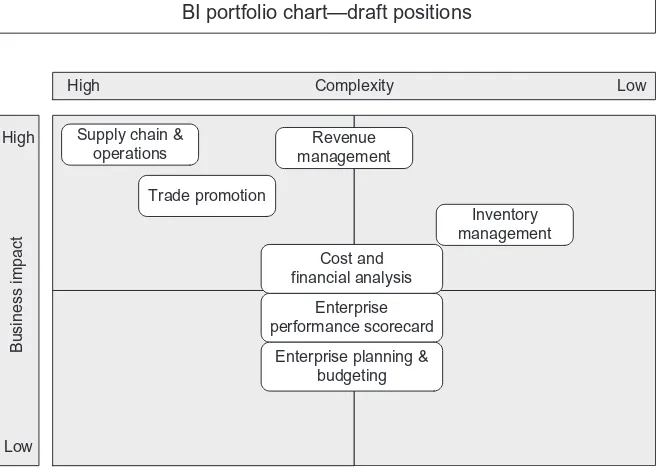
The prioritized BIOs, illustrated by Fig. 1.1, were used to drive a
In the next subsection, we will highlight how the BIOs identified at BBF may also be applicable for other manufacturers outside of the food manufacturing industry.
1.4 GENERALIZING FROM THE BBF CASE—BI APPLICATIONS
FOR MANUFACTURERS
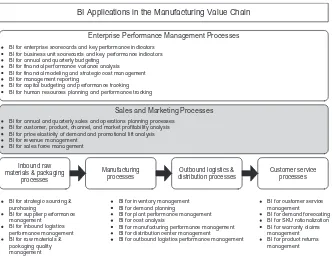
The BBF case provides useful examples of how BI can be leveraged by manufacturers to increase revenues, reduce costs, or both. BI can be the heart of an enterprise performance management system, and the business information and analyses BI delivers can be used to drive
operational improvements in key value chain processes—improvements
that result in positive financial results. A high-level “menu” of BI
applications for manufacturers is shown inFig. 1.2.
We used the term“menu” to indicate that there are a lot of possible
BIOs for any manufacturing company, and the choice of what is important is influenced by the actual industry and how the company competes. For a packaged food company like BBF, trade promotional spending is a large percentage of revenues and thus obtaining
BI portfolio chart—draft positions
Business impact
High
Low
Supply chain & operations
Inventory management
Enterprise planning & budgeting Trade promotion
Revenue management
Cost and financial analysis
Enterprise performance scorecard
Complexity Low
High
suitable lift from the 40,0001 campaigns they run every year is impor-tant to manage, and BI is critical for that purpose. For consumer elec-tronics companies, the product lifecycle is extremely short, so it is critical to get new products out into the retail channels quickly. That
makes BI for the function that is called“sales operations” essential for
managing inventory levels, distribution, and product returns. Since
consumer electronics companies typically outsource product
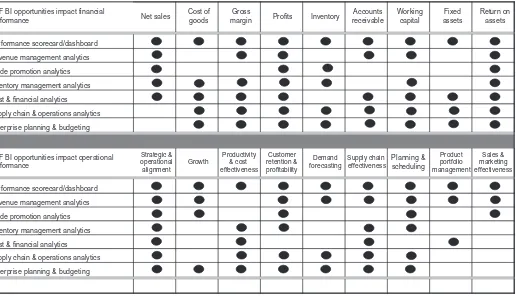
manufacturing, BI about manufacturing performance might be less important due to lack of direct control of that function. In contrast, companies who manufacture military equipment are required to report very specific and comprehensive manufacturing performance informa-tion, so BI about cost, schedule, and technical performance is essential. These are but a few examples of how the industry in which a manufac-turer competes and its business model influence BIOs and priorities. In general though, BI can influence financial and operational
perfor-mance as shown in Fig. 1.3 below—using the BBF BIOs for
illustra-tion purposes.
BI Applications in the Manufacturing Value Chain
Inbound raw
BI for strategic sourcing & purchasing
BI for supplier performance management
BI for inbound logistics performance management BI for raw materials & packaging quality management
BI for inventory management BI for demand planning
BI for plant performance management BI for cost analysis
BI for manufacturing performance management BI for distribution center management BI for outbound logistics performance management
BI for customer service management BI for demand forecasting BI for SKU rationalization BI for warranty claims management BI for product returns management
Sales and Marketing Processes
BI for annual and quarterly sales and operations planning processes BI for customer, product, channel, and market profitability analysis BI for price elasticity of demand and promotional lift analysis BI for revenue management
BI for sales force management
Enterprise Performance Management Processes
BI for enterprise scorecards and key performance indicators BI for business unit scorecards and key performance indicators BI for annual and quarterly budgeting
BI for financial performance variance analysis BI for financial modeling and strategic cost management BI for management reporting
BI for capital budgeting and performance tracking BI for human resources planning and performance tracking
Performance scorecard/dashboard
Revenue management analytics
Trade promotion analytics
Inventory management analytics
Cost & financial analytics Supply chain & operations analytics
Enterprise planning & budgeting
Performance scorecard/dashboard Revenue management analytics
Trade promotion analytics
Inventory management analytics
Cost & financial analytics
Supply chain & operations analytics Enterprise planning & budgeting
Supply chain effectiveness
Planning & scheduling
Product portfolio management
Sales & marketing effectiveness Demand
forecasting
BBF BI opportunities impact operational performance
Strategic & operational alignment
Growth
Productivity & cost effectiveness
Customer retention & profitability
Ultimately, BI and analytics are about increasing revenues, optimiz-ing costs, and thereby improvoptimiz-ing profits. A simple way for manufac-turers to start homing in on where their most important BIOs might lie is to look at the cost drivers for the expenditures that are the largest proportion of operating income, and to look at the performance of the business processes that have the greatest impact on customer
satisfac-tion. The menu provided by Fig. 1.2 is a useful way to start. In the
following section, we’ll revisit BBF and use the case to illustrate some
of the strategic barriers to BI success.
1.5 LESSONS LEARNED FOR BI STRATEGY—BBF BI PROGRESS
At the time of the case, BBF was on the verge of a $1 billion plus acquisition, which went through just as the enterprise BI Strategy project was wrapping up. As might be expected, postmerger
integra-tion activities consumed much of the bandwidth of BBF’s key
busi-ness leaders and managers for over a year. Additionally, pressure
for profits coming from private equity backers certainly didn’t
abate, and thus the Executive Team kept a clear focus on blocking
and tackling—particularly in sales, marketing, and manufacturing
cost improvement. As a lean company, BBF’s top executives
and their direct reports were spread very thin. As a Senior Vice
President (SVP) in financial management put it, “I’m assigned to
three business improvement projects, and on each I’m supposed
to be half time. I do my regular work on Sundays, and I’m not
doing any of these well.” As a result of these factors, for a couple of
years BBF made almost no meaningful progress on realizing the BI Vision and capitalizing on the BIOs identified by the enterprise BI strategy team.
As the executive team emerged from the rigors of postmerger inte-gration, there started to be rumbles at the SVP and VP level about needing better information and analyses in order to meet profit expec-tations. Recognizing the need for action and his own lack of experience in the BI arena, a Director of BI Strategy was hired. In this newly cre-ated role, Carol Penner was charged with the strategic objective
“Create Business Intelligence Scorecards”—the same objective that