Analytics
Finding Security Insights, Patterns, and
Anomalies in Big Data
Mark Ryan M. Talabis
Robert McPherson
I. Miyamoto
Jason L. Martin
D. Kaye, Technical Editor
Amsterdam • Boston • Heidelberg • London New York • Oxford • Paris • San Diego San Francisco • Singapore • Sydney • Tokyo
Designer: Matthew Limbert
Syngress is an imprint of Elsevier
225 Wyman Street, Waltham, MA 02451, USA
Copyright © 2015 Elsevier Inc. All rights reserved.
No part of this publication may be reproduced or transmitted in any form or by any means, electronic or mechanical, including photocopying, recording, or any information storage and retrieval system, without permission in writing from the publisher. Details on how to seek permission, further information about the Publisher’s permissions policies and our arrangements with organizations such as the Copyright Clearance Center and the Copyright Licensing Agency, can be found at our website: www.elsevier.com/permissions.
This book and the individual contributions contained in it are protected under copyright by the Publisher (other than as may be noted herein).
Notices
Knowledge and best practice in this field are constantly changing. As new research and experience broaden our understanding, changes in research methods, professional practices, or medical treatment may become necessary.
Practitioners and researchers must always rely on their own experience and knowledge in evaluating and using any information, methods, compounds, or experiments described herein. In using such information or methods they should be mindful of their own safety and the safety of others, including parties for whom they have a professional responsibility.
To the fullest extent of the law, neither the Publisher nor the authors, contributors, or editors, assume any liability for any injury and/or damage to persons or property as a matter of products liability, negligence or otherwise, or from any use or operation of any methods, products, instructions, or ideas contained in the material herein.
ISBN: 978-0-12-800207-0
British Library Cataloguing in Publication Data
A catalogue record for this book is available from the British Library
Library of Congress Cataloging-in-Publication Data
A catalogue record for this book is available from the Library of Congress
This book is dedicated to Joanne Robles, Gilbert Talabis, Hedy
Talabis, Iquit Talabis, and Herbert Talabis.
Ryan
I would like to dedicate this book to my wife, Sandy, and to my
sons, Scott, Chris, Jon, and Sean. Without their support and
encouragement, I could not have taken on this project. I owe
my dog, Lucky, a debt of gratitude as well. He knew just when
to tell me I needed a hug break, by putting his nose under my
hands, and lifting them off the keyboard.
Robert
This book is dedicated to my friends, my family, my mentor,
and all the dedicated security professionals, who tirelessly
work to secure our systems.
xi
The information security field is a challenging one accompanied with many unsolved problems and numerous debates on solving such problems. In con-trast to other fields such as physics, astronomy and similar sciences this one hasn’t had a chance to be succumbed to scrupulous theoretical reviews before we find these problems dramatically affecting the world we live in. The Internet is the proving grounds for security research and it’s a constant battle to stay appropriately defended against the offensive research that is conducted on this living virtual organism. There are a lot of industry hype out there convoluting the true tradecraft of information security, and more specifically in regards to “analytics” and “Big Data” and then this book hits the shelves essentially in an effort to truly enlighten the audience on what the genuine value is gained when applying data science to enhance your security research. This informative tome is not meant to be quickly read and understood by the average audience, but instead this book rightfully deserves the audience of researchers and secu-rity practitioners dedicated to their work and who seek to apply it in a practical and preemptive way to apply data science to solve increasingly difficult infor-mation security problems.
Talabis, McPherson, Miyamoto, and Martin are the perfect blend together and they deliver such fascinating knowledge throughout this book, demonstrating the applicability of analytics to all sorts of problems that affect businesses and organizations across the globe. I remember in 2010 when I was working at Damballa that data science, machine learning, statistics, correlations, and anal-ysis were all being explored in our research department. It was exciting times – the R Language was getting popular around then and a hint of a new chapter for information security was about to begin. Well it did… but a lot of marketing buzzwords also got pushed through and so now we have “Security Analytics” and “Big Data” and “Threat Intelligence” and of course… “Cyber” with no real meanings to anyone … until now.
into solving these problems by dedication to the pure research aspects of the information security field. This is much better than what we have been doing these days with reliance upon just operational answers such as SIEM, Threat Feeds and basic correlation and analysis. My job involves Cyber Counterin-telligence research work with the number one big four consulting firm in the world and the value of data science and pure security research is just being tapped into and recognized, but with this book on our shelf I have no doubt the knowledge offered within these chapters will take my team and the firm as a whole to another level.
I leave you with that and it is with great honor that I say… Sincerely, enjoy the book!
xiii
Mark Ryan M. Talabis is the Chief Threat Scientist of Zvelo Inc. Previously, he was the Director of the Cloud Business Unit of FireEye Inc. He was also the Lead Researcher and VP of Secure DNA and was an Information Technol-ogy Consultant for the Office of Regional Economic Integration (OREI) of the Asian Development Bank (ADB).
He is coauthor of the book Information Security Risk Assessment Toolkit: Prac-tical Assessments through Data Collection and Data Analysis from Syngress. He has presented in various security and academic conferences and organiza-tions around the world, including Blackhat, Defcon, Shakacon, INFORMS, INFRAGARD, ISSA, and ISACA. He has a number of published papers to his name in various peer-reviewed journals and is also an alumni member of the Honeynet Project.
He has a Master of Liberal Arts Degree (ALM) in Extension Studies (conc. Information Management) from Harvard University and a Master of Science (MS) degree in Information Technology from Ateneo de Manila University. He holds several certifications, including Certified Information Systems Security Professional (CISSP), Certified Information Systems Auditor (CISA), and Cer-tified in Risk and Information Systems Control (CRISC).
Robert McPherson leads a team of data scientists for a Fortune 100 Insurance and Financial Service company in the United States. He has 14 years of expe-rience as a leader of research and analytics teams, specializing in predictive modeling, simulations, econometric analysis, and applied statistics. Robert works with a team of researchers who utilize simulation and big data methods to model the impact of catastrophes on millions of insurance policies…
analysis, and design competitor war game simulations. Robert has a master’s degree in Information Management from the Harvard University Extension.
I. Miyamoto is a computer investigator in a government agency with over 16 years of computer investigative and forensics experience, and 12 years of intelligence analysis experience. I. Miyamoto is in the process of completing a PhD in Systems Engineering and possesses the following degrees: BS in Soft-ware Engineering, MA in National Security and Strategic Studies, MS in Strate-gic Intelligence, and EdD in Education.
xv
First and foremost, I would like to thank my coauthors, Robert McPherson and I. Miyamoto for all their support before, during, and after the writing of this book. I would like to thank my boss and friend, Jason Martin, for all his guid-ance and wisdom. I would also like to thank Howard VandeVaarst for all his support and encouragement. Finally, a special thanks to all the guys in Zvelo for welcoming me into their family. Mahalo.
Ryan
I would like to thank Ryan Talabis for inviting me to participate in this project, while at a pizza party at Harvard University. I would like to thank I. Miyamoto for keeping me on track, and offering valuable feedback. Also, I found the tech-nical expertise and editing advice of Pavan Kristipati, and D. Kaye to be very helpful, and I am very grateful to them for their assistance.
Robert
I owe great thanks to Ryan and Bob for their unconditional support and for providing me with the opportunity to participate in this project. Spe-cial thanks should be given to our technical reviewer who “went above and beyond” to assist us in improving our work, and the Elsevier Team for their support and patience.
I. Miyamoto
Information Security Analytics. http://dx.doi.org/10.1016/B978-0-12-800207-0.00001-0 Copyright © 2015 Elsevier Inc. All rights reserved.
1
INTRODUCTION TO SECURITY ANALYTICS
The topic of analysis is very broad, as it can include practically any means of gaining insight from data. Even simply looking at data to gain a high-level understanding of it is a form of analysis. When we refer to analytics in this book, however, we are generally implying the use of methods, tools, or algo-rithms beyond merely looking at the data. While an analyst should always look at the data as a first step, analytics generally involves more than this. The number of analytical methods that can be applied to data is quite broad: they include all types of data visualization tools, statistical algorithms, querying tools, spreadsheet software, special purpose software, and much more. As you can see, the methods are quite broad, so we cannot possibly cover them all.
For the purposes of this book, we will focus on the methods that are particularly useful for discovering security breaches and attacks, which can be implemented with either for free or using commonly available software. Since attackers are con-stantly creating new methods to attack and compromise systems, security analysts need a multitude of tools to creatively address this problem. Among tools avail-able, we will examine analytical programming languages that enable analysts to create custom analytical procedures and applications. The concepts in this chap-ter introduce the frameworks useful for security analysis, along with methods and tools that will be covered in greater detail in the remainder of the book.
n Introduction to Security Analytics n Analytics Techniques
n Data and Big Data
n Analytics in Everyday Life
n Analytics in Security n Security Analytics Process
INFORMATION IN THIS CHAPTER:
CONCEPTS AND TECHNIQUES IN ANALYTICS
Analytics integrates concepts and techniques from many different fields, such as statistics, computer science, visualization, and research operations. Any concept or technique allowing you to identify patterns and insights from data could be considered analytics, so the breadth of this field is quite extensive. In this section, high-level descriptions of some of the concepts and techniques you will encoun-ter in this book will be covered. We will provide more detailed descriptions in subsequent chapters with the security scenarios.
General Statistics
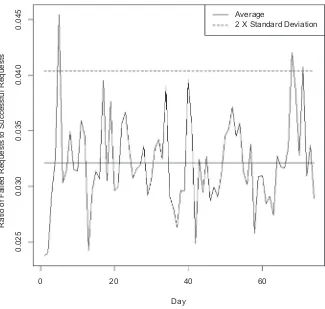
Even simple statistical techniques are helpful in providing insights about data. For example, statistical techniques such as extreme values, mean, median, standard deviations, interquartile ranges, and distance formulas are useful in exploring, summarizing, and visualizing data. These techniques, though rela-tively simple, are a good starting point for exploratory data analysis. They are useful in uncovering interesting trends, outliers, and patterns in the data. After identifying areas of interest, you can further explore the data using advanced techniques.
We wrote this book with the assumption that the reader had a solid understand-ing of general statistics. A search on the Internet for “statistical techniques” or “statistics analysis” will provide you many resources to refresh your skills. In Chapter 4, we will use some of these general statistical techniques.
Machine Learning
Machine learning is a branch of artificial intelligence dealing with using vari-ous algorithms to learn from data. “Learning” in this concept could be applied to being able to predict or classify data based on previous data. For example, in network security, machine learning is used to assist with classifying email as a legitimate or spam. In Chapters 3 and 6, we will cover techniques related to both Supervised Learning and Unsupervised Learning.
Supervised Learning
Supervised learning provides you with a powerful tool to classify and process data using machine language. With supervised learning you use labeled data, which is a data set that has been classified, to infer a learning algorithm. The data set is used as the basis for predicting the classification of other unlabeled data through the use of machine learning algorithms. In Chapter 5, we will be covering two important techniques in supervised learning:
n Linear Regression, and
Linear Regression
Linear regression is a supervised learning technique typically used in predict-ing, forecastpredict-ing, and finding relationships between quantitative data. It is one of the earliest learning techniques, which is still widely used. For example, this technique can be applied to examine if there was a relationship between a company’s advertising budget and its sales. You could also use it to deter-mine if there is a linear relationship between a particular radiation therapy and tumor sizes.
Classification Techniques
The classification techniques that will be discussed in this section are those focused on predicting a qualitative response by analyzing data and recognizing patterns. For example, this type of technique is used to classify whether or not a credit card transaction is fraudulent. There are many different classification techniques or classifiers, but some of the widely used ones include:
n Logistic regression,
n Linear discriminant analysis,
n K-nearest neighbors,
n Trees,
n Neural Networks, and
n Support Vector Machines.
Unsupervised Learning
Unsupervised learning is the opposite of supervised learning, where unlabeled data is used because a training set does not exist. None of the data can be pre-sorted or preclassified beforehand, so the machine learning algorithm is more complex and the processing is time intensive. With unsupervised learning, the machine learning algorithm classifies a data set by discovering a structure through common elements in the data. Two popular unsupervised learning techniques are Clustering and Principal Components Analysis. In Chapter 6, we will demonstrate the Clustering technique.
Clustering
Clustering or cluster analysis is a type of Unsupervised Learning technique used to find commonalities between data elements that are otherwise unlabeled and uncategorized. The goal of clustering is to find distinct groups or “clusters” within a data set. Using a machine language algorithm, the tool creates groups where items in a similar group will, in general, have similar characteristics to each other. A few of the popular clustering techniques include:
n K-Means Clustering, and
Principal Components Analysis
Principal components analysis is an Unsupervised Learning technique sum-marizing a large set of variables and reducing it into a smaller representative variables, called “principal components.” The objective of this type of analy-sis is to identify patterns in data and express their similarities and differences through their correlations.
Simulations
A computer simulation (or “sim”) is an attempt to model a real-life or hypo-thetical situation on a computer so that it can be studied to see how the sys-tem works. Simulations can be used for optimization and “what if” analysis to study various scenarios. There are two types of simulations:
n System Dynamics
n Discrete Event Simulations
In Chapter 4, we will be dealing specifically with Discrete Event Simulations, which simulates an operation as a discrete sequence of events in time.
Text Mining
Text mining is based on a variety of advance techniques stemming from sta-tistics, machine learning and linguistics. Text mining utilizes interdisciplinary techniques to find patterns and trends in “unstructured data,” and is more commonly attributed but not limited to textual information. The goal of text mining is to be able to process large textual data to extract “high quality” infor-mation, which will be helpful for providing insights into the specific scenario to which the text mining is being applied. Text mining has a large number of uses to include text clustering, concept extraction, sentiment analysis, and summarization. We will be covering text mining techniques in Chapter 6.
Knowledge Engineering
Knowledge engineering is the discipline of integrating human knowledge and/or decision making into computer systems. Typically, these are used to recreate abil-ities and decision-making process to allow computer systems to solve complex problems that otherwise would only be possible through human expertise. It is widely used in expert systems, artificial intelligence, and decision support systems. We touch upon knowledge engineering techniques in Chapter 3.
DATA FOR SECURITY ANALYTICS
networks. For example, each server software package produces its own log file format. Additionally, these formats can generally be customized by users, which adds to the difficulty of building standard software tools for analyzing the data.
Another factor further complicating the analysis is that log files and other source data are usually produced in plain text format, rather than being orga-nized into tables or columns. This can make it difficult or even impossible to import the data directly into familiar analytical tools, such as Microsoft Excel.
Additionally, security-related data is increasingly becoming too large to ana-lyze with standard tools and methods. Large organizations may have multiple large data centers with an ever-growing collection of servers that are together by sprawling networks. All of this generates a huge volume of log files, which takes us into the realm of Big Data.
Big Data
Over the years, businesses have increased the amount of data they collect. They are now at the point where maintaining large data repositories is part of their business model—which is where the buzzword phrase “big data” emerges.
In some industries, increases in government regulation caused business to col-lect more data, while in other industries shifts in business practices (online environment or the use of new technologies) enabled businesses to accumu-late and store more data. However, much of the data the businesses acquired were unstructured and in many different formats, so it was difficult to convert this data into business intelligence for use in decision making. This all changed when data analytics entered into the picture.
One of the first uses of data analytics was to convert a customer’s clicks into business intelligence so that advertisements and products could be tailored to the customer. In this example, data analytics integrated traditional data collection with behavioral analysis (what customers browsed) and predictive analysis (suggestions of products or websites to influence a customer) so that businesses could increase sales and provide a better online experience. Early on, the financial sector also used data analytics to detect credit card fraud by examining a customer’s spending patterns and predicting fraudulent transac-tions based on anomalies and other algorithms.
industry with experts (data scientists), who are able to examine and configure the different types of data into usable business intelligence.
Many of the same analytical methods can be applied to security. These meth-ods can be used to uncover relationships within data produced by servers and networks to reveal intrusions, denial of service attacks, attempts to install mal-ware, or even fraudulent activity.
Security analysis can range from simple observation by querying or visualizing the data, to applying sophisticated artificial intelligence applications. It can involve the use of simple spreadsheets on small samples of data, to applying big data, parallel-computing technologies to store, process and analyze tera-bytes, or even petabytes of data.
In the chapters that follow, we hope to provide you with a foundation of security analytics, so that you can further explore other applications. We will include methods ranging from the simple to the complex, to meet the needs of a variety of analysts and organizations, both big and small.
Some analysis may only involve relatively small data sets, such as the instance in which a server has low traffic and only produces a single log file. However, data size can quickly increase, along with the computational power required for analysis when multiple servers are involved.
Two technologies, Hadoop and MapReduce, are being used in tandem to per-form analysis using parallel computing. Both are free, open source software, and are maintained by the Apache Foundation (“Welcome to The Apache Soft-ware Foundation!,” 2013).
Hadoop is a distributed file system that enables large data sets to be split up and stored on many different computers. The Hadoop software manages activities, such as linking the files together and maintaining fault tolerance, “behind-the-scenes.” MapReduce is a technology running on top of the Hadoop distrib-uted file system, and does the “heavy lifting” number crunching and data aggregations.
ANALYTICS IN EVERYDAY LIFE
Analytics in Security
The use of analytics is fairly widespread in our world today. From banking to retail, it exists in one form of the other. But what about security? Below are some examples of how analytics techniques used in other fields can be applied in the field of information security.
Analytics, Incident Response, and Intrusion Detection
Incident response is one of the core areas of a successful security program. Good incident response capabilities allow organizations to contain incidents, and erad-icate and recover from the effects of an incident to their information resources.
But to effectively eradicate and recover from a security incident, an incident responder needs to be able to identify the root cause of an incident. For example, let’s say your organization’s corporate website got hacked. The organization can simply restore the site using backups but without knowing the root cause, you would neither know the vulnerability causing the hack nor would you know what to fix so that the website does not get hacked again. You also might not know the full extent of the damage done, or what information may have been stolen.
How does an incident responder know what to fix? First, the responder has to be able to trace the activities attributed to the intruder. These can be found in various data sources such as logs, alerts, traffic captures, and attacker artifacts. In most cases, a responder will start off with logs, as they can help with finding activities that can be traced back to the intruder. By tracing the activities of the intruder, an incident responder is able to create a history of the attack, thereby detect and identify possible “points of entry” of the intrusion.
What are these logs and how do we obtain them? This really depends on the type of intrusion to which you are responding. For example, in web compromises an incident responder will typically look at web server logs, but remember that this is not always the case. Some attack vectors show up in completely different data sources, which is why reviewing different data sources is important.
So now, what has analytics got to do with incident response and intrusion detection? Analytics techniques can help us to solve incident response and intrusion detection challenges. Next, we will discuss how analytics is applica-ble to security.
Large and Diverse Data
same time period? The data an incident responder has to sift through would be immense—potentially millions of lines of log information!
This is where analytics and big data techniques come into play. Using big data techniques, an incident responder will be able to combine many data sources with different structures together. Once that is completed, analytics techniques such as fuzzy searches, outlier detection, and time aggregations can be utilized to “crunch” the data into more manageable data sets so responders can focus their investigations on a smaller, more relevant subset of the data.
Aside from logs, analytics techniques, such as text analysis, which can be used to mine information from unstructured data sources, may also be useful. For example, these techniques can be used to analyze security events from free-form text data such as service desk calls. This type of analysis could potentially provide insight into your organization, such as what are the common security problems, or even find security issues or incidents previously unknown.
Unknown Unknowns
A fairly common way to investigate or detect intrusions is by using signatures or patterns. This means that for each attack, an incident responder would try to find the attack by looking for patterns matching the attack. For example, for an SQL injection attack, an incident responder will probably look for SQL statements in the logs. Basically, the responder already knows what he/she is looking for or “Known Unknowns.” This approach usually works, it does not cover “Unknown Unknowns.”
Unknown Unknowns are attacks that the incident responder has no knowledge of. This could be a zero-day attack or just something that the incident responder, or the investigative tool being utilized, is unfamiliar with or does not address. Typically, signature-based approaches are weak in detecting these types of attacks. Finding Unknown Unknowns are more in the realm of anomaly detection. For example, finding unusual spikes in traffic or outliers by using cluster analysis are good examples of analytics techniques that could potentially find incidents, which would otherwise have been missed by traditional means. It also helps in focusing the investigation to relevant areas, especially if there is a lot of data to sift through.
Simulations and Security Processes
In this situation, an alternative approach is to use simulations. As stated in the previous section, simulations are computer models of real-life or hypo-thetical situations. Simulations are used to study how a system works. Think of how the military creates simulations for bombing raids. Simulations help the Air Force to make decisions as to how many planes should be used, to estimate potential losses, and to implement the raids in different scenarios or conditions. Simulations can be implemented in the same way for information security. It might not be as exciting as with military applications, but it can be a powerful tool to study information security scenarios and to help security professionals make informed decisions.
Try Before You Buy
The best way to explore the possibilities of simulations in security is through examples. For example, if a security analyst wanted to see the effect of a virus or malware infection in an organization, how would the security analyst go about doing this? Obviously, the simplest and most accurate solution is to infect the network with live malware! But, of course, we cannot do that. This is where simulations come in. By doing some creative computer modeling, you can potentially create a close approximation of how malware would spread in your organization’s information systems.
The same concept can be applied to other scenarios. You can model hacker attacks and couple them with vulnerability results to show their potential effect to your network. This is somewhat akin to creating a virtual simulated penetration test.
Simulation-Based Decisions
Aside from studying scenarios, simulations can be used to assist with making decisions based on the simulated scenarios. For example, perhaps you want to acquire technologies, such as data loss prevention and full disk encryption to prevent data loss. You could use simulations in this context to see the effect of a scenario before it actually happens. Subsequently, the impact of these scenar-ios can be leveraged to validate or reject your decision-making process.
Access Analytics
So, how does a security analyst identify these valid, yet unauthorized access attempts? While it is difficult to identify them with certainty, it is possible to identify events, which do not conform to the usual access behavior. This is very similar to how credit card providers identify unusual transactions based on previous spending behaviors. With user access, it is the exact same thing. Typically, users in an organization will have regular patterns of access-ing computer systems and anythaccess-ing outside that behavior can be flagged as anomalous.
One important area to which this technique can be applied is with virtual pri-vate network (VPN) access. Depending on a user profile, a VPN access allows for a remote connection to internal systems. If user credentials with high priv-ileges are compromised, then the attacker has a greater potential for gaining higher access and for causing greater damages. An important way to ensure this type of access is not abused is by performing an access review. For example, if a user account concurrently logs in from two different geographical locations, a red flag should be triggered. Another example would be to check for unusual access and timing patterns, such as multiple sign-in and sign-off in a short-time period or unusual short-time references (e.g., early morning hours cross-cor-related with the IP address’ time zone).
Reviewing this data is not trivial—even looking through a week of user access logs is a significant task. Besides, how do you efficiently correlate different access events? This is where analytics comes into play.
The Human Element
A lot of the logic to detect unusual access events are made just by using com-mon sense. But in some cases, detecting the anomalous event depends on a security analyst’s expertise and years of experience. For example, identifying the access behavior of an advanced persistent threat actor is highly specialized, thereby making it difficult for most analysts to find the time and resources to manually perform the analysis.
Categorization and Classification in Vulnerability Management
Vulnerabilities are the bane of any organization. Vulnerabilities are weaknesses or flaws that increases the risk of attackers being able to compromise an infor-mation system.Vulnerability Management, on the other hand, is the process to identify, clas-sify, remediate and mitigate vulnerabilities. This is one of the core security pro-cesses in any organization. But as many security professionals know, setting up the process may be easy but managing and obtaining value out of the process is another matter.
Currently, networks are getting larger and larger. Systems can now be deployed so easily that there are a lot more systems crammed in our network. With all the vulnerability scanners out there, we have a wealth of vulnerability data that we can work with.
But of course, this comes at a price, because the more data we collect, the more confusing the output becomes. It is common to see security professionals wad-ing through spreadsheets with hundreds of thousands of rows of vulnerability results. This can be overwhelming, and more often than not, the value of this data is often watered down because security professionals do not have the tools or techniques to effectively leverage this data to gain insights about their orga-nization’s vulnerabilities and risk.
Birds Eye View
A vulnerability scanner could spew out thousands and thousands of results. It is fairly easy to “drown” in the results by just going through them one by one. However, from a strategic and enterprise standpoint, it may not be the best way to manage vulnerabilities. By using analytics techniques such as clustering and visualization, organizations may be able to identify areas of “hot spots,” thereby utilize resources more effectively and address vulnerabilities more systematically.
Predicting Compromises
Another potentially interesting application in vulnerability management is to predict future compromises based on previous compromises. For example, if a web server was hacked and the cause was unknown, analytics techniques such as machine learning could be used to “profile” the compromised server and to check if there are other similar servers in your organizations that have the same profile. Servers with similar profiles would most likely be at risk of similar compromises and should be proactively protected.
Prioritization and Ranking
between other external data, such as exploit availability and the potential impact to the assets themselves. This is basic risk management in which tech-niques such as decision trees, text analysis and various correlation techtech-niques would help in combining all the data and in forming insights based on the correlations.
SECURITY ANALYTICS PROCESS
Our goal is to provide you with an overview of the Security Analytics Process.
Figure 1.1 provides a conceptual framework of how we envision the process. Chapters 2 through 6 demonstrate the first two steps of the process by show-ing you how to select your data and to use security analytics. Our focus with this book is to provide you with the tools for the first two steps in the pro-cess. In Chapter 7, we provide you with an overview of security intelligence and how it can be used to improve your organization’s response posture.
REFERENCES
Amazon, 2013 Amazon Web Services, Cloud Computing: Compute, Storage, Database. (2013). Retrieved September 16, 2013, from http://aws.amazon.com/.
Apache Software, 2013 Welcome to the Apache Software Foundation! (September 2013). Retrieved September 16, 2013, from http://apache.org/.
5HVSRQVH $QDO\VLV
'DWD ,QWHOOLJHQFH6HFXULW\
Information Security Analytics. http://dx.doi.org/10.1016/B978-0-12-800207-0.00002-2
Copyright © 2015 Elsevier Inc. All rights reserved.
13
INTRODUCTION
In this chapter, we will introduce some freely available, open source software and programming languages that are useful for security analytics. The reader should gain at least some familiarity with these, to follow the examples in sub-sequent chapters in this book.
There are many high-end, and high-priced vendor supplied software packages that are designed for specific security analysis tasks, such as proprietary text mining software, and intrusion detection packages. Since many analysts may not have access to these packages without having a sizable budget, our pur-pose is to introduce tools and methods that are readily available, regardless of budget size.
Additionally, many proprietary vendor packages restrict the user to a set of methods that are predefined in a graphical user interface (GUI). A GUI can make software easier to use, but it can also limit the user to only being able to access certain analytical methods. While we will discuss some open source graphical interfaces that may be useful in exploring some data sets, many of our analytical methods will require some coding to implement. Learning how to write analytical methods in code is worthwhile, since this offers the maxi-mum flexibility in discovering new attack vectors, such as those common in zero day attacks.
By the end of the chapter, readers will be introduced to a range of powerful analytical tools, most of which are freely available to download from the Inter-net. The details on how to use these tools will come in the chapters that follow.
n Introduction to Statistical Programming Tools n Introduction to Databases and Big Data techniques n Introduction to Simulation Software
INFORMATION IN THIS CHAPTER:
STATISTICAL PROGRAMMING
The discovery of attackers and their methods requires the ability to spot pat-terns in large and complex data sets, such as server logs. Unfortunately, the larger and more complex a data set becomes, we humans find ourselves less able to discern relevant patterns. Statistical methods and tools provide a lens to help us spot key relationships within the data.
Many people cringe at the very mention of statistics. However, anyone who has ever counted, summed, averaged, or compared numbers has been doing statistical analysis—basic analysis, but analysis no less. These simpler kinds of statistics, referred to as descriptive statistics, are actually the most important starting point to any analysis. As simple and easy to understand as descriptive statistics are, they are the best way of understanding the data you are dealing with, and often reveal a lot of interesting patterns on their own. For these rea-sons, the calculation and analysis of descriptive statistics should always be one of the first steps in analyzing your data.
Of course, there are more complex statistical tools that we will find very use-ful in doing analysis. Fortunately, these statistical methods are packaged up within software, so that you do not have to be too concerned with the inner workings under the hood. Using these tools generally only involves calling up a function in your code, or in some cases, clicking on a menu item in a user interface. More advanced statistical methods include some of those mentioned previously, such as clustering, correlation, regression, and a host of machine learning and predictive modeling tools.
R offers a rich data analysis and programming environment that includes thousands of freely available add-on packages for data importing, cleansing, transforming, visualizing, mining, and analyzing. There are even packages for adding graphical interfaces which make data exploration faster, by minimizing the amount of code that must be written. Examples of interfaces for R include the Rattle, and R Commander packages.
INTRODUCTION TO DATABASES AND BIG DATA
TECHNIQUES
The phrase, “big data,” has become so overused in so many contexts, that it can be difficult to discern what it really means. While there is no single definition, a common explanation is that data qualifies as big data if it has characteristics pertaining to at least one of the three V’s: volume, velocity, and variability. Volume refers to the size of the data, usually measured in the number of rows, or in the number of bytes. There is no specified size that qualifies data as being big, but data sets containing billions of rows, or multiple terabytes are com-mon. As discussed in Chapter 1, big data generally utilizes parallel computing to process such high volumes.
Hadoop and MapReduce software together provide a very popular platform for big data work. Hadoop is a distributed file system developed at Google, and enables large data sets to be spread out among many computers that work together simultaneously. MapReduce software enables data aggregation rou-tines to be run on top of the Hadoop distributed file system.
To work with the server log examples provided in Chapter 6, you will need to install some big data software on a virtual machine on your computer. The virtual machine allows you to run a Linux operating system on your Windows or Apple computer. You need to have a working Hive environment, on top of a Hadoop file system, loaded with MapReduce. Fortunately, these elements are preinstalled in the free Cloudera QuickStart VM, from http://www.cloudera. com. As of this writing, this software package can be downloaded from http:// www.cloudera.com/content/cloudera-content/cloudera-docs/DemoVMs/ Cloudera-QuickStart-VM/cloudera_quickstart_vm.html. Additionally, we will do some analysis with Mahout and R, so it will be helpful to have these loaded onto your virtual machine as well.
indicates the place after which you can type your commands. Examples are shown in the lines below. You should not type the dollar signs into your com-mands yourself, as these are simply shown to represent the command prompt. From the shell prompt, type the following commands to install R.
$ rpm -ivh http://mirror.chpc.utah.edu/pub/epel/5/x86_64/ epel-release-5-4.noarch.rpm
$ sudo yum install R
To install Mahout, type the following command.
$ sudo yum install mahout
The word, sudo, in the above commands indicates that you are entering super user mode. This allows you to install software, and to access root level directories in your file system. The sudo command will also cause you to be prompted to enter a password as well, after you hit the enter key. When you first install your Cloudera virtual machine, your default username and password will be “admin.” The yum command starts the package installer used by the CentOS operating system.
INTRODUCTION TO R
When you want to combine and automate data preparation, analysis, visual-ization, and presentation all in one environment, R is a very useful language. There are thousands of packages available to perform all manner of tasks related to data, and new ones are continuously being developed and released. You can find R software, packages, and documentation in the Comprehensive R Archive Network (CRAN). This online repository also serves as the main Website for the R community. It is located at www.cran.r-project.org. At this Website, you will find instructions for downloading and installing R, as well as documentation. This is also the best place to search for packages that you may wish to download. While R comes with a large amount of base packages, there are many add-on packages that can greatly extend R’s capabilities.
R is more than a scripting language to perform statistical calculations. It is a full featured, object oriented programming language. This makes R a very flexible and powerful tool for data analysts. The R language can be used for many diverse and helpful purposes, including extracting, cleansing, and transforming data, producing visualizations, performing analysis, and pub-lishing attractive finished documents and presentations. Although all this flexibility may appear to come at the cost of a somewhat steep learning curve, the power it affords the analyst in uncovering hidden insights is worth the effort.
here, so that readers who have at least some programming experience in other languages, will be able to read and follow along with some of the code exam-ples in this book. We also suggest freely available resources to those who want to study R in greater depth.
There are many ways to learn R—many of them for no cost. A course is a very good way, for those who are academically inclined. There are numerous Mas-sive Open Online Courses available focusing on R, which are offered free of charge. Coursera (www.coursera.com) is one such resource. There are also freely available texts and manuals available for downloading from the CRAN R Website as well (www.cran.r-project.org). One such popular text is a down-loadable manual called, “An Introduction to R” (Cran.r-project.org, 2014). There are also numerous videos available, including a series made available by Google called, “Series of Tutorials for Developers in R.” An internet search on terms such as “R tutorial” will produce many other resources as well. In fact, this may be the best way to locate tutorials, since new ones are continually coming out, due to the growing popularity of the language.
Similar to Python, R is an interpreted language, as opposed to a compiled lan-guage. This means that you can type a line of R code at the R command line, and see the result immediately upon pressing the enter key. Unlike languages like C or Java, you do not need to compile your code first before running it. This allows you to easily experiment as you write your code—you can test your code as you build it, one line at a time.
For example, if you type 2+2 at the command prompt in R, and then hit enter, a line of output will appear below where you typed, showing the answer, 4. The command prompt is indicated by the symbol, “>”. The square brackets containing the number “1” is called an index value, and indicates that there is only one item in this answer.
> 2+2 [1] 4
Much of the work done in R is accomplished by functions that are stored in packages. If you are familiar with the Java language, functions may be thought of as analogous to methods in Java. In fact, you may notice that R looks a little like Java in the way that parentheses and brackets are used. In addition, the operators are also similar. However, there are significant differences. For exam-ple, the data types are quite different, and the dot is not used as a separator of object names in R as they are used in Java.
The data types in R are as follows.
n data frames n lists n factors
(Kabacoff, 2012b)
Many of the operators in R should be familiar to users of a popular spreadsheet software. The following are common operators.
Assignment Operators
= assignment left <- assignment left -> assignment right
Arithmetic Operators
+ plus − minus / divide * multiply %% modulus %/% integer division ^ or ** exponentiation
Logical Operators
< less than > greater than == equality != inequality
<= less than or equal to >= greater than or equal to | or
& and TRUE is true FALSE is false
(Kabacoff, 2012a)
symbol can. It is really just a matter of preference as to which one you choose to use. In this book, we will primarily use the equal sign, since that is familiar to programmers of most of the popular modern languages.
The use of dots in names in R deserves some explanation, since this often confuses newcomers to R from object oriented languages such as C and Java. It is fairly common to see examples of R code that uses a dot within a variable name. In R, a dot in a name simply serves as a visual separator to make names easier to read. However, in Java a dot in a name like MyClass.myMethod() indicates a method called “myMethod” contained within a class called “MyClass.”
Most of the work in R is done using functions. Programming in R often requires a lot of referencing of help screens to learn how to use the many func-tions that are available. Even very experienced R programmers have to refer to help screens, as new functions continually become available. One of the most important R skills to learn, then, is to navigate and use the R help docu-mentation. There are a couple ways to look up the help documentation for a function. From the R command line, you can type help(), and put the function name within the parentheses. Or, you can type a question mark in front of the function name, such as ?lm, which in this case will bring up the help docu-mentation and examples for the “linear model” function, lm().
Common R Functions
While there are thousands of R functions available in the many R packages that can be downloaded from the CRAN R repository, there are few essential functions you will find yourself using time and again. Fortunately, most of these functions are contained in the base package when you download the R language.
For example, the function, c(), is a function to concatenate. You can group objects, such as variables, together in a single object and save the result as a new variable name.
a = 1 b = 2 c = 3
myList = c(a, b, c)
INTRODUCTION TO PYTHON
library, and third-party tools. It has interpreters for multiple operating systems. So, if you are using Windows, a Mac or a Linux based machine, you should be able to access and use Python. Finally, Python is free and since it is open-source, your code and applications may be freely distributed.
Python is an interpreted language. This means you do not have to compile it as you would other more traditional languages, like C or C++. Python is geared for rapid development, saving you considerable time in program development. As such, it is perfect for simple automation tasks, such as those we have planned for in our scenario in Chapter 5. Aside from this, the interpreter can also be used interactively, providing an interface for easy experimentation.
A more detailed primer is provided in the chapter regarding Access Control Analytics, and additional discussions and resources regarding Python are made available there.
INTRODUCTION TO SIMULATION SOFTWARE
One of the tools that we will be using in the Simulations Chapter is Arena. Arena is a powerful modeling and simulation software allowing a user to model and run simulation experiments. The commercial version of Arena is available for purchase from Rockwell Automation but a fully functioning per-petual evaluation version is available for study (http://www.arenasimulation. com/Tools_Resources_Download_Arena.aspx).
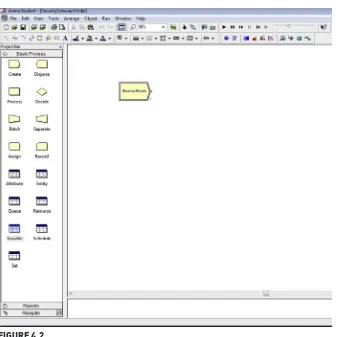
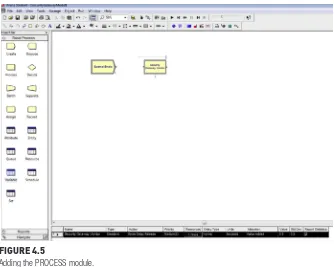
Arena is a Windows desktop application and can be installed in systems run-ning Windows. After installing Arena and starting the program, you will see the main Arena window consisting of three main regions:
n The Project bar typically found in the left had side of the main window
contains three tabs, the Basic process, Report and Navigate Panel. This bar is contains the various Arena modules that are used to build a simulation model. We will discuss more about what “Arena modules” are in the latter part of this section.
n The Model window flowchart view typically located on the right had
side of the main window makes up the largest part of the screen real estate. This is your workspace where you create your model. The model is graphically created in the form of flowcharts, images, animations and other drawn elements.
n The Model window spreadsheet view typically located at the bottom
A whole chapter is dedicated to making simulations, so at this point, we will provide a high level overview of creating simulations in Arena. There are three main steps in making a simulation in Arena:
1. Design and create the model,
2. Add data and parameters to the model, 3. Run the simulation, and
4. Analyze the simulation.
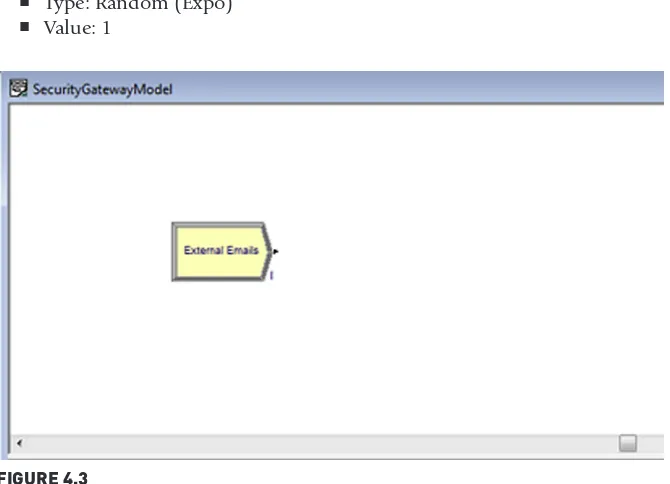
Designing and Creating the Model
Before creating a model, you must first create a “conceptual model” of the scenario you would like to simulate. This could be anything from you just drawing it out in a piece of paper or just thinking about it.
Once you have a conceptual model, the next step is to build the model in the workspace using the various “modules” in Arena. Modules are the building blocks of a model. There are two kinds of modules, the flowchart modules and the data modules.
The Flowchart modules illustrate the logic of your simulation. Some com-mon flowchart modules are Create, Process, Decide, Disposes, Batch, Separate, Assign and Record, which you will find in the “Basic Process” tab in the Proj-ect bar. To use these modules, you simply drag the flowchart modules needed into the model and then connect the modules together in the Model window flowchart view.
A bit confused? Don’t worry because we have a whole chapter about this. Addi-tionally, this quick start model is provided in the companion site for down-load. For now, just think that you will basically creating a flowchart of your scenario. If you have used Microsoft Visio, you will be right at home.
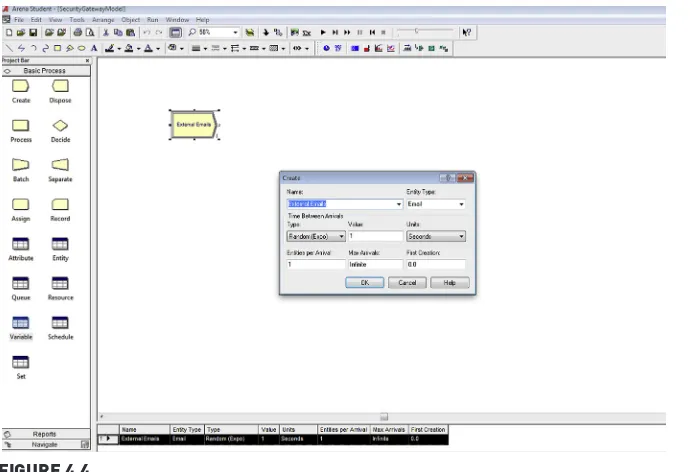
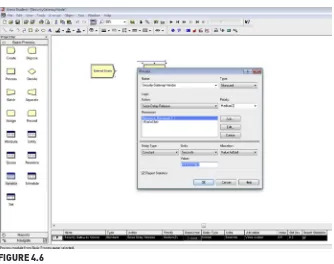
Adding Data and Parameters to the Model
After creating the flowchart, the next step to in creating a simulation in Arena is to add data to each of the flowchart modules. Various values can be assigned for each module by double clicking the modules in the model.
Running the Simulation
Analyzing the Simulation
Arena provides you with reports that allow you to analyze the simulation. You can be accessed these reports from the Reports panel in the Project bar. The report provides statistics such as max, min, averages, and resource reports related to the simulation you just ran.
Arena is a very powerful and versatile simulation development tool using a simple method to set up the simulation model and parameters. Aside from being fairly easy to use, it comes with good documentation with the software installation. The documentation can be found in the Help menu under the Arena product manuals. The “Getting Started with Arena” is a fairly good doc-ument from which to start learning about Arena.
REFERENCES
Cran.r-project.org, 2014. An Introduction to R (online) Available at http://www.cran.r-project. org/doc/manuals/r-release/R-intro.html (accessed 15.10.2013).
Kabacoff, R., 2012a. Quick-R: Data Management (online) Available at http://www.statmethods. net/management/operators.html (accessed 22.10.2013).
Kabacoff, R., 2012b. Quick-R: Data Types (online) Available at http://www.statmethods.net/ input/datatypes.html (accessed 24.10.2013).
Information Security Analytics. http://dx.doi.org/10.1016/B978-0-12-800207-0.00003-4
Copyright © 2015 Elsevier Inc. All rights reserved.
23
INTRODUCTION
Server security is a top concern, as widely publicized data breaches are increas-ingly in the news. After a data breach occurs, forensic analysis of server logs is necessary to identify vulnerabilities, perform damage assessments, prescribe mitigation measures, and collect evidence. However, the increasing amount of Internet traffic, accompanied by growing numbers of Web servers in data cen-ters, often produces massive collections of server log data, which are difficult to analyze with traditional, nonparallelized methods.
By using the Hadoop, MapReduce, and Hive software stack, you have the abil-ity to simultaneously analyze very large collections of server logs. Hadoop and MapReduce together provide a distributed file structure, and parallel process-ing framework, while Hive provides the ability to query and analyze data with an SQL-like syntax. R gives you the essential analytical tools that can be used on moderate-sized data sets, or on big data that have been aggregated or fil-tered down to a more manageable size utilizing Hadoop and MapReduce. There are commercial tools available to help you with querying log-file data. Some, such as Splunk, are capable of handling big data as well. However, we will be focusing the examples in this chapter on open-source and freely
n Scenarios and Challenges in Intrusions and Incident Identification n Use of Text Mining and Outlier Detection
n Case Study: Step by step guide how to use statistical programming
tools to find Intrusions and Incidents (Case study will be about server log investigation using Hadoop and R)
n Other Applicable Security Areas and Scenarios
INFORMATION IN THIS CHAPTER:
available tools and analytical platforms. By writing your own scripts, you can fully customize your analysis to your situation and can build repeatable pro-cesses as well. Open-source tools, such as R, offer thousands of analytical pack-ages to choose from, including very sophisticated and cutting-edge methods that may not be available in commercial toolsets.
Commercial tools can be quite expensive, and not all organizations and departments have the budget for them. However, if you have access to commer-cial tools, by all means, use them to their fullest advantage. Commercommer-cial tools allow for very rapid exploration of your data, utilizing graphical user interfaces, which can make them well worth the cost. Even though scripts are great for reproducibility, which can be a huge advantage when you need to retrace your steps, or rerun your analysis on new data, they do take some time and effort to write. Therefore, it is difficult to beat a good graphical interface for rapid initial searches through your data.
Given that commercial tools and open-source tools each have their advantages, they should be viewed as complementary rather than competing technologies. If you can afford it, why not utilize both? Once you learn how to perform anal-ysis using open-source tools, such as Hadoop, MapReduce, R, and Mahout, you will have a solid foundation for understanding the analytical process on any platform. This will help you in learning other tools, including commercial tools. In this chapter, we will explore scenarios and examples for using analytical methods to uncover potential security breaches. The methods covered in this section are not intended to be an exhaustive catalog of the possibilities. Rather, we hope they will help you to develop some creative ideas of your own.
SCENARIOS AND CHALLENGES IN INTRUSIONS AND
INCIDENT IDENTIFICATION
Perhaps the greatest challenge in identifying intrusion attempts is that “we do not know what we do not know.” It is difficult to uncover the unknown-un-knowns: new attack patterns that we cannot foresee and which can circum-vent existing defenses. Software programs used for precircum-venting intrusions in real time are essential, but they have a significant shortcoming. In general, they only detect known patterns of attack—or, known attack vectors, in security parlance. Real-time intrusion detection and prevention tends to focus on the known-unknowns, rather than the unknown-unknowns.
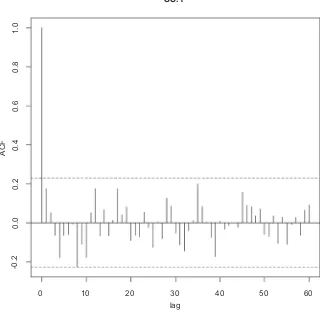
In this chapter, we will focus on the analysis of data, rather than the gath-ering of data. There are many good texts and online resources available for ideas on how to gather data. Since most systems already gather much data about network and server traffic, the greater challenge is in knowing what to do with the data, rather than in collecting it. Whether the data source consists of server logs, network data from software such as Wireshark, or from some other sources, the analytical methods are generally the same. For example, regardless of the data source, outlier detection methods are very likely to be useful, in any situation.
Analyzing a Collection of Server Logs with Big Data
In this section, we will examine how to analyze multiple server logs simultane-ously, using big data technologies.
Conducting Analysis with Big Data Tools
We will focus on a variety of queries in the Hive Query Language (HiveQL) to assist in performing forensic analysis of Apache server log files. We will also include some analysis with other software tools, such as R and Mahout. Since HiveQL is very similar to basic ANSI SQL, it should be easily grasped by those who are already familiar with querying relational databases.
In fact, most of the queries here can be run with little or only minor modi-fications on log-file data that have already been parsed and stored in a rela-tional database. If you have a small enough collection of log files, a relarela-tional database may be all that you need. However, for large collections of logs, the parallel processing afforded by Hive running on top of Hadoop could turn an otherwise impossible analysis into one that is doable.
The log files used in the examples that follow are in the popular Apache com-bined format. This code can be easily adapted to other formats as well.
ANALYSIS OF LOG FILES
on the client browser. The server examples in this book will generally use the combined format, although the methods we will examine can be adapted to any format.
Common Log File Fields
n Remote hostname or IP address of the user n User’s remote logname
n The authenticated username
n The date and time that the request was made n The URL request string sent from the client
n The http status code that was returned by the server to the client n The size in number of bytes of the document that was transferred from
the server to the client
Combined Log File Fields
n Remote hostname or IP address of the user n User’s remote logname
n The authenticated username
n The date and time that the request was made n The URL request string sent from the client
n The http status code that was returned by the server to the client n The size in number of bytes of the document that was transferred from
the server to the client
n URL of the site that the client was referred from
n Identifying information on the client browser or user agent
Methods
Methods of analysis include the following:
n Perform fuzzy searches for keywords and terms related to known attack
vectors, using LIKE operators. These vectors can include injection attacks, directory and path traversal intrusions, cache poisoning, file inclusion or execution, and denial of service attacks.
n Produce time aggregations of Web log variables for trending, such as
host activity, requests, status codes, file sizes, and agents.
n Sort, filter, and combine data to identify potential problem sources. n Create analytical data sets suitable for further analysis with R and
Mahout.
Files one through six are from Amazon’s sample collection. However, as there are no known or readily apparent security breaches within these files, an additional file has been added to this collection, containing examples of log entries that are typical of known security breach incidents. This additional file is called, “access_log_7.” Some of these incidents were found by searching the Internet for sources. Others were added and were derived from a small collec-tion of examples from some actual Web forensic efforts (Talabis, 2013). For security and privacy reasons, no confidential or personal identifiers remain in these log entries.
SQL-like Analysis with Hive
Hive was used for most of the examples, due to the large number of analysts who are familiar with SQL-like syntax, and the flexibility of Hive’s built-in functions and operators. Also, since there are so many potential attack vectors, with new ones being created continually, security analyst needs tools to enable ad hoc, customized analysis. SQL-style tools such as Hive and HiveQL fill this need very nicely.
LOADING THE DATA
The first few steps are basic and involve the following: starting hive, setting up the data, creating the main table, and loading it. It is the analysis part that will become a little more interesting. However, we must first deal with the data setup.
Place the log files in a folder that is shared with your virtual machine you are running. Or, you could also place them in a local directory in Amazon’s AWS environment. All of the following examples are demonstrated in a Cloudera virtual machine on my own computer. The files should be loaded into a folder called, “Apach-eLogData.” We next navigate to the parent folder, which we called “Project1,” and start Hive from there by typing “hive” at our Bash shell command line.
[cloudera@localhost Project1]$ hive.
Logging initialized using configuration in jar:file:/usr/lib/hive/ lib/hive-common-0.10.0-cdh4.2.0.jar!/hive-log4j.properties
Hive history file=/tmp/cloudera/hive_job_log_cloud-era_201305061902_843121553.txt
hive>
We need to reference the jar file needed for the deserializer, which is used for parsing the server logs. We do this by adding it on the hive command line, as follows:
Added resource: /usr/lib/hive/lib/hive-contrib-0.10.0-cdh4.2.0.jar hive>
Next, we add a setting that enables column headers to be seen in the output. This provides a reference making the query results a little easier to read, espe-cially for those who may not be very familiar with the Apache log-file format.
hive> set hive.cli.print.header=true;
In the next step, we create our base table structure and load it with data. hive> CREATE TABLE apachelog (
> host STRING, > identity STRING, > user STRING, > time STRING, > request STRING, > status STRING, > size STRING, > referer STRING, > agent STRING)
> ROW FORMAT SERDE ‘org.apache.hadoop.hive.contrib.serde2. RegexSerDe’ > STORED AS TEXTFILE;
OK
Time taken: 0.029 seconds
Now we have an empty table and are ready to load all seven of the log files. As previously mentioned, the seventh file is one that we created, containing exam-ples of security breaches. The other six were extracted from Amazon’s examexam-ples.
hive> LOAD DATA LOCAL INPATH “ApacheLogData/access*” INTO TABLE apachelog;
Copying file: file:/mnt/hgfs/BigDataAnalytics/Project1/ ApacheLogData/access_log_6
Copying file: file:/mnt/hgfs/BigDataAnalytics/Project1/ ApacheLogData/access_log_7
Loading data to table default.apachelog
Table default.apachelog stats: [num_partitions: 0, num_files: 7, num_rows: 0, total_size: 53239106, raw_data_size: 0]
OK
Time taken: 0.614 seconds
For anyone who may be interested in extracting the Amazon example log files directly, we have provided the following instructions. There is more than one way to do this, but here is the way that we did it. Within Amazon’s Elastic MapReduce environment, we made a new directory called, “temp.” We then copied all of the sample log files that are stored in Amazon’s examples S3 bucket to our new temp directory. The examples are kept in a bucket located at “3n://elasticmapreduce/samples/pig-apache/input/.”
hadoop@domU-12-31-39-00-88-72:∼$ hadoop dfs -mkdir temp
hadoop@domU-12-31-39-00-88-72:∼$ hadoop dfs -cp
‘s3n://elasticma-preduce/samples/pig-apache/input/*’ temp
13/04/22 19:17:43 INFO s3native.NativeS3FileSystem: Opening
‘s3n://elasticmapreduce/samples/pig-apache/input/access_log_1’ for reading
13/04/22 19:17:46 INFO s3native.NativeS3FileSystem: Opening ‘s3n:// elasticmapreduce/samples/pig-apache/input/access_log_2’ for reading 13/04/22 19:17:48 INFO s3native.NativeS3FileSystem: Opening ‘s3n:// elasticmapreduce/samples/pig-apache/input/access_log_3’ for reading 13/04/22 19:17:49 INFO s3native.NativeS3FileSystem: Opening ‘s3n:// elasticmapreduce/samples/pig-apache/input/access_log_4’ for reading 13/04/22 19:17:50 INFO s3native.NativeS3FileSystem: Opening ‘s3n:// elasticmapreduce/samples/pig-apache/input/access_log_5’ for reading 13/04/22 19:17:52 INFO s3native.NativeS3FileSystem: Opening ‘s3n:// elasticmapreduce/samples/pig-apache/input/access_log_6’ for reading
We then moved the files from the temp directory to our own S3 bucket for easier access, in the event that we want to retrieve or modify them in the future. Our S3 bucket was named, “Project1E185.”
hadoop@domU-12-31-39-00-88-72:∼$ hadoop dfs -cp temp/* ‘s3n://
Project1E185/’
13/04/22 19:19:36 INFO s3native.NativeS3FileSystem: Creating new file ‘s3n://Project1E185/access_log_1’ in S3
13/04/22 19:19:40 INFO s3native.Jets3tNativeFileSystemStore: s3.putObject Project1E185 access_log_1 8754118
13/04/22 19:19:40 INFO s3native.NativeS3FileSystem: Creating new file ‘s3n://Project1E185/access_log_2’ in S3
13/04/22 19:19:42 INFO s3native.NativeS3FileSystem: Creating new file ‘s3n://Project1E185/access_log_3’ in S3
13/04/22 19:19:44 INFO s3native.Jets3tNativeFileSystemStore: s3.putObject Project1E185 access_log_3 8896201
13/04/22 19:19:44 INFO s3native.NativeS3FileSystem: Creating new file ‘s3n://Project1E185/access_log_4’ in S3
13/04/22 19:19:46 INFO s3native.Jets3tNativeFileSystemStore: s3.putObject Project1E185 access_log_4 8886636
13/04/22 19:19:46 INFO s3native.NativeS3FileSystem: Creating new file ‘s3n://Project1E185/access_log_5’ in S3
13/04/22 19:19:48 INFO s3native.Jets3tNativeFileSystemStore: s3.putObject Project1E185 access_log_5 8902365
13/04/22 19:19:48 INFO s3native.NativeS3FileSystem: Creating new file ‘s3n://Project1E185/access_log_6’ in S3
13/04/22 19:19:50 INFO s3native.Jets3tNativeFileSystemStore: s3.putObject Project1E185 access_log_6 8892828
We then downloaded these files from our S3 bucket to the shared folder on our computer called, “ApacheLogData.” This is so that we can access them from our Cloudera Hadoop installation.
Discovery Process for Specific Attack Vectors
The most direct means of discovering attack attempts within server logs is to find patterns within the “request” field. The request field shows the URL infor-mation for the resource or Web page requested by the user of a client browser, or other agent. Many attacks leave revealing fingerprints or signatures behind within this field, through the use of a LIKE operator, using HQL. Or, if more fine-grained control is required for the search, either the REGEXP or RLIKE operator may be used with a regular expression.
You can do these searches with Perl, Java, or any other tool that can handle regular expressions. However, these tools do not scale up to handling large and numerous log files, as can the combined forces of the Hive, MapReduce, and Hadoop software stack. Following are some examples of direct searches and the attacks they are intended to find.