for-profit organizations, and academia, they share valuable perspectives on
healthcare, finance, and transportation.
•
•
•
not-for-profits
Big Data
Business
Analytics
Edited by
JAY LIEBOWITZ
Foreword by
Joe LaCugna, PhD, Starbucks Coffee Company
and
Big Data
and
Business
Analytics
Big Data
and
Business
Analytics
Edited by
JAY LIEBOWITZ
Foreword by
Joe LaCugna, PhD, Starbucks Coffee Company
Boca Raton, FL 33487-2742
© 2013 by Taylor & Francis Group, LLC
CRC Press is an imprint of Taylor & Francis Group, an Informa business
No claim to original U.S. Government works Version Date: 20130220
International Standard Book Number-13: 978-1-4665-6579-1 (eBook - PDF)
This book contains information obtained from authentic and highly regarded sources. Reasonable efforts have been made to publish reliable data and information, but the author and publisher cannot assume responsibility for the validity of all materials or the consequences of their use. The authors and publishers have attempted to trace the copyright holders of all material reproduced in this publication and apologize to copyright holders if permission to publish in this form has not been obtained. If any copyright material has not been acknowledged please write and let us know so we may rectify in any future reprint.
Except as permitted under U.S. Copyright Law, no part of this book may be reprinted, reproduced, transmit-ted, or utilized in any form by any electronic, mechanical, or other means, now known or hereafter inventransmit-ted, including photocopying, microfilming, and recording, or in any information storage or retrieval system, without written permission from the publishers.
For permission to photocopy or use material electronically from this work, please access www.copyright. com (http://www.copyright.com/) or contact the Copyright Clearance Center, Inc. (CCC), 222 Rosewood Drive, Danvers, MA 01923, 978-750-8400. CCC is a not-for-profit organization that provides licenses and registration for a variety of users. For organizations that have been granted a photocopy license by the CCC, a separate system of payment has been arranged.
Trademark Notice: Product or corporate names may be trademarks or registered trademarks, and are used only for identification and explanation without intent to infringe.
Visit the Taylor & Francis Web site at http://www.taylorandfrancis.com and the CRC Press Web site at http://www.crcpress.com
v
Foreword ...vii
Joe LaCugna Preface ... xv
About the Editor ...xvii
Contributors ...xix
Chapter 1 Architecting the Enterprise via Big Data Analytics ... 1
Joseph Betser and David Belanger Chapter 2 Jack and the Big Data Beanstalk: Capitalizing on a Growing Marketing Opportunity ... 21
Tim Suther, Bill Burkart, and Jie Cheng Chapter 3 Frontiers of Big Data Business Analytics: Patterns and Cases in Online Marketing ... 43
Daqing Zhao Chapter 4 The Intrinsic Value of Data ... 69
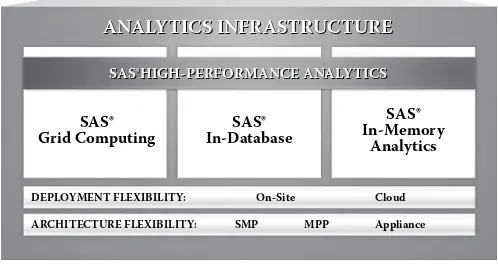
Omer Trajman Chapter 5 Finding Big Value in Big Data: Unlocking the Power of High- Performance Analytics ... 87
Paul Kent, Radhika Kulkarni, and Udo Sglavo Chapter 6 Competitors, Intelligence, and Big Data ... 103
G. Scott Erickson and Helen N. Rothberg Chapter 7 Saving Lives with Big Data: Unlocking the Hidden Potential in Electronic Health Records ... 117
Juergen Klenk, Yugal Sharma, and Jeni Fan
Chapter 8 Innovation Patterns and Big Data ... 131
Daniel Conway and Diego Klabjan
Chapter 9 Big Data at the U.S. Department of Transportation .... 147
Daniel Pitton
Chapter 10 Putting Big Data at the Heart of the Decision-
Making Process ... 153
Ian Thomas
Chapter 11 Extracting Useful Information from Multivariate
Temporal Data ... 171
Artur Dubrawski
Chapter 12 Large- Scale Time- Series Forecasting ... 191
Murray Stokely, Farzan Rohani, and Eric Tassone
Chapter 13 Using Big Data and Analytics to Unlock Generosity ... 211
Mike Bugembe
Chapter 14 The Use of Big Data in Healthcare ... 229
Katherine Marconi, Matt Dobra, and Charles Thompson
Chapter 15 Big Data: Structured and Unstructured ... 249
Arun K. Majumdar and John F. Sowa
vii
Joe LaCugna, PhD
Enterprise Analytics and Business Intelligence Starbucks Coffee Company
The promise and potential of big data and smart analysis are realized in better decisions and stronger business results. But good ideas rarely imple-ment themselves, and often the heavy hand of history means that bad practices and outdated processes tend to persist. Even in organizations that pride themselves on having a vibrant marketplace of ideas, converting data and insights into better business outcomes is a pressing and strategic challenge for senior executives.
How does an organization move from being data-rich to insight-rich— and capable of acting on the best of those insights? Big data is not enough, nor are clever analytics, to ensure that organizations make better decisions based on insights generated by analytic professionals. Some analysts’ work directly influences business results, while other analysts’ contributions matter much less. Rarely is the difference in impact due to superior ana-lytic insights or larger data sets. Developing shrewd and scalable ways to identify and digest the best insights while avoiding the time traps of lazy data mining or “analysis paralysis” are new key executive competencies.
INFORMATION OVERLOAD AND A TRANSLATION TASK
How can data, decisions, and impact become more tightly integrated? A central irony, first identified in 1971 by Nobel Prize winner Herbert Simon, is that when data are abundant, the time and attention of senior decision makers become the scarcest, most valuable resource in organi-zations. We can never have enough time, but we can certainly have too much data. There is also a difficult translation task between the pervasive ambiguity of the executive suite and the apparent precision of analysts’ predictions and techniques. Too often, analysts’ insights and prescriptions fail to recognize the inherently inexact, unstructured, and time-bound
nature of strategically important decisions. Executives sometimes fail to appreciate fully the opportunities or risks that may be expressed in abstract algorithms, and too often analysts fail to become trusted advisors to these same senior executives. Most executives recognize that models and analyses are reductive simplifications of highly complex patterns and that these models can sometimes produce overly simple caricatures rather than helpful precision. In short, while advanced analytic techniques are increasingly important inputs to decision making, savvy executives will insist that math and models are most valuable when tempered by firsthand experience, deep knowledge of an industry, and balanced judgments.
LIMITATIONS OF DATA-DRIVEN ANALYSIS
More data can make decision making harder, not easier, since it can some-times refute long-cherished views and suggest changes to well-established practices. Smart analysis can also take away excuses and create account-ability where there had been none. But sometimes, as Andrew Lang noted, statistics can be used as a drunken man uses a lamppost—for support rather than illumination. And sometimes, as the recent meltdowns in real estate, mortgage banking, and international finance confirm, analysts can become too confident in their models and algorithms, ignoring the chance of “black swan” events and so-called “non-normal” distributions of out-comes. It is tempting to forget that the future is certain to be different from the recent past but that we know little about how that future will become different. Mark Twain cautioned us, “History doesn’t repeat itself; at best it sometimes rhymes.” Statistics and analysts are rarely able to discern when the future will rhyme or be written in prose.
Some of the most important organizational decisions are simply not amenable to traditional analytic techniques and cannot be characterized helpfully by available data. Investments in innovation, for example, or deci-sions to partner with other organizations are difficult to evaluate ex ante, and limited data and immeasurable risks can be used to argue against such strategic choices. But of course the absence of data to support such unstruc-tured strategic decisions does not mean these are not good choices—merely that judgment and discernment are better guides to decision making.
Many organizations will find it beneficial to distinguish more explic-itly the various types of decisions, who is empowered to make them, and
how. Many routine and tactical decisions, such as staffing, inventory plan-ning, or back-office operations, can be improved by an increased reliance on data and by automating key parts of the decision-making process— by, for example, using optimization techniques. These rules and deci-sions often can be implemented by field managers or headquarters staff and need not involve senior executives. More consequential decisions, when ambiguity is high, precedent is lacking, and trade-offs cannot be quantified confidently, do require executive engagement. In these messy and high-consequence cases, when the future is quite different from the recent past, predictive models and optimization techniques are of limited value. Other more qualitative analytic techniques, such as field research or focus groups, and new analytic techniques, such as sentiment analysis and social network graphs, can provide actionable, near-real-time insights that are diagnostically powerful in ways that are simply not possible with simulations or large-scale data mining.
Even in high-uncertainty, high-risk situations, when judgment and experience are the best available guides, executives will often benefit from soliciting perspectives from outside the rarefied atmosphere of their corner offices. Substantial academic and applied research confirms that decisions made with input from different groups, pay grades, and disci-plines are typically better than decisions that are not vetted beyond a few trusted advisors. Senior executives who find themselves inside “bubbles” of incomplete and biased information may be misled, as when business cases for new investments are grounded in unrealistically optimistic assumptions, or when a manager focuses on positive impacts for her busi-ness unit rather than the overall organization. To reduce this gaming and the risks of suboptimization, there is substantial value and insight gained by seeking out dissenting views from nontraditional sources. In strate-gically important and ambiguous situations, the qualitative “wisdom of crowds” is often a better guide to smart decision making than a slavish reliance on extensive data analysis—or a myopically limited range of per-spectives favored by executives. Good analysts can play important roles too since they bring the rigor and discipline of the scientific method above and beyond any data they may have. The opportunity is to avoid the all-too-common refrain: we’re doing it because the CEO said so.
positively biased information to curry favor with more senior deci-sion makers. These practices can impair decideci-sions, create silos, truncate learning, accentuate discord, and delay the emergence of learning com-munities. In the past, hoarding and managing up have been rational and were sometimes sanctioned; now, leadership means insisting that shar-ing information up and down the hierarchy, transparently and with can-dor, is the new normal. This is true both when insights confirm existing views and practices and also when the data and analysis clash with these. Conflicting ideas and competing interests are best handled by exposing them, addressing them, and recognizing that they can improve decisions.
EVOLVING A DATA-DRIVEN LEARNING CULTURE
For organizations that have relied on hard-won experience, memorable events, and other comfortable heuristics, the discipline of data-driven decision making may be a wholly new approach to thinking about how to improve business performance. As several chapters in this volume indicate, it is simply not possible to impose an analytic approach atop a company’s culture. Learning to improve business performance through analytics is typically piecemeal and fragile, achieved topic by topic, process by pro-cess, group by group, and often in fits and starts. But it rarely happens without strong executive engagement, advocacy, and mindshare—and a willingness to establish data-driven decision making as the preferred, even default approach to answering important business questions.
Likewise, analytic priorities and investments will vary across companies, so there are clear opportunities for executives to determine top-priority analytic targets, how data and analysts are resourced and organized, and how decision making evolves within their organizations.
NO SIMPLE RECIPES TO MASTER
ORGANIZATIONAL COMPLEXITY
The chapters in this volume offer useful case studies, technical roadmaps, lessons learned, and a few prescriptions to “do this, avoid that.” But there are many ways to make good decisions, and decision making is highly idiosyncratic and context dependent: what works well in one organization may not work in others, even for near-peers in the same businesses or markets. This is deeply ironic: we know that strong analytic capabilities can improve business results, but we do not yet have a rigorous under-standing of the best ways for organizations to build these capabilities. There is little science in how to build those capabilities most efficiently and with maximum impact.
willingness to challenge the status quo will increase the chance that data-based insights yield better business outcomes.
Executives confront at least one objective constraint as they consider their approach to data-driven decision making: there is a pervasive short-age of deep analytic talent, and we simply cannot import enough talent to fill this gap. Estimates of this talent gap vary, but there is little reason to think it can be filled in the near term given the time involved in formal education and the importance of firsthand business experience for ana-lysts to become trusted advisors. With some irony, Google’s Hal Varian believes that statisticians will enjoy “the sexiest job for the next decade.” Analysts who combine strong technical skills with a solid grasp of busi-ness problems will have the best choices and will seek out the best organi-zations with the most interesting problems to solve.
There is also an emerging consensus that many managers and executives who think they are already “data driven” will need to become much more so and may need deeper analytic skills to develop a more nuanced under-standing of their customers, competitors, and emerging risks and oppor-tunities. Much as an MBA has become a necessary credential to enter the C-suite, executives will increasingly be expected to have deeper knowl-edge of research methods and analytic techniques. This newly necessary capability is not about developing elegant predictive models or talking confidently about confidence intervals, but about being able to critically assess insights generated by others. What are the central assumptions and what events could challenge their validity? What are the boundary con-ditions? Is A causing B or vice versa? Is a set of conclusions statistically valid? Are the findings actionable and repeatable at scale? Is a Cronbach’s
alpha of 5 percent good or bad?
with their early successes and are pioneering new analytic techniques and applying a more disciplined approach to ever more of their operations. Embracing and extending this data-driven approach have been called “the future of everything.” The opportunity now is for executives in other firms to do likewise: to capture the value of their information assets through rigorous analysis and better decisions. In addition to more efficient oper-ations, this is also a promising path to identify new market opportuni-ties, address competitive vulnerabiliopportuni-ties, earn more loyal customers, and improve bottom-line business results.
xv So why Big Data and Business Analytics? Is it that the White House Office of Science and Technology Policy held a conference on March 29, 2012, citing that $200 million is being awarded for research and development on big data and associated analytics? Is it that, according to KMWorld, big data revenue will grow from $5 billion in 2011 to $50 billion in 2017? Or is it just that we are entrenched in the three Vs: volume of data, variety of data, and the velocity of data?
With the barrage of data from such domains as cybersecurity, emergency management, healthcare, finance, transportation, and other domains, it becomes vitally important for organizations to make sense of this data and information on a timely and effective basis to improve the decision-making process. That’s where analytics come into play. Studies have shown that by 2018, there will be a shortage of 140,000 to 190,000 business data analysts in the United States alone. These analysts should know machine learning, advanced statistical techniques, and other predictive analytics to make sense of the various types of data—structured, unstructured, text, numbers, images, and others.
This book is geared for filling this niche in terms of better understand-ing the organizational case studies, trends, issues, challenges, and tech-niques associated with big data and business analytics. We are extremely pleased to have some of the leading individuals and organizations world-wide as contributors to this volume. Chapters from industry, government, not-for-profit, and academe provide interesting perspectives in this emerg-ing field of big data and business analytics. We are also very pleased to have Joe LaCugna, PhD, who oversees Enterprise Analytics and Business Intelligence at Starbucks Coffee Company, write the Foreword based on his many years of working in this field, both in industry and academe.
University College, and professional contacts for allowing me to further gain insight into this area.
Enjoy!
Jay Liebowitz, DSc
xvii Dr. Jay Liebowitz is the Orkand Endowed Chair of Management and Technology in the Graduate School at the University of Maryland University College (UMUC). He previously served as a professor in the Carey Business School at Johns Hopkins University. He was ranked one of the top 10 knowledge management (KM) researchers/ practitioners out of 11,000 worldwide and was ranked number two in KM strategy world-wide according to the January 2010 Journal of Knowledge Management. At Johns Hopkins University, he was the founding program director for the graduate certificate in competitive intelligence and the Capstone direc-tor of the MS-Information and Telecommunications Systems for Business Program, where he engaged more than 30 organizations in industry, gov-ernment, and not-for-profits in capstone projects.
Prior to joining Hopkins, Dr. Liebowitz was the first knowledge man-agement officer at the National Aeronautics and Space Administration’s (NASA’s) Goddard Space Flight Center. Before this, Dr. Liebowitz was the Robert W. Deutsch Distinguished Professor of Information Systems at the University of Maryland– Baltimore County, professor of management science at George Washington University, and chair of artificial intelli-gence (AI) at the U.S. Army War College.
Dr. Liebowitz is the founder and editor-in-chief of Expert Systems with Applications: An International Journal (published by Elsevier), which is ranked third worldwide for intelligent systems/ AI-related journals, according to the most recent Thomson impact factors. The journal had 1.8 million articles downloaded worldwide in 2011. He is a Fulbright Scholar, an Institute of Electrical and Electronics Engineers (IEEE)-USA Federal Communications Commission Executive Fellow, and a Computer Educator of the Year (International Association for Computer Information Systems, or IACIS). He has published more than 40 books and myriad journal articles on knowledge management, intelligent systems, and IT
management. His most recent books are Knowledge Retention: Strategies
and Solutions (Taylor & Francis, 2009), Knowledge Management in Public Health (Taylor & Francis, 2010), Knowledge Management and E-Learning
(Taylor & Francis, 2011), Beyond Knowledge Management: What Every
Handbook: Collaboration and Social Networking, second edition (Taylor & Francis, 2012). In October 2011, the International Association for Computer Information Systems named the Jay Liebowitz Outstanding Student Research Award for the best student research paper at the IACIS Annual Conference. He has lectured and consulted worldwide. He can be reached at jay.liebowitz@umuc.edu.
xix David Belanger
Chief Scientist
Eric Tassone
Senior Quantitative Analyst Google Inc.
Mountain View, California
Ian Thomas
Senior Director
Microsoft Online Services Division Sunnyvale, California
Charles Thompson
Senior Consultant
Research Triangle Institute (RTI) International
Washington, DC
Omer Trajman
Vice President Field Operations WibiData
San Francisco, California
Daqing Zhao
Director of SEM Analytics Ask.com
1
1
Architecting the Enterprise
via Big Data Analytics
*Joseph Betser and David Belanger
* All trademarks, trade names, and service marks are the property of their respective owners.
CONTENTS
INTRODUCTION
The emergence of new technologies, applications, and social phenomena creates novel business models, communities, and system complexities. Some of these changes are nonlinear and create changes in kind, such as new driving business forces and new organizational structures, which in turn, drive new ways of interacting and conducting business. Facebook, LinkedIn, Google, and Twitter, combined with mobile devices, introduce such emerging technologies, which generate tools for easy community building, collaboration, and knowledge creation, based on social networks. Such emerging changes cause e-mail communication to be subsumed by social network communications, as well as by text messages and tweets. The communities that are created can be based on professional interest, business interest, and social factors. The introduction of cyberthreats to the emerging enterprise makes the challenge richer still, adding multiple layers of complexity to modern enterprises. We review these challenges and how big data analytics assists us in decomposing some of these chal-lenges into more tractable components.
CHALLENGES
EMERGING PHENOMENA
As phenomenal growth took place in processing power, data storage, net-work speeds, mobility, and higher semantic capability of a myriad of online applications, the pace of innovation has increased dramatically. The ability to conduct quick searches on vast amounts of data that are available on the World Wide Web (WWW) and other enterprises resulted in multiple new capabilities. It allows national security applications to provide relevant data products to warfighters in record time, enables more targeted and effective advertisement, and allows faster and more effective communica-tions within the enterprise, to name just a small number of innovacommunica-tions. However, an outcome that was not anticipated is the dramatic flattening [1] of enterprises and organizations created by this information revolu-tion. Much like the steam engine and the light bulb created the industrial revolution, the WWW and all those emerging applications are drastically restructuring our enterprises, industries, and even societies.
SOCIAL NETWORKS
kept growing in size, scope, and number to the point that they drive sig-nificant business model changes as well as societal changes. The relation-ship between the individuals and peers becomes intertwined with some enabling technologies, and the enterprise becomes a far more dominant structure that comprises the information world in which we live and work.
PERSON- CENTRIC SERVICES AND COMMUNITIES
It is well known that the same online search yields different results for different users. This is because the searches are customized for each user, according to previous searches, websites visited, geolocation, and personal preferences of that user. Sometimes social network relationships, such as Facebook friends and LinkedIn connections, Amazon choices, eBay searches, and previous shopping history also affect the results of searches and advertisements. The services afforded to users become increasingly more effective and targeted in a way that can exceed the capability of human sales and marketing individuals. National security applications can similarly provide users with information most relevant to their mis-sion and current activity in a more effective and timely fashion.
TECHNOLOGY DRIVERS AND BUSINESS ANALYTICS
The computational power of handheld devices, along with the dramatic storage capability, graphic capability, networking capability, and overall versatility, creates an enormously complex and capable enterprise. The discussion that follows studies in more detail how big data business ana-lytics helps make sense of this very challenging undertaking.
FROM NUMBERS TO BIG DATA
How Did We Get Here?
database management systems started to appear,* there has been a steady increase in the amount of data stored and in the recognition of the value of that data beyond the simple computerization of routine tasks. In big data parlance, the volume of data has increased steadily and substantially from the 1960s through the present time. The combination of the Internet and the WWW in the mid-1990s, however, signaled a sea change not only in the amount of data but also more significantly in the rate at which data arrived, velocity; the diversity of sources from which it arrived and the types of data available to nearly everyone, variety. More important than the quantitative changes, there has been a huge, qualitative change in the amount of detail that is carried and maintained by these databases. These changes, combined with dramatic changes in the technology available to analyze and derive information from these data, the cost and availability of processing and storage for the data, and source/ delivery mechanisms such as smartphones and sensors have in turn driven changes in the opportuni-ties that can be created by excellence in the use of data and information. More than that, they have driven changes in what we consider to be data available for analysis, what we view the possible results to be, how we view information itself, and most important, the ability that we have to use the results to impact real events.
For several decades, the primary focus of data management was on the ability to process the transactions that make up the core of many business processes, with perfect reliability and with ever- increasing numbers of transactions per second. This replaced manual processes, and over a fairly short amount of time enabled the rate of transactions and the total num-ber of transactions to exceed what would have been economically possible without the machines. Examples of this are the airline reservation sys-tems and the credit card syssys-tems. These syssys-tems are highly optimized for the large numbers of transactions that they can process, with near- perfect reliability, each second. The goal was to create systems that achieved the so- called ACID† properties as efficiently as possible. With each decade, the size of the databases increased by about a factor of 1000, so that what was a large database in the 1970s (perhaps many megabytes) was replaced by terabyte-scale bases in the 1990s, and petabytes in the 2000s. Given the current explosion in sources of data, both the number of indi-vidual sources and the volume from each source, there is every reason to
* For example, IBM’s IMS Data Base System.
expect this pace to increase. The basic model of the databases also evolved from hierarchical and network* to relational. These models became very effective at storing data that had the structure of fields within records† (attributes in tuples). Of course, there were exceptions to the transaction processing models, for example, scientific databases made up of huge
vol-umes of numbers,‡ databases made up of images (e.g., NASA databases),
and databases made up of events (e.g., network data). With the dominance of the relational data model, structured query language (SQL) became the de facto standard for accessing data.
By the late 1980s and early 1990s, it had become clear that there must be more value in the data available than simply managing transactions or recording events. The existing data provided deep insight into behavior of customers, activities on inventories, trends in financial transactions, and a host of other useful functions. Alas, in transaction systems, changes are made in situ; therefore, historical data was often lost, and longitudinal studies were difficult. In many ways, the emergence of data warehouses addressed this problem, making data more available to a larger cross- section of people, and retaining data that no longer had direct operational use but was very useful for decision support and optimizing operations. The sources of the data were largely the same, driven by transactions and events, and the type of data was still typically numbers or characters in fields organized into records (i.e., the relational model), but the additional type of management opened up many new possibilities in terms of analy-sis and recognition of the value of the detail available. In general, a wider variety of people had access to these warehouses, and they often contained a broader cross- section of data.
All of this would have been fine, except that in the late 1990s the devel-opment of the WWW, on top of the Internet, was making huge amounts of information available to large percentages of the United States (and the world). With the advent of the WWW, many things changed. There has been no reduction in the need for reliable, high- volume transaction pro-cessing, but it has become only one of a number of different modes of data management. First, there are now many important applications that do not require strict ACID properties but may be able to relax either the
* Databases structurally based on the concept of parent/ child records or owner/ member records.
† A picture of a relational attribute and tuple.
‡ For example: astronomy, meteorology, high- energy physics, genomics.
requirements for availability or consistency in a networked environment.* For example, an application that monitors network traffic to detect secu-rity attacks is interested in very low latency and near perfect availability of the data, but may be willing to sacrifice some consistency to obtain it. This engineering tradeoff allows it to run at the speed of the network, an essential property, without sampling, which could lose important information, but with a generally small sacrifice in terms of consistency. Second, much, and then most, of the data available no longer looked like a relatively small set of numeric- or character- based fields collected in the form of a record. Semistructured and unstructured data have become, in volume and velocity, at least the equal of structured data. It is certainly not hard to observe this on the Internet and WWW. Browsers are based on the notion of semistructured data. There is structure in the form of the web hypertext, but the individual web pages are made up of text, image, and often video and audio. None of these has the convenient structure of a relational database, and none of it is reasonably accessed by an SQL- like language. These changes have not only led to many changes in what we can generate and access as data, but have driven fundamental changes in the structure of the way data itself is managed. Among many other things,
the emergence of NoSQL† (not only SQL) data management systems have
fundamentally changed the calculations on what we can do with data sys-tems. The map/ reduce systems, such as Hadoop, which these data man-agement systems run, have vastly increased the scale of processing data.
But the WWW and the resultant consumer access to vast amounts of largely unstructured data was just the first wave of changes in data vol-ume, velocity, and variety. While having the effect of making these data available at any time and to nearly anyone, and at least as important, mak-ing nearly everyone a potential (and often actual) source of data, they accessed only a small fraction of the potential generation and use of data.
Two existing trends, and one emerging trend, have filled this void and are dramatically increasing volume, velocity, variety, and especially timely detail of data both generated and consumed. These are mobility, machine- to- machine communication, and the trend toward “open” data.
* This concept is important because of a very well-known theorem, known as the CAP theorem,
which states roughly that in a partitioned environment (e.g., separated by a network) one cannot have complete consistency and availability. [Ref: 2.]
Mobility creates more data and more demand for data. It reduces the time during which an item of information is perceived to have value* to seconds or minutes (how long are you now willing to wait, given that you have a smartphone, for an update of a news item or sports score?), and it reduces the effort you expect to expend to obtain information† to feet or inches (the distance between your hand and pocket). From the point of view of data, every activity on the mobile device generates data about the device and the networks that it is using, the applications that you are using and what you are using them for, your location, and a variety of other values. Some of this data is consumed and returned directly to you in the form of personalized, online advertisements or other applications, some is consumed to optimize the performance of the device and its networks and to detect network problems, and much of it is stored for later data analysis. Of course, you can perform all of the activities that you do on a smartphone with a fixed device in your home, but you can’t do it wherever you are at any given time.
Mobility, in the form of devices like smartphones, has increased the amount of data by a few orders of magnitude. Much of this is the result of the “always on” nature of the medium, but even more of the pure data con-sumed, and therefore in flight, is a result of the convergence of entertain-ment with communications and computing. Simply put, today video is the primary driver of bandwidth use on networks, fixed and mobile. Much of this video is what we classically think of as entertainment, professionally developed movies and television. This results in a huge amount of data moving across networks, though a limited amount of new information (since the sources are quite limited). However, much more of it is the result of cameras (image and video) on every new smartphone. These devices are used to record a vast variety of things, mundane or exciting, which are in turn stored and made available to many (e.g., “friends”) or everyone (e.g., YouTube). There are now venues where the amount of upstream con-tent in the form of video exceeds downstream. Even this deluge of data, easily hundreds of petabytes per day, will be supplanted in terms of veloc-ity, and perhaps volume, over the next decade.
What could possibly generate more data than seven billion folks mul-titasking with video applications all their waking hours? The answer is a few trillion machines communicating with each other 24 hours a day.
* Sometimes referred to as the half- life of the perceived value of information.
The advent of wireless communication, both that which we associate with mobility (i.e., cellular) and more nomadic wireless (e.g., WiFi, Zigbee, UWB), has made it possible to place sensing devices nearly anywhere. Today, most of these devices are communicating numbers and charac-ters among each other or to a central location for analysis. For example, your cell phone is communicating a large array of data about its status, signal strength, connectivity, and location with a frequency that is limited largely by the capacity of the network to transmit the data and the ability of the carrier to make use of the data. There is also an increasing array of devices that can be attached to your body and transmit medical and activ-ity information (e.g., blood pressure, pulse rate, blood glucose level, pace of motion) to clinical systems. As the ability to mine unstructured data, especially image and video, matures (a matter of only a few years), the data supplied by these devices spreads to image and video and will see another quantum leap in the amount of data, but much more important, also in the value of data.
Finally, data because of its value, even if only for operations, has tradi-tionally been considered a proprietary resource. Before the advent of the Internet, web, and broadband communications, this was purely a prag-matic choice. Only large corporations had the resources and expertise to purchase and operate the kind of machinery needed to move, store, and analyze the data. Now, a large percentage of the world has such capability. So we have seen first hardware, then software, move from the province of large corporations to consumers.
Will data be next? Of course it will! Hardware has become remarkably standardized over the last two decades, and while corporate comput-ers are bigger and faster than most found in homes or pockets, they are increasingly large because they are clustered in large groups. Most peo-ple do not have an array of thousands of PCs in their homes, but Google and Amazon do, and through the “cloud” one can, in theory, have access to them. Software, through open source and cloud, is following in that direction, though proprietary software is still a significant force. Sites are beginning to appear* that make significant data available to anyone who can make use of it. This trend will certainly increase quickly, but data has some properties that hardware and software do not. Among the most obvious are privacy and integrity. One can be harmed by data about oneself falling into the wrong hands (e.g., identity theft) and equally by
data that is incorrect even in the right hands (e.g., credit score errors). The resolution of the tension between privacy on the one hand and open-ness on the other will take years to resolve, and the details are not yet clear. What is clear is that upcoming generations have a different expecta-tion of privacy, since they were raised in the presence of pervasive mobile devices. It is fairly clear that openness is generally the friend of integrity. For example, Wikipedia seems to rival traditional encyclopedias in terms of overall quality of the data, for most articles. This is largely because of its open, self- correcting structure.
Why Does It Matter?
In this section we outline a potential application to illustrate the nature and some of the power of big data. The application is hypothetical but entirely possible given access to the right data. In this discussion, we will assume that all users have opted in. That is, they have indicated that they are willing to share their data to have access to the service.
Suppose that you are interested in an application on your mobile device that would notify you if someone with certain common interests was within a short walking distance from you at this moment. Perhaps they should be within half a mile. What data would be required to provide such a service? First, a way to indicate interests would be needed. This might be done by noting the searches that you and the person whose interests match yours have performed over the past few days. Using an appropriate algo-rithm to cluster people with similar interests based on their recent search patterns, a set of possible contacts could be determined. This is already a big data problem, because the search data is typically text (variety), and usually large (volume, velocity). Given a set of people with common inter-ests, the next step is to see if any of them are within half a mile of you right now. The data required for this is provided by the GPS on most smart devices and available to the application if you have opted in to allow it to be seen. Though this data is numeric, it typically has significant volume and velocity and, more than that, is useful only in real time. That is, where you were a few minutes ago is of no interest. The above conditions being met, each of the people identified would be notified by an instant message with enough information to make the contact.
even generate “flash” groups. Our interest here, however, is to understand what is different about the data processing required to provide such a ser-vice. As observed earlier, the differentiating property of big data is the amount of detail that can be provided. In this case, detail about the inter-ests of tens or hundreds of millions of people, as reflected by data from search engines, social networks, specific interest (e.g., health- related) sites, tweets, or other sources, is well beyond anything available in the trans-actional world. It is possible, of course, that transtrans-actional data would also be used in such a service. Location data, also reflecting the position of tens or hundreds of millions of people, is also at a level of detail beyond what traditional databases could digest; but more than that, the half- life for this type of application is very short. Detail reflects not only the minuteness of the information but also the amount of time for which it has value.
How Has Technology Evolved to Support These Requirements?
Of course, most of the new capabilities are the result of a very dynamic technological base that has matured over the past decade and made them possible, but another way of looking at this is from the opposite direction. What is now required that has made these technologies necessary? For example, brute scale has made better compression essential even as the disk price, per megabyte, has come down dramatically. It has also made algorithms like map/ reduce and NoSQL databases necessary.
Following are some technology directions that both make big data pos-sible and will make many of the things in big data easier to accomplish:
• Data Stream Management: The velocity associated with big data often results in the influx of data from widely distributed sources that has more of the characteristics of a stream than of discrete transactions. In particular, the appropriate immediate processing is much like a filter. A set of algorithms is applied, usually in paral-lel, to quickly determine what to do with a particular piece of data, before it is passed on to a database or data warehouse for storage and further processing.
• NoSQL Databases: Since much of the actual data in new databases is not in the form of a set of character- based fields in a collection of relations, a number of more flexible data access languages have evolved. There is now a fairly large set of such languages competing to become standards.
• Bandwidth: The ability to move large amounts of data, especially video data, is dependent on the huge increases in bandwidth avail-able, not only in core networks but also in access to most endpoints, including mobile endpoints.
• Mobility/ Wireless: Mobile access to all forms of data, with high band-width, anywhere, anytime, dramatically increases both the supply and demand for data and information. In addition, wireless commu-nication makes many of the machine- to- machine commucommu-nications possible. There are many effective types of mobile access, including cellular, nomadic, and ad hoc networks.
• New forms of data (e.g., text, speech, video, image): Not only the availability of these types of data (they have been both available and digitized for a long time) but also the availability of technology to manipulate and analyze them have allowed the explosion in a variety of data. For example, data mining on speech data, at the scale of mil-lions of conversations per day, is now a reality and is used by many call service centers.
REDEFINING THE ORGANIZATION
Thinking about Redefining
analysis of single, sometimes large, data stores and was largely used for decision support and optimization within well- defined corporate silos. The current big data world has changed these communications patterns even more dramatically in terms of disintermediation, automation, and insight into the workings of processes. In this context, big data should be understood not primarily as being bigger or faster data sets than before, but as the ability to access, integrate, and process data that provides detail rich enough to impact business processes both qualitatively more deeply than before and as the process is running (i.e., in real time for that pro-cess). Size is often a characteristic of this data, but several industries such as credit card, telecom, and finance have been processing this size of data for many years and are still seeing dramatic changes due to big data. An obvious example is location data associated with cell phones, vehicles, or anything else that moves. That data, combined with other data, yields stunning insight into the patterns of behavior of communities, as well as the entities in them, not merely their transactions.
Let’s talk about how this is happening and how it will happen.
Some Challenges
We start by articulating the challenge presented by big data in terms of how we think about its use and value. Some of the technical challenges have been discussed in previous sections.
The fundamental challenge is pretty straightforward. Your competitors, current and potential, might be getting more value out of their data than you are—first in terms of restructuring the enterprise, becoming faster, and reducing cost; second in terms of making better decisions based on real, up- to- date information; and finally, among the leading edge, in terms of new products and new approaches to markets. Loosely put, the player who knows more about its markets and customers, sooner, and acts on that knowledge will usually win!
Some Opportunities
1. Feedback Control: Restructure the key processes that run the com-pany as tight feedback control processes. Don’t just make a bunch of new silos; create views that cross, optimized silos.
2. Latency of Information Access: Restructure the communication paths in the company to reflect the ability to get information quickly and accurately across barriers.
Before going into detail about reengineering, it is useful to think about the characteristics of big data that create opportunities today that did not exist previously. Clearly, it is not simply volume or velocity. These represent as much barriers to be overcome as they do opportunities. What is new and extremely powerful about big data as we see it today is the level of detail that it contains and the timeliness of that detail. As an example, consider the combination of location and activity data in real- time marketing. Currently, a lot of companies can track exactly what a consumer is doing online, very close to the time when they are doing it. This can result in pushing advertisements targeted exactly at the particular consumer and what he or she may be interested in at the time. What makes this work is the combination of very detailed data about web activity combined with exact knowledge of what the target is doing at exactly that moment. In the mobile world, one can add location data to that equation, allowing the targeting to be informed not only by what but by where. This would enable offering a coupon to your smart device as you are passing the store with the offer. Examples like this abound in marketing, healthcare, finance, and many other areas. The central concept in all of these examples is the avail-ability of data in extreme detail and in time to impact real-world events.
Restructuring Opportunities
expected time. That is a control feedback loop to monitor, and control if possible, the execution of each thread through the process.
There are many other examples, including provisioning in communica-tions services, providing intelligence products to the warfighter, and trials and manufacturing in pharmaceuticals. All are characterized by the fact that they look like very long- running (e.g., hours, days, months) transac-tions. They are also characterized by the fact that they typically cross a number of data and organizational silos, sometimes crossing databases in different companies. Provisioning in communication is a good example. It lies between sales/ ordering and maintenance/ billing, and its function is to make some service or network capability available to a customer. With modern electronics, many provisioning functions are fully automated and very quick—witness the provisioning of mobile service when you buy a cellular device. Others require physical activity, such as laying fiber in the ground, and can take months. Most are somewhere in between. All of them require the access and update of a number of databases, such as logical inventory (what IP addresses are available), physical inventory (what network facilities will be used, if any need to be updated), customer information (what does the customer already have, will there be conflicts), access to other companies (local number portability), and several others. As with any process, logical or physical, there is little reason to believe that the process is running perfectly as intended, for all transactions, without actually creating a feedback loop that ensures the correct completion of each transaction. Often this is simplified to “the same number of transac-tions leave as enter over some time period.” At large scale, the input/ output condition can be satisfied while many transactions are permanently hung up in the interior of the process. The goal is to be able to track each trans-action’s thread through the process, with alerts when any delays or errors occur, and feedback control at all points of data exchange. This raises a number of challenges, including the following:
• The amount of data typically gets very large, very quickly.
• In high- velocity and complex processes, it is unlikely that the con-trol part of the process can productively be handled by humans (too many) or that the root cause can be found in “real” (as defined by the customer) time. A patch control process will likely be needed. Sometimes this can be as simple as power cycle (i.e., restart the thread). Sometimes it will require default values to move forward.
How does this help in reengineering the company? First, it recognizes the fact that, though they are there for good reasons, silos are not the friend of complex, multi-silo processes. More than that, the solution is not to attempt to just make bigger silos. If the data systems are moderate in vol-ume and velocity, and homogeneous in technology and variety, one can think of creating a level of indirection that makes them appear to be a single federated database for corporate purposes. If the databases, individ-ually, represent big data, this will be very complex, and almost certainly suffer from poor, sometimes crippling, performance.
One approach to this problem uses what are essentially a combination of web and database technologies to create a “view” of the data that is as inte-grated as possible, but sometimes requires human intervention. The view is, for practical and performance reasons, virtual where possible, and mate-rialized if necessary. In typical operation, this integration would attempt to create, as accurately as possible given lack of consistent join capability, a thread for every transaction through a process and would use a rule set of alerts if any thread fails to perform as expected. In the best of cases, it would also execute some control procedures when such a failure is detected.
A second opportunity is to restructure the communication paths in the company to reflect the ability to get information quickly and accurately across barriers. This approach is as much about web and social networking technologies as it is about big data, but it reflects two facts:
1. The purpose of web and social networking technologies is, as was phone technology before them, to move information and/ or data (albeit some it used for entertainment) around the world, and to get it to the right place, at the right time, in the right form.
2. Though it doesn’t start with the letter “V,” latency is as important in the big data world as the three Vs. Latency is the delay in get-ting essential information to all people who can use it (and have a right to).
Most managers have experienced the desire to “spin” information that is going outside their control in an organization. The advent of web- oriented systems, service- oriented architectures, and interactive systems makes the justification for this very tenuous. Even under these conditions, if the pre-sentation is sufficiently opaque, or the delivery sporadic or delayed, there is de facto information hiding. In a big data world, where the data is as liberated as possible and the analysis and visualization automated, there is little justification for hiding from those with a right to the informa-tion. A real example, with a service that was fairly new, had a few million customers but was adding in the tens of thousands per business day. An interactive, visual analysis of the lift due to regional or national ads within a few hours was down from the previous days or weeks. This meant that each morning the product manager could see exactly what the evening advertising campaign was doing. As expected, this person was accustomed to reporting these facts a few levels up at the beginning of each week, and the higher levels would then convey to their peers. Once it became known that the data was available each morning, in an easy- to- use and interactive format, the traditional communication patterns broke down. The product manager was exposed to questions from several levels above upon getting in each morning. Decision turnaround was cut by an order of magnitude. Most importantly, the data was able to quickly reach levels of management who had the ability to manipulate the product and advertising strategy, and this was able to change in days, as opposed to weeks and months.
intraorganizational set of communities, though it is not clear yet how or what value it will have. It is clear that with the proper use of big, real- time information, they can form and can make a huge difference.
PREPARING FOR A BIG DATA WORLD
Science, Technology, Engineering, and Mathematics
It is clear that the ubiquity of data, and particularly of the very detailed, timely data associated with big data, will create demand for professionals to manage and manipulate the data, and for a population able to under-stand the uses and implications of the new data world. The shortage of people with deep analytical skills is estimated [3] as ranging from 140,000 to 190,000 in the United States alone. The same source estimates the short-age of data- aware manshort-agers and analysts to be roughly 1.5 million. This is the tip of the iceberg. As the benefits of big data permeate nearly every industry, they will also impact every enterprise and every consumer. This is already true for fields like retail, online advertising, finance, defense, healthcare, aerospace, and telecom, among other industries. The implica-tions to our economy, and the economy of every nation, are enormous.
The United States alone has far too many initiatives and approaches to the STEM education problem to enumerate here, many with impressive initial results, but too little evidence of which of these will have the critical properties of measurability, scalability, and sustainability. It is reasonable to discuss thought processes that may be of use. In the next section, we outline just a few.
RECOMMENDATIONS
1. Leverage expertise wherever possible. World- class use of the cur-rent volumes, velocities, and varieties of data is an inhecur-rently multi-disciplinary activity. Only a relatively small number of very deep scientists and engineers will be creating new, fundamental technol-ogy, but orders of magnitude more data scientists, domain experts, and informed users will be required to maximize the value of data. At AT&T Labs, a multi disciplinary research lab called InfoLab was created about 15 years ago to address opportunities in what is now called big data. It has observed over the intervening time a large list of useful techniques, technologies, and high- value results.
2. Leverage technology aggressively. The difference between force- fitting a technology and using the best available technology, at scale, can be huge. Think in terms of small, multi disciplinary teams (where small is a single- digit number), armed with the best technol-ogy available. Right now it is not clear what the winning tools across the big data landscape will be five years from now. It is clear that a revolution in the basic set of tools is appearing to address a variety of issues in this area. In this world, worry less about standards than productivity at scale. Ignore tools that don’t scale easily.
3. It’s all about the data! Initiate a proactive effort to make data easy for the teams to access. Experience indicates that getting the required data is often more than 75 percent of a data analysis effort, especially when real- time data is involved.
5. In your own interests, get involved in improving STEM education. There are many approaches to improving all levels of education. Some, such as use of virtual classrooms, inverting the learning model via online learning, seem very promising. Examples are mentoring pro-grams to increase retention in STEM, outreach to help minority and female students understand what STEM employees do, interaction with education partners on industries’ needs in the area, and investi-gation of online classes in big data. Most importantly, generate what-ever data you can on techniques and outcomes. Much of the current data in this space is anecdotal, and that will not be sufficient to make the needed progress.
In summary, the trends in terms of value and spread of data use guarantee rapid and broad increases, while the trends of skilled workers in these fields are not likely to keep up, at least in the short term. Proactive work to address your skill needs will pay disproportionately large dividends.
REFERENCES
1. Friedman, T., The World Is Flat—A Brief History of the 21st Century, Farrar, Strauss & Giroux, 2005.
2. Shim, Simon S.Y., The CAP Theorem’s Growing Impact, Computer, 45(2), February 2012.
3. McKinsey & Company, Big Data: The Next Frontier for Innovation, Competition, and Productivity, McKinsey Global Institute, Cambridge, May 2011.
4. Office of Science and Technology Policy, The White House, Report to the President:
Engage to Excel: Producing One Million Additional College Graduates with Degrees in Science, Technology, Engineering, and Mathematics, http://www.whitehouse.gov/ sites/ default/ files/ microsites/ ostp/ pcast- engage- to- excel- final_feb.pdf, February 2012. 5. TechAmerica Foundation, Recommendations for Education and the Advancement
of Learning (REAL) Agenda Commission: Taking Steps to Invest in Promise of Their Future and Ours, http://www.techamerica.org/ Docs/ fileManager.cfm?f=taf- real- report.pdf; April 2012.
21
2
Jack and the Big Data Beanstalk:
Capitalizing on a Growing
Marketing Opportunity
Tim Suther, Bill Burkart, and Jie Cheng
DO YOU KNOW JACK?
Had he lived in the twenty- first century, Jack—he of the beanstalk fame— perhaps would have been a C- suite marketing executive with a LinkedIn profile maxed out with connections and a résumé filled with genuine suc-cess stories. Consider his circumstances:
CONTENTS
Dismissing his mother’s directive to sell the family’s lone asset and instead acting off the vague promise of a funny- looking but convincing old man, he trades a cow- gone- dry for a handful of beans (textbook outside-
the- box thinking—the hallmark of any forward- thinking executive).
Jack’s mother, a conservative nineteenth-century pragmatist entrusted with providing food for her family, scorns Jack, sending him to bed with-out supper while casting the beans with-out the window.
Had Jack’s story ended there, his would have been the tale of an unremark-able corporate middling, one whose aspirations were tempered by immature overreach and miscalculation. But as we know, Jack’s story continues …
He awakes the next morning to find a giant beanstalk outside his win-dow. Seeking a reversal of fortune (and as any faithful Freudian would assume, his mother’s approval) he sets out on a blind journey, desperate to extract value from the massive growth.
discernible quid pro quo, mind you) while returning time and time again to gather gold coins, a golden- egg- laying goose, and other valuables.
Jack and the Beanstalk is a classic read for most of us and a perfect opportunity for parents to hone a repertoire of “fee- fi- fo- fum” variations. But for our purposes, it presents an apt metaphor that sums up nicely the challenges for twenty- first century corporations that seek to find genuine long- term success.
THE CHALLENGE: MEGA AND GIGA, MEET ZETTA
Companies today are overgrown with information, including what many categorize as big data. The jungle includes information about customers, competition, media and channel performance, locations, products, and transactions, to name just a few—data that in isolation presents a multi-tude of intimidating and bewildering options that can lead to poor deci-sion making, or worse, to inaction.
Just how big is big data? Nearly two zettabytes (a football stadium piled with magic beans to the upper deck or, more scientifically, about 500 bil-lion DVDs) of data were created in 2011, the fifth consecutive year the amount exceeded our ability to store it.
But, it’s more complicated than simply volume; the nature of the data
has dramatically changed. Two other V words—variety and velocity—
are used to describe big data, and they are wreaking havoc as well. Some analysts believe that multistructured data, like images, videos, and social chatter, now represents 80–90 percent of the total data output.* The value of some data, like “intent to buy,” can be fleeting, so the ability to process in real time is important. And, the quality of much digital data is suspect, caused by the inadequacies of cookies. The bottom line? Most of today’s information systems are not designed for the three Vs of big data, leaving marketers to feel overwhelmed by the tsunami of data. Taming big data means redesigning these systems.
Meanwhile, an interesting paradox has emerged for marketers: The number of ways to reach consumers has never been more; they can check in, “like,” pin, and follow, in addition to a host of traditional marketing options. But amazingly, despite all these new tools, it has never been more difficult to engage consumers—to have a meaningful, trust- building
con-versation. Consumers truly are boss, choosing when, where, how, and if
they engage with brands.
Consumers skip or even block ads and flit between mediums. Television viewing used to be the tribal campfire for families, but now television seems to be just another light source among many. Research indicates that consumers with tablets are usually doing something disconnected from what’s in front of them on TV. As viewing evolves from one screen to many simultaneously, marketers are left to play a cat- and- mouse game, struggling to determine the impact of an individual marketing impres-sion. It’s enough to spin even Jack’s head.
to reach 60 percent. Fifteen years ago, 40 percent of impressions would be concentrated on the top 20 percent of heaviest TV viewers. Now it’s 60–80 percent. Twenty years ago, there were 28 TV channels. Today, there are more than 165 channels. Today, it takes 405 spots to deliver the equiva-lent media weight of one spot from 15 to 20 years ago.*
And of course, while consuming information, consumers are busy cre-ating their own, with photos, reviews, calls, texts, likes, follows, pins, check- ins, pings, and tweets, among many others. Indeed, last year, U.S. consumers were busier than Jack’s new army of gold- counting accoun-tants: Each minute on the Internet yielded 700,000 Google search queries and 48 hours of new video uploaded by YouTube users, and Facebook users shared 674,478 pieces of content.† That’s each minute—every 60 seconds.
This vast and rapidly expanding pool of data has also created an ever- widening gap between those who view data as an asset and those who don’t. In particular, while technology and some media companies have amassed enormous value, most brands have yet to tap into big data’s value. As a result, margins are under assault and loyalty has fallen sharply.
Research reveals that just 25 percent of consumers are very loyal today, while another 25 percent exhibit no loyalty at all.‡ And nearly all brand measurements are down, including awareness (down 20 percent), trust (down 50 percent), and esteem (down 12 percent).§
* http://www.simulmedia.com/2012/04/simulmedia- investors- fund- new-6-million- round/
† http://www.domo.com/ blog/2012/06/how- much- data- is- created- every- minute/
‡ http://www.accenture.com/ us- en/ Pages/ insight- acn- global- consumer- research- study.aspx
§ http://www.amazon.com/ Brand- Bubble- Looming- Crisis- Value/ dp/047018387X/ ref=sr_1_1?ie=
Some, however, are enjoying huge financial success by leveraging the value from big data. Among the top 10 most valuable companies worldwide,* at least five—Apple, Microsoft, IBM, China Mobile, and AT&T—have created major value through the strategic use of big data. Moreover, venture capi-talists have invested another $2.5 billion into big data in the last year alone.† They clearly recognize, as do we, that data is on par with labor and capital in its ability to generate value.
Intriguingly, most of the value generated by data to date has been used by selling advertising better to brands—but very little has been used to help brands buy and execute advertising better. As a result, many of these data- fueled innovations are proving disruptive to traditional business models.
During the 2011 holiday season, Amazon made news with its Price Check app, which allows consumers to scan barcodes on products in local stores and instantly compare prices with those on Amazon’s website. For a limited time, consumers who made a purchase through the app, thus aban-doning their local retailer, received a $5 discount on purchases (up to $15.) Even without a discount incentive, consumers were already honing their “showrooming” skills. According to Forrester Research, consumers who are in the store ready to buy abandon a purchase for two primary rea-sons: they found the item cheaper online or found a better deal down the street.‡ Consumers were always sensitive to price; now smartphones and an app make it easy (and fun) to compare prices and locate merchandise elsewhere. (Did we already mention consumer loyalty is in rapid decline?)
The example underscores what’s at stake for brands: the need to engage more intelligently with consumers in an always- on, connected way. Yes, brands need to developreal- time insights—to help them better anticipate and serve customers. But, developing insights alone won’t be sustaining. Brands need alsoto control those insights.
It’s curious; while every brand is actively exploring how to better use data, few are taking sufficient steps to protect the insights they generate. For sure, brands have elaborate information technology security to ward off cybercriminals. Instead, a brand’s data rights (particularly the data generated in marketing and advertising) need more protection. In fact, in many cases, brands are actually inadvertently giving this data away.
* http://ycharts.com/ rankings/ market_cap
† http://www.itworld.com/ big- datahadoop/287477/big- data- bringing- down- big- bucks- venture-
capitalists
‡ Understanding Shopping Cart Abandonment, Forrester Research, May 2010.
For instance, using a media buying “trading desk” can appear to add inexpensive reach, but it could come at a steep price if the brand fails to receive data that customers generate from using the service. That data pro-vides clues to future customer interests and value, and the response behavior helps determine whether or not marketing campaigns are actually working.
More ominously, many services (not limited to trading desks) use that data to create proprietary profiles of customer behavior, which in turn are used to provide service to others, potentially including the original brand’s competitors. For some services, the data is actually auctioned to the highest bidder. No brand wants its proprietary insight to help its com-petition, yet inattentiveness allows that to happen.
OLD IS NEW
The challenge—managing data—is not new. It began when smart, usually large companies recognized the inefficiency in maintaining disparate cus-tomer databases for nearly every activity.
Developing and implementing sophisticated (at the time) algorithms, these companies began targeting their marketing more precisely, often to specific households. They began to connect transactions to customers to products to marketing activity to value generated, planting the “beans” for data- driven marketing.
We see today’s challenge as similar, albeit more complex. Companies still need to manage across customer databases and build richer customer views, but cultivating meaningful insights is not as simple as merging newly aggregated data into existing databases. The sheer volume of big data overwhelms traditional systems. Additionally, privacy sensitivities require thinking more strategically about what data is captured and how it’s used.
The challenges are great, but companies must take concrete, fundamen-tal steps to survive and prosper against such formidable odds.
THE POWER OF FIVE
One: Get Multidimensional
As some companies have proven, data can unlock enormous value. But