For your convenience Apress has placed some of the front
matter material after the index. Please use the Bookmarks
and Contents at a Glance links to access them.
Contents at a Glance
Chapter 3: Processing and Analyzing the Data
■
...
31
Chapter 7: Using Log Files To Create Advanced Analytics
■
...
127
Chapter 8: The Airline On-Time Performance Project
■
...
139
Chapter 9: Getting the Flight Data into Splunk
■
...
143
Chapter 10: Analyzing Airlines, Airports, Flights, and Delays
■
...
161
Chapter 11: Analyzing a Specific Flight Over the Years
■ CONTENTS AT A GLANCE
Chapter 15: Remote Data Collection
■
...
283
Chapter 16: Scaling and High Availability
■
...
295
Appendix A: The Performance of Splunk
■
...
307
Appendix B: Useful Splunk Apps
■
...
323
Big Data and Splunk
In this introductory chapter we will discuss what big data is and different ways (including Splunk) to process big data.
What Is Big Data?
Big data is, admittedly, an overhyped buzzword used by software and hardware companies to boost their sales. Behind the hype, however, there is a real and extremely important technology trend with impressive business potential. Although big data is often associated with social media, we will show that it is about much more than that. Before we venture into definitions, however, let’s have a look at some facts about big data.
Back in 2001, Doug Laney from Meta Group (an IT research company acquired by Gartner in 2005) wrote a research paper in which he stated that e-commerce had exploded data management along three dimensions: volumes, velocity, and variety. These are called the three Vs of big data and, as you would expect, a number of vendors have added more Vs to their own definitions.
Volume is the first thought that comes with big data: the big part. Some experts consider Petabytes the starting point of big data. As we generate more and more data, we are sure this starting point will keep growing. However, volume in itself is not a perfect criterion of big data, as we feel that the other two Vs have a more direct impact.
Velocity refers to the speed at which the data is being generated or the frequency with which it is delivered. Think of the stream of data coming from the sensors in the highways in the Los Angeles area, or the video cameras in some airports that scan and process faces in a crowd. There is also the click stream data of popular e-commerce web sites.
Variety is about all the different data and file types that are available. Just think about the music files in the iTunes store (about 28 million songs and over 30 billion downloads), or the movies in Netflix (over 75,000), the articles in the New York Times web site (more than 13 million starting in 1851), tweets (over 500 million every day), foursquare check-ins with geolocation data (over five million every day), and then you have all the different log files produced by any system that has a computer embedded. When you combine these three Vs, you will start to get a more complete picture of what big data is all about.
Another characteristic usually associated with big data is that the data is unstructured. We are of the opinion that there is no such thing as unstructured data. We think the confusion stems from a common belief that if data cannot conform to a predefined format, model, or schema, then it is considered unstructured.
An e-mail message is typically used as an example of unstructured data; whereas the body of the e-mail could be considered unstructured, it is part of a well-defined structure that follows the specifications of RFC-2822, and contains a set of fields that include From, To, Subject, and Date. This is the same for Twitter messages, in which the body of the message, or tweet, can be considered unstructured as well as part of a well-defined structure.
CHAPTER 1 ■ BIG DATA AND SPLUNK
Relational databases impose the need for predefined data models with clearly defined fields that live in tables, which can have relations between them. We call this Early Structure Binding, in which you have to know in advance what questions are to be asked of the data, so that you can design the schema or structure and then work with the data to answer them.
As big data tends to be associated with social media feeds that are seen as text-heavy, it is easy to understand why people associate the term unstructured with big data. From our perspective, multistructured is probably a more accurate description, as big data can contain a variety of formats (the third V of the three Vs).
It would be unfair to insist that big data is limited to so-called unstructured data. Structured data can also be considered big data, especially the data that languishes in secondary storage hoping to make it some day to the data warehouse to be analyzed and expose all the golden nuggets it contains. The main reason this kind of data is usually ignored is because of its sheer volume, which typically exceeds the capacity of data warehouses based on relational databases.
At this point, we can introduce the definition that Gartner, an Information Technology (IT) consultancy, proposed in 2012: “Big data are high volume, high velocity, and/or high variety information assets that require new forms of processing to enable enhanced decision making, insight discovery and processes optimization.” We like this definition, because it focuses not only on the actual data but also on the way that big data is processed. Later in this book, we will get into more detail on this.
We also like to categorize big data, as we feel that this enhances understanding. From our perspective, big data can be broken down into two broad categories: human-generated digital footprints and machine data. As our interactions on the Internet keep growing, our digital footprint keeps increasing. Even though we interact on a daily basis with digital systems, most people do not realize how much information even trivial clicks or interactions leave behind. We must confess that before we started to read Internet statistics, the only large numbers we were familiar with were the McDonald’s slogan “Billions and Billions Served” and the occasional exposure to U.S. politicians talking about budgets or deficits in the order of trillions. Just to give you an idea, we present a few Internet statistics that show the size of our digital footprint. We are well aware that they are obsolete as we write them, but here they are anyway:
By February 2013, Facebook had more than one billion users, of which 618 million were •
active on a daily basis. They shared 2.5 billion items and “liked” other 2.7 billion every day, generating more than 500 terabytes of new data on a daily basis.
In March 2013, LinkedIn, which is a business-oriented social networking site, had more than •
200 million members, growing at the rate of two new members every second, which generated 5.7 billion professionally oriented searches in 2012.
Photos are a hot subject, as most people have a mobile phone that includes a camera. The •
numbers are mind-boggling. Instagram users upload 40 million photos a day, like 8,500 of them every second, and create about 1,000 comments per second. On Facebook, photos are uploaded at the rate of 300 million per day, which is about seven petabytes worth of data a month. By January 2013, Facebook was storing 240 billion photos.
Twitter has 500 million users, growing at the rate of 150,000 every day, with over 200 million •
of the users being active. In October 2012, they had 500 million tweets a day.
Foursquare celebrated three billion check-ins in January 2013, with about five million •
check-ins a day from over 25 million users that had created 30 million tips.
On the blog front, WordPress, a popular blogging platform reported in March 2013 almost •
40 million new posts and 42 million comments per month, with more than 388 million people viewing more than 3.6 billion pages per month. Tumblr, another popular blogging platform, also reported, in March 2013, a total of almost 100 million blogs that contain more than 44 billion posts. A typical day at Tumblr at the time had 74 million blog posts.
Pandora, a personalized Internet radio, reported that in 2012 their users listened to 13 billion •
In similar fashion, Netflix announced their users had viewed one billion hours of videos in July •
2012, which translated to about 30 percent of the Internet traffic in the United States. As if that is not enough, in March 2013, YouTube reported more than four billion hours watched per month and 72 hours of video uploaded every minute.
In March 2013, there were almost 145 million Internet domains, of which about 108 million •
used the famous “.com” top level domain. This is a very active space; on March 21, there were 167,698 new and 128,866 deleted domains, for a net growth of 38,832 new domains.
In the more mundane e-mail world, Bob Al-Greene at Mashable reported in November 2012 •
that there are over 144 billion e-mail messages sent every day, with about 61 percent of them from businesses. The lead e-mail provider is Gmail, with 425 million active users.
Reviewing these statistics, there is no doubt that the human-generated digital footprint is huge. You can quickly identify the three Vs; to give you an idea of how big data can have an impact on the economy, we share the announcement Yelp, a user-based review site, made in January 2013, when they had 100 million unique visitors and over one million reviews: “A survey of business owners on Yelp reported that, on average, customers across all categories surveyed spend $101.59 in their first visit. That’s everything from hiring a roofer to buying a new mattress and even your morning cup of joe. If each of those 100 million unique visitors spent $100 at a local business in January, Yelp would have influenced over $10 billion in local commerce.”
We will not bore you by sharing statistics based on every minute or every second of the day in the life of the Internet. However, a couple of examples of big data in action that you might relate with can consolidate the notion; the recommendations you get when you are visiting the Amazon web site or considering a movie in Netflix, are based on big data analytics the same way that Walmart uses it to identify customer preferences on a regional basis and stock their stores accordingly. By now you must have a pretty good idea of the amount of data our digital footprint creates and the impact that it has in the economy and society in general. Social media is just one component of big data.
The second category of big data is machine data. There is a very large number of firewalls, load balancers, routers, switches, and computers that support our digital footprint. All of these systems generate log files, ranging from security and audit log files to web site log files that describe what a visitor has done, including the infamous abandoned shopping carts.
It is almost impossible to find out how many servers are needed to support our digital footprint, as all companies are extremely secretive on the subject. Many experts have tried to calculate this number for the most visible
companies, such as Google, Facebook, and Amazon, based on power usage, which (according to a Power Usage Effectiveness indicator that some of these companies are willing to share) can provide some insight as to the number of servers they have in their data centers. Based on this, James Hamilton in a blog post of August 2012 published server estimates conjecturing that Facebook had 180,900 servers and Google had over one million servers. Other experts state that Amazon had about 500 million servers in March 2012. In September 2012, the New York Times ran a provocative article that claimed that there are tens of thousands of data centers in the United States, which consume roughly 2 percent of all electricity used in the country, of which 90 percent or more goes to waste, as the servers are not really being used.
We can only guess that the number of active servers around the world is in the millions. When you add to this all the other typical data center infrastructure components, such as firewalls, load balancers, routers, switches, and many others, which also generate log files, you can see that there is a lot of machine data generated in the form of log files by the infrastructure that supports our digital footprint.
CHAPTER 1 ■ BIG DATA AND SPLUNK
In addition to the machine data that we have described so far, there are also sensors that capture data on a real-time basis. Most industrial equipment has built-in sensors that produce a large amount of data. For example, a blade in a gas turbine used to generate electricity creates 520 Gigabytes a day, and there are 20 blades in one of these turbines. An airplane on a transatlantic flight produces several Terabytes of data, which can be used to streamline maintenance operations, improve safety, and (most important to an airline’s bottom line) decrease fuel consumption.
Another interesting example comes from the Nissan Leaf, an all-electric car. It has a system called CARWINGS, which not only offers the traditional telematics service and a smartphone app to control all aspects of the car but wirelessly transmits vehicle statistics to a central server. Each Leaf owner can track their driving efficiency and compare their energy economy with that of other Leaf drivers. We don’t know the details of the information that Nissan is collecting from the Leaf models and what they do with it, but we can definitely see the three Vs in action in this example.
In general, sensor-based data falls into the industrial big data category, although lately the “Internet of Things” has become a more popular term to describe a hyperconnected world of things with sensors, where there are over 300 million connected devices that range from electrical meters to vending machines. We will not be covering this category of big data in this book, but the methodology and techniques described here can easily be applied to industrial big data analytics.
Alternate Data Processing Techniques
Big data is not only about the data, it is also about alternative data processing techniques that can better handle the three Vs as they increase their values. The traditional relational database is well known for the following characteristics:
Transactional support for the ACID properties: •
Atomicity: Where all changes are done as if they are a single operation. •
Consistency: At the end of any transaction, the system is in a valid state. •
Isolation: The actions to create the results appear to have been done sequentially, •
one at a time.
Durability: All the changes made to the system are permanent. •
The response times are usually in the subsecond range, while handling thousands of •
interactive users.
The data size is in the order of Terabytes. •
Typically uses the SQL-92 standard as the main programming language. •
In general, relational databases cannot handle the three Vs well. Because of this, many different approaches have been created to tackle the inherent problems that the three Vs present. These approaches sacrifice one or more of the ACID properties, and sometimes all of them, in exchange for ways to handle scalability for big volumes, velocity, or variety. Some of these alternate approaches will also forgo fast response times or the ability to handle a high number of simultaneous users in favor of addressing one or more of the three Vs.
The open source Hadoop software framework is probably the one that has the biggest name recognition in the big data world, but it is by no means alone. As a framework it includes a number of components designed to solve the issues associated with distributed data storage, retrieval and analysis of big data. It does this by offering two basic functionalities designed to work on a cluster of commodity servers:
A distributed file system called HDFS that not only stores data but also replicates it so that it is •
always available.
A distributed processing system for parallelizable problems called MapReduce, which is a •
two-step approach. In the first step or Map, a problem is broken down into many small ones and sent to servers for processing. In the second step or Reduce, the results of the Map step are combined to create the final results of the original problem.
Some of the other components of Hadoop, generally referred to as the Hadoop ecosystem, include Hive, which is a higher level of abstraction of the basic functionalities offered by Hadoop. Hive is a data warehouse system in which the user can specify instructions using the SQL-92 standard and these get converted to MapReduce tasks. Pig is another high-level abstraction of Hadoop that has a similar functionality to Hive, but it uses a programming language called Pig Latin, which is more oriented to data flows.
HBase is another component of the Hadoop ecosystem, which implements Google’s Bigtable data store. Bigtable is a distributed, persistent multidimensional sorted map. Elements in the map are an uninterpreted array of bytes, which are indexed by a row key, a column key, and a timestamp.
There are other components in the Hadoop ecosystem, but we will not delve into them. We must tell you that in addition to the official Apache project, Hadoop solutions are offered by companies such as Cloudera and Hortonworks, which offer open source implementations with commercial add-ons mainly focused on cluster management. MapR is a company that offers a commercial implementation of Hadoop, for which it claims higher performance.
Other popular products in the big data world include:
Cassandra, an Apache open source project, is a key-value store that offers linear scalability •
and fault tolerance on commodity hardware.
DynamoDB, an Amazon Web Services offering, is very similar to Cassandra. •
MongoDB, an open source project, is a document database that provides high performance, •
fault tolerance, and easy scalability.
CouchDB, another open source document database that is distributed and fault tolerant. •
In addition to these products, there are many companies offering their own solutions that deal in different ways with the three Vs.
What Is Splunk?
Technically speaking, Splunk is a time-series indexer, but to simplify things we will just say that it is a product that takes care of the three Vs very well. Whereas most of the products that we described earlier had their origins in processing human-generated digital footprints, Splunk started as a product designed to process machine data. Because of these humble beginnings, Splunk is not always considered a player in big data. But that should not prevent you from using it to analyze big data belonging in the digital footprint category, because, as this book shows, Splunk does a great job of it. Splunk has three main functionalities:
Data collection, which can be done for static data or by monitoring changes and additions •
CHAPTER 1 ■ BIG DATA AND SPLUNK
Data indexing, in which the collected data is broken down into events, roughly equivalent to •
database records, or simply lines of data. Then the data is processed and a high performance index is updated, which points to the stored data.
Search and analysis. Using the Splunk Processing Language, you are able to search for data •
and manipulate it to obtain the desired results, whether in the form of reports or alerts. The results can be presented as individual events, tables, or charts.
Each one of these functionalities can scale independently; for example, the data collection component can scale to handle hundreds of thousands of servers. The data indexing functionality can scale to a large number of servers, which can be configured as distributed peers, and, if necessary, with a high availability option to transparently handle fault tolerance. The search heads, as the servers dedicated to the search and analysis functionality are known, can also scale to as many as needed. Additionally, each of these functionalities can be arranged in such a way that they can be optimized to accommodate geographical locations, time zones, data centers, or any other requirements. Splunk is so flexible regarding scalability that you can start with a single instance of the product running on your laptop and grow from there.
You can interact with Splunk by using SplunkWeb, the browser-based user interface, or directly using the command line interface (CLI). Splunk is flexible in that it can run on Windows or just about any variation of Unix.
Splunk is also a platform that can be used to develop applications to handle big data analytics. It has a powerful set of APIs that can be used with Python, Java, JavaScript, Ruby, PHP, and C#. The development of apps on top of Splunk is beyond the scope of this book; however, we do describe how to use some of the popular apps that are freely available. We will leave it at that, as all the rest of the book is about Splunk.
About This Book
We have a couple of objectives with this book. The first one is to provide you with enough knowledge to become a data wrangler so that you can extract wisdom from data. The second objective is that you learn how to use Splunk, a simple yet extremely powerful tool that will allow you to “click for gold” in the data you analyze.
The book has been designed so that you become exposed to big data from digital footprints and machine data. It starts by presenting simple concepts and progressively introducing slightly more difficult approaches. It is meant to be a hands-on guide for big data analytic projects that involve machine data, social media, and mining existing data warehouses. We do this through real projects, which review in detail how to collect data, load it into Splunk, process and analyze it, and visualize the results so that they can be easily consumed by the intended audience. We have broken the book into four parts:
Splunk’s Basic Operation, in which we introduce basic data collection, processing, analysis, •
and visualization of results. We use machine data in this part of the book to introduce you to the basic commands of the Splunk Processing Language. The last chapter in this part presents a way to create advanced analytics using log files.
The airline on-time performance project. Once you are familiar with the basic concepts and •
The third part of the book is dedicated to social media. We go in detail into how to collect, •
process, and analyze tweets and Foursquare check-ins, as well as providing a full chapter dedicated to sentiment analysis. These chapters provide you with the necessary knowledge to wrangle any big data project that involves a social media stream.
The fourth part of the book goes into detail on the architecture and topology of Splunk: how •
to scale Splunk to cover your needs, and the basic concepts of distributed processing and high availability.
We also included a couple of appendices that cover the performance of Splunk as well as a •
quick overview of the various apps that are available.
The book is not meant to describe in detail each of the commands of Splunk, as the company’s online documentation is very good and it does not make sense to repeat it. Our focus is on hands-on big data projects through which you can learn how to use Splunk and also become versed on handling big data projects. The book has been designed so that you can go directly to any chapter and be able to work with it without having to refer to previous chapters. Having said that, if you are new to Splunk, you will benefit from reading the book from the beginning. If you do read the book that way, you might find some of the information related to collecting the data and installing apps repetitive, as we have targeted the material to those who wish to jump directly into specific chapters.
Note
■
The searches presented in this book have been formatted to make them more readable. SplunkWeb, the user
interface of Splunk, expects the searches as a single continuous line.
All of the data used in the book is available in the download package, either as raw data, as programs that create it or collect it, or as links where you can download it. This way you are able to participate in the projects as you read the book.
CHAPTER 2
Getting Data into Splunk
In this chapter, you will learn how to get the data into Splunk. We will look at different sources of data and different ways of getting them into Splunk. We will make use of a data generator to create user activity for a fictitious online retail store MyGizmoStore.com, and we will load sample data into Splunk. You will also learn how Splunk Technology Add-ons provide value with some specific sources of data from operating systems such as Windows and Unix. Before wrapping up the chapter, you will get an overview of the Splunk forwarders concept to understand how to load remote data into Splunk.
Variety of Data
A typical enterprise information technology (IT) infrastructure today consists of network and server components that could range from mainframes to distributed servers. On top of that hardware infrastructure you will find databases that store information about transactions related to customers, vendors, orders, shipping, supply chain, and so on. These are captured, processed, and analyzed by several types of business applications. Traditionally, enterprises have used all this structured data to make their business decisions. The challenge has been mainly in integrating and making sense of all the data that comes from so many different sources. Whereas this has been the focus of the traditional IT organizations, we are seeing the definition of data and usage of data going beyond that traditional model. Most enterprises these days want to process and analyze data, which could fall in broad categories such as:
Traditional structured data that is residing in databases or data warehouses •
Unstructured data or documents stored in content repositories •
Multistructured data available in different types of logs •
Clickstream data •
Network data •
Data originated by social media applications, and so on •
You can see these newer categories of data such as logs, network, clickstream, and social media becoming part of the mainstream data analysis done by enterprises to make better business decisions. These types of data are sometimes also known as machine data or operational data. Some of the typical examples of enterprises wanting to make use of these types of data sources include:
Web log files, which are created by web servers such as Apache and IIS. These log files provide •
information about the different types of activity happening on the web sites and the associated applications.
Clickstream data files provide information down to the detail of what visitors have done while •
Application log data, which typically has have plenty of information about the execution of •
applications, that can be used for operational purposes, such as optimizing the use of servers. Operating system level logs that could be used for performance and system monitoring. •
Firewall logs to better analyze security issues. •
Data from social media sources such as Twitter, Foursquare, and so on, which can be used for •
a myriad of marketing and sales purposes.
Gone are the days when machine data or log data was considered to be something for system administrators, who are sitting in dark data centers to debug and analyze why the systems went down or why the performance is not meeting the Service Level Agreements (SLAs). Although that use case is still valid, there is a complete paradigm shift on what data enterprises want to look at, process, and analyze for real-time, near real-time, or traditional business intelligence and reporting. The question now is, can Splunk handle all these sources of machine data or operational data and work with traditional data sources such as databases and data warehouses? The short answer is yes, and we will learn how we can get the data into Splunk in the following sections of this chapter.
How Splunk deals with a variety of data
For any practical purpose, Splunk can deal with pretty much any type of data coming from a wide variety of different sources including web logs, application logs, network feeds, system metrics, structured data from databases, social data, and so on. Splunk needs to be configured with individual sources of data and that each source can become a specific data input. The data coming into Splunk can be local, meaning that the data is sitting or available on the same computer where Splunk is running, or the data can be coming from any remote device connected to the server(s) running Splunk. You will see how remote data can be loaded into Splunk later in this chapter. Splunk broadly categorizes the sources of data that can be loaded as:
Files & Directories
You will look into each one of these sources in detail. Splunk provides different options to define and configure the above sources as data inputs:
Splunk Web—This is the standard user interface, which is the easiest way to interact with •
Splunk.
Splunk CLI—The command line interface (CLI) can also be used to interact with Splunk, but it •
is used mainly by scripted programs, which could handle batch processes.
Apps or Add-ons—These are specialized applications that sit on top of the Splunk framework •
and make it easy to work with one or more types of data sources. We will discuss the differences between Apps and Add-ons and how they can be used with an example later in this chapter.
Configuration files—Splunk provides various configuration files that can be edited to configure •
CHAPTER 2 ■ GETTING DATA INTO SPLUNK
Independently of which option you chose to work with Splunk, the definition and configuration of data inputs is ultimately stored in the configuration files. For the examples in this book, we will be using Splunk Web, the user interface. One of the most popular forms of machine or log data, widely analyzed by enterprises, comprises web logs, or access logs as they are also known. We will use web logs as a starting point to explore and get familiar with what can be done with Splunk. In order to simulate to what would happen in a real-world online web application, we have created a fictitious ecommerce web site called MyGizmoStore.com, which sells widgets. The data for MyGizmoStore.com is created by a generator, which is described later in this chapter. This generator simulates the log files created by typical user activity, which includes browsing the catalog of widgets, adding to the shopping cart and potentially making the final purchase.
Files & Directories
Splunk makes it very easy to get data from files or files stored within a directory structure. You can load data from a static file as a one-time operation, also known as a oneshot, or you can ask Splunk to monitor a set of directories for certain types of files. We start by loading a single file. In order to make this easy we have generated an access log for MyGizmoStore.com that has approximately 250 log entries, which represent user activity over a period of two days in the life of the store. The file access.log is part of the download package of the book. Once you have the download package, copy the access.log file to the directory /opt in case of Linux, or C:\opt in case of Windows.
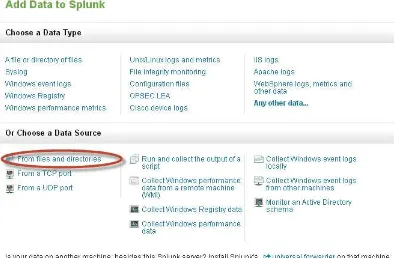
Splunk will give you the option of adding data based on the type or the source of the data. For this initial example, we will work with a source, the access log file. Once you have logged into the Splunk instance, go to the Splunk home page and click on “Add data” button in the “Do more with Splunk” section. In the Add Data to Splunk page you will see different options are available under two categories.
Choose a Data Type—allows to select a pre-determined type of logs such as access logs, sys •
logs etc.
Choose a Data Source—allows to bind determined type of sources such as windows registry •
data or get an output from a script which will be a data input into Splunk.
This will take you into the Data preview page, as seen in Figure 2-2. Because this is the first time that we are loading the data into Splunk, it makes sense to get a preview of the data. The preview option provides an opportunity to see how the log entries are going to get processed before they are committed into the Splunk data store, which is called index. Next you select the “Preview data before indexing” radio button and choose the access.log file under \opt directory if you are on Linux or C:\opt if you are in Windows environment. Then click on the Continue button.
CHAPTER 2 ■ GETTING DATA INTO SPLUNK
The dialog box that comes up gives you options to set the source type. By default Splunk parses the data files provided as input and determines what the source type for the file is. It then loads or indexes the file according to the source type characteristics. In this case, because we are loading an access log file, which has been identified as a combined access log file, we accept the default option of “Use auto-detected source type” as seen in Figure 2-3 and click the Continue button. In Chapter 3, we will explain in detail the format of an access combined log file and what information is stored in the log entries. In Chapter 9, we will review other options such as defining the input of custom data files, which needs to be processed differently.
What are typically known as records, or just plain lines of data, are referred to in Splunk as events, and every event has a timestamp. Throughout the book we will be using, analyzing, and manipulating timestamps as they are a key element of Splunk and big data analysis. The next screen in the data loading process presents the way Splunk has broken down the log entries into different events along with associated timestamps. The default behavior is
Figure 2-2. Preview data
to break an event on the timestamp, but if Splunk cannot find the timestamp it will present one single event that contains all the lines of the file. We can then customize where to break the entries into different events, which we will learn in Chapter 9. In this case, Splunk breaks down very nicely the entries of the access log into events as can be seen in Figure 2-4. Here you can see that each event has the information about a user activity that happened on MyGizmoStore.com. The preview option also shows the number of events extracted from the log file, which in this case contains 243 events.
Note
■
If you are familiar with relational database concepts, it may help to realize that each event broken down by
Splunk is conceptually equal to a single row in a relational database table.
Now that we have confirmed that the data looks good and has been processed correctly by Splunk, you can click on the Continue button, which will take us to the “Add new” page, where we will customize some of the settings before we get the data finally indexed into Splunk. Because this is a one-time file processing operation, we will select the “Index a file once from this Splunk server” radio button under Source. Because our computer has a rather complex name, we also chose to change the Host file value to BigDBook-Test.
In the previous step, we asked Splunk to automatically determine the sourcetype, so we will see the sourcetype is set to automatic. By default, when data is loaded into Splunk it goes into the main index, which is the mechanism used to store, process, and analyze data. Splunk also offers the ability to define and use other indexes, which can help you better organize and manage your data, especially regarding data governance, such as access, protection, and retention policies. For this example, we will use the main, but we will see how to create a new one and make use of it in the next section. Click on the Save button. The next page shows a Success message if Splunk is able to process the
CHAPTER 2 ■ GETTING DATA INTO SPLUNK
Note
■
If you are familiar with schemas in Oracle, the Splunk index is very similar to that concept. An index in Splunk
is a collection of data, and a schema has a collection of tables with the data.
Once Splunk indexes the data successfully, you can start to review it to make sure it was done correctly. To list all the log entries that were loaded into Splunk we type host=BigDBook-Test in the search bar and hit enter. This search gives complete listing of all events along with the default fields, which are the timestamp, the host from where the data comes, the source type and the source of the data. Splunk will always have those fields available. In Figure 2-5, you can see that the total count is 243 events, which is the same number of log entries we had in the file we just indexed. You can also see the timestamp to the left side of each event and the other three default fields presented below each event.
When individual sources of data in large volumes are ingested into Splunk they can be better managed with separate indexes, which could be placed on different tiers of storage. We will go ahead and create a separate index for the MyGizmoStore.com log files. To create an index click on the “Manager” menu item on the upper right corner of the user interface and in the Data section click on the “Indexes” link as shown in Figure 2-6.
In the Indexes page, click on the New button and name the index mygizmostoreindex. You can ignore the cold and thawed path options of the form. They are advanced options that can be used to move older or unused data in a Splunk index to, for example, lower cost storage. It also provides the capabilities to archive data outside of Splunk using the concept of a frozen archive path. In our case, we will leave these options at their defaults as the simulated data set is not going to be massive. Click on the Save button. Once the new index has been created successfully, it will show up in the indexes page as shown in Figure 2-7.
Figure 2-6. Index creation
CHAPTER 2 ■ GETTING DATA INTO SPLUNK
What we have seen so far is how to get data into Splunk using one-time file indexing. In real-world use cases, we would be seeing that log files are being continuously updated with new entries, and these expanded log files need to be processed and analyzed on a continuous basis. This is where Splunk provides the ability to monitor certain directories where files are being continuously updated. Splunk’s directory monitoring capability lets us specify the directory that needs to be monitored and the files in that directory will be used as data input. Before we explore the monitoring option, let us go back to MyGizmoStore.com one more time. We have used a static log file from the online store to see how we can get that kind of data into Splunk. In the real-world MyGizmoStore.com would probably be running on multiple web servers on different hosts and writing out log files which need to be monitored, processed, and analyzed on a continuous basis.
To simulate this behavior we have come up with a test data generator to generate log files for MyGizmoStore.com. We will review how the test data generator operates and how we can start generating the data.
Data Generator
The sample data generator is written using the Python scripting language. It is designed to run on both Microsoft Windows and Linux operating systems. The sample data generator uses a random generator to create random IP addresses, which point to the visitor of the web site; a predetermined set of product identification codes that look like “CA-NY-99” and item identification codes in the form of HYD-19. The gizmos sold on the store can be categorized as follows:
The visitors to the web site can perform the following actions: Purchase
•
Add an item to the shopping cart (Addtocart) •
Remove an item from the shopping cart (Remove) •
View the catalog of gizmos (View) •
Change the quantity of an item in the shopping cart (Changequantity) •
The HTTP protocol used by web sites includes a return code that either signifies success in the operation or describes a problem. The code 200 indicates a successful operation, whereas codes in the 400s and 500s indicate some sort of a problem. The data generator creates a realistic percentage of error codes. Additionally, the generator includes a random selection of user agents. These are a fancy name for the description of the combination of the browser and operating system used by the visitors, which also include the version number of both.
Mozilla/4.0 (compatible; MSIE 6.0; Windows NT 5.1; SV1) •
Opera/9.01 (Windows NT 5.1; U; en) •
Mozilla/5.0 (Macintosh; U; Intel Mac OS X 10_6_3; en-US) AppleWebKit/533.4 (KHTML, like •
Gecko) Chrome/5.0.375.38 Safari/533.4
Googlebot/2.1 (
• http://www.googlebot.com/bot.html)
Mozilla/4.0 (compatible; MSIE 6.0; Windows NT 5.1; SV1; .NET CLR 1.1.4322) •
Mozilla/5.0 (Windows; U; Windows NT 5.1; en-GB; rv:1.8.1.6) Gecko/20070725 Firefox/2.0.0.6 •
Opera/9.20 (Windows NT 6.0; U; en) •
The data generator script includes the ability to customize the percentage of user agents and HTTP error codes, the default settings are 25 percent and 30 percent, respectively. The generator has a default value for maximum number of events, which is 50,000 for a period of 30 days. The generator creates the sample data starting from the current date and goes backward 30 days. For this example, we have taken the defaults as described.
To run the data generator script, you will need to have Python 2.7 or above installed on your system. You can make use of the Python that is bundled with Splunk. You will be able to find Python installed in the $SPLUNK_HOME/ bin directory (where $SPLUNK_HOME is the directory where Splunk is installed). The data generator script has been tested with Python 2.7 that comes with Splunk and also with Python 3.1.5. For more information on Python you can visit http://www.python.org. The sample data generation script included in the download package of the book is called Generate_Apache_Logs.py. We have installed that script into /datagen/BigDBook directory on our Linux machine.
Generate Sample Data
To generate the sample data, you will execute the python script by typing command shown in Figure 2-8. The same command applies to both Windows and Unix.
On successful execution of the Python script, you will be able find the generated log files in the /opt/log
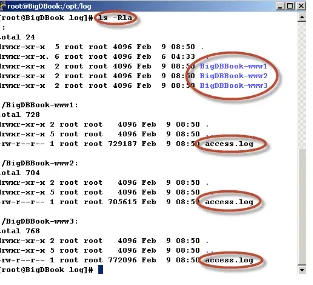
directory if it is a Unix operating system and in case of a Windows operating system the files are placed in the directory c:\opt\log. As we mentioned earlier, a typical ecommerce web site runs on various servers, thus our data generator simulates log entries for three different hosts that are named BigDBook-www1, BigDBook-www2, and BigDBook-www3. The location of generated files can be customized in the script file. For this chapter the log files were generated in the following directories:
• /opt/log/BigDBook-www1/access.log • /opt/log/BigDBook-www2/access.log • /opt/log/BigDBook-www3/access.log
If you type the following Unix command ls –Rla in the /opt/log directory it will list the files as seen in Figure 2-9
and we can see that the access log files were created for the three different hosts in separate directories.
CHAPTER 2 ■GETTING DATA INTO SPLUNK
Now that the MyGizmoStore access logs are created and ready, you can configure Splunk to monitor the directory where these log files are being placed. To do this go to the manager screen, as was done earlier, and click on the “Data inputs” link (as seen in Figure 2-1). In the Data inputs page, click on the “Add new” link for the Files & directories option. Now you can select to skip the data preview, as we already did this earlier with the same data, and click on the continue button. In the Add new page, under the source option, select the radio button for “continuously index data from a file or directory this Splunk instance can access.” Because the sample generator is writing out logs to the /opt/log directory (in the case of Linux), we will use that as an input for the “Full path to your data” option. Because we created a separate index for MyGizmoStore.com, called mygizmostoreindex, we will use it to illustrate how to load data into an index other than the main one. Select the check box for “More” settings. One of the options we have here is to set the host name. This is very useful, as you can do specific searches based on host name. The Set host option provides the following choices:
You can define a constant value for the host name, which is useful when you want to have a •
single host name for all the log files.
The RegEx option, which allows you to extract the hostname from a string using a regular •
expression.
The segment option, which allows you to make use of a particular segment in the full file •
pathname.
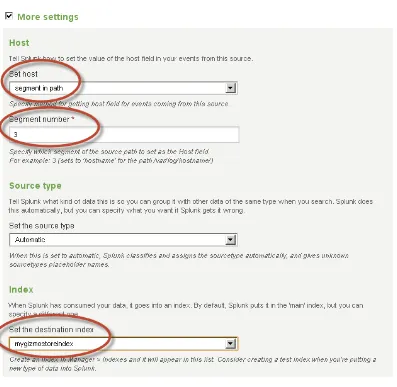
In our case for MyGizmoStore.com, we want to use multiple host names as the test generator is creating files under /opt/log/BigDBook-www1, /opt/log/BigDBook-www2, /opt/log/BigDBook-www3. Because the hostname is the third value in all pathnames, we will make use of the segment option and specifying a value as 3. As we have did when we loaded the single file, we will let Splunk set the source type automatically, and in the index we will specify
the newly created mygizmostoreindex index. We do this by selecting that index from drop-down box. The advanced options include a whitelist and a blacklist, which help specifying which files in the directory should be monitored and which should be ignored. In our case the sample data generator is only generating one log file under each subdirectory, so we leave them blank, as there is nothing to black or white list. Figure 2-10 shows the settings that we have configured. After all is defined, click on the Save button.
As with the previous example, you will be able to see the newly saved configuration in the Data inputs page, as shown in Figure 2-11.
CHAPTER 2 ■ GETTING DATA INTO SPLUNK
Once Splunk indexes the files successfully, you can review the data. To do this, type index=mygizmostoreindex in the search bar and hit enter, as shown in Figure 2-12. This search lists all the events in the specified index, and as before it includes the default fields. You can see that the host name is set correctly according to our specifications, which were to use the third segment of the file pathname. The source type and source fields also appear to be correct. Because the data seems to be correctly indexed based on our simplistic review, we can feel comfortable that Splunk is monitoring those directories on a regular basis and appending the new information into the mygizmostoreindex.
Figure 2-11. Saved configuration
We can now introduce the left side bar, also known as the field bar. This side bar always presents the default fields and additional fields, which Splunk calls fields of interest. These are defined as fields that show up in 50 percent or more of the events of that particular index. It is a very useful tool to quickly gain a better understanding of the data you are working with. For example, we can quickly see that the host field has three values. If we want to know which are those values you can click on the bar graph icon against the host field. As seen in Figure 2-13, this will bring up a dialog box that shows all the values of the host field. Thus we avoid having to review a number of events to verify that the three expected values are present. Not only that, the dialog box also presents some summary statistics about the field, such as the total count of events that contain each value and the percentage. Additionally, it presents a bar chart with that information, making it a very compelling and easy way to gain a good understanding of a specific field.
Most of the time the generated log files are very big; they get compressed using zip technology. Additionally, most of the servers have log rotation capability, where log files are moved to another place after a certain time or size has been reached. The Splunk directory monitoring facility is intelligent enough to address these real-world use cases, as it can unzip the compressed files in the directory before indexing them. It can also automatically detect the log rotation and keep track of where the last log entry that was indexed is located; this way it can start from that point. This is useful in case of Splunk restart or when maintenance tasks are executed.
Network Sources
A number of system applications and network devices such as routers switches relay events over network ports using the TCP or UDP protocols. Some applications make use of the SNMP standard to send events over UDP. Syslog, which is a standard for computer data logging is another set of sources where there is a wealth of information that could be captured at a network port level. Splunk can be enabled to accept input from a TCP or UDP port. To do this, you can use the Splunk Web user interface and configure a network input source where all you have to specify is the host, port, and sourcetype. Once you save the configuration, Splunk will start indexing the data coming out of the specified network port. This kind of network input can be used to capture syslog information that gets generated on remote machines and the data does not reside locally to a Splunk instance. Splunk forwarders can also be used to gather data on remote hosts. We will discuss forwarders in the last part of this chapter.
CHAPTER 2 ■ GETTING DATA INTO SPLUNK
Windows data
The Windows operating system churns out a number of log files that have information about Windows events, registry, Active Directory, WMI, performance, and other data. Splunk recognizes Windows log streams as a source type and allows adding one more of these log streams to be indexed as input for further processing and analysis. Although Windows sources such as Active Directory or others can be individually configured, Splunk provides a better and easy way of dealing with these Windows logs or events by using the Splunk App for Windows or the Splunk Technology Add-on for Windows. We will explore this later in this chapter.
Other Sources
Splunk supports scripting as a mechanism to get data from other sources that are not provided with a specific default configuration. There is no limit on types of data that scripting can touch, as long as the scripting output can be provided as an input that Splunk can understand or can be tweaked to make it understand. Examples include a script that could be getting data from a database or a script that could be getting data from Twitter—we will look into this example in Chapter 12. Technology Add-ons could also be using scripting as the mechanism to get the data, but they provide an abstraction to bring the added value of making it easy to get the data into Splunk for further processing and analysis. This gives is a good opportunity for a quick overview of Splunk Apps and Add-ons.
Apps and Add-ons
The Splunk user interface defaults to the Search app. However, Splunk is designed as a platform that serves as an infrastructure where third-party developers or ISVs can build specialized applications that provide extensions to Splunk. There are two ways of building these extensions: Apps and Technology Add-ons.
Splunk Apps package the extended functionality together with standard features such as saved searches, dashboards, and defined inputs. Additionally, they bundle their own user interface layered on top of Splunk’s user interface. By contrast, Add-ons, or simply TAs, are smaller components as compared to Apps, which include the additional functionality without their own user interface. We will have to use the standard Splunk Search application against the indexed data configured through add-ons. Apps and Add-ons can be written by anybody with a decent programming knowledge. Splunk has a vibrant community that constantly creates and shares Apps and Add-ons. It is hosted at http://splunk-base.splunk.com/apps/. In Appendix B, you will find a list of useful Apps and Add-ons that you can use in your enterprise.
To explore Windows sources, we will make use of the Splunk Technology Add-on for Windows. This will allow us to get the windows data into Splunk. You can find the Add-on by going to directly to splunkbase or you can search and find apps directly from Splunk instance. To do that click on “Find more apps ... ” under the “App” menu as shown in Figure 2-14.
In the search bar of the user interface type the word windows and hit enter. At the time of this writing the fourth result came up as Splunk for Windows technology add-on, which is the one we want use. Click on the Install free button, as shown in Figure 2-15. You will require a Splunk login to do this. It is free to register.
You will be prompted to enter the credentials for your Splunk Web site account. Once you enter your credentials, the add-on will be installed onto the Splunk instance. You should see a message stating that a restart is required. Click on Restart Splunk button. On successful restart and login into the Splunk instance, you will be able to find the newly installed Splunk TA for Windows under the “App” menu, as shown in Figure 2-16 below.
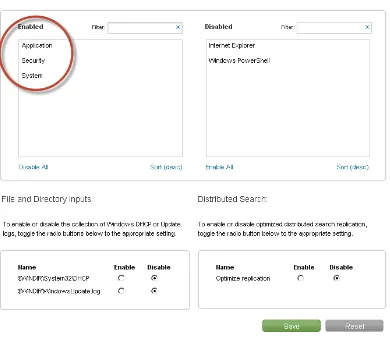
Specific Windows event logs or files and directories can be enabled by clicking on the add-on link in the “App” menu. Once the specific sources are enabled the add-on will automatically configure the data to be loaded into the Splunk instance. We will enable Application, System, and Security event logs as seen in Figure 2-17 to do some basic testing and show how the Windows TA helps to simplify the process of loading Windows sources data into Splunk.
Figure 2-15. Splunk TA for Windows
CHAPTER 2 ■ GETTING DATA INTO SPLUNK
Note
■
Windows Technology add-on can be installed on Splunk running on Windows. If you are running Splunk on
Linux then the Windows TA can be installed on a forwarder running on a Windows machine. Forwarders are explained
later in this chapter and in Chapter 15. We also recommend reviewing the Splunk administrative manuals when installing
a combination of Apps and Add-ons to see what configuration(s) are supported.
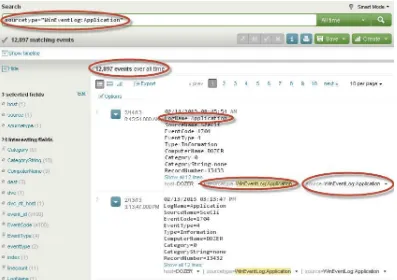
Now that we have installed Windows TA and enabled some of the available sources, we can go to Splunk Search App and search for indexed data to test whether the TA is able to get the data into Splunk. We can pick Application, which is one of the sources that we have enabled, and see if events related to Windows applications are indexed into Splunk. For this type in the search bar the following command:
sourcetype="WinEventLog:Application"
As seen in Figure 2-18, the search came back with 12897 events from the Application events log. You can pick other event logs that have been enabled and search for events related to those logs. As this chapter is focused on understanding on how to get data into Splunk, we are not going to explore all of the available events that have been indexed into Splunk. Chapter 3 will take you into details of how to process and analyze the data once it is in Splunk and Chapter 4 will go into details of visualizing the data indexed into Splunk.
Splunk also provides similar Technology Add-ons for Linux and Unix known as *Nix. This Add-on makes use of both log files and scripting to get different sets of event and log data available in Linux or Unix into Splunk. You can install *Nix technology add-on using the same process we used to install the Windows Technology Add-on:
Go to “App” menu and click on “Find more apps ... ” as shown in Figure
• 2-14.
Search for *nix and the second entry at the time of this writing comes up as “Splunk for Unix •
and Linux technology add-on.”
Click on the Install free button; after a successful install you will be prompted to Restart •
Splunk.
On a successful restart, go to the “App” menu as seen in Figure
• 2-19; here you can see “Splunk
*Nix (TA)” as a new menu item.
CHAPTER 2 ■ GETTING DATA INTO SPLUNK
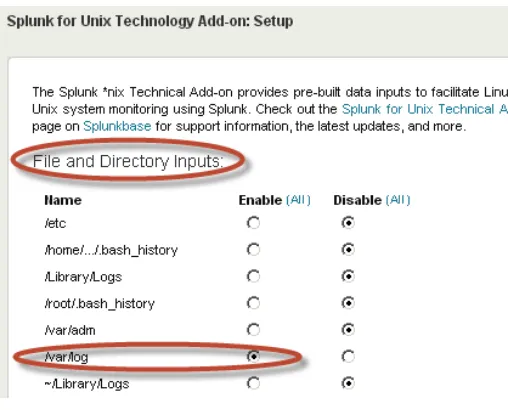
Click on the link for “Splunk *Nix(TA)” so that you can setup the sources of data for your flavor of Unix . This brings up the setup screen as seen in Figure 2-20. Here you can see that the Add-on makes use of the Files & Directory monitoring approach that we used earlier with the MyGizmoStore.com to monitor different log files in Unix. It also makes use of scripting approach that we just discussed to load specific data inputs, such as CPU usage into Splunk. This really shows the power of a TA, which abstracts the layer of annoying details and makes it very simple to get data loaded into Splunk. To do a quick test, we enable the /var/log directory under the “file directory inputs” as shown in Figure 2-20. Additionally, we enable the cpu.sh script under “scripted inputs” title as seen in Figure 2-21. Clicking on the Save button saves the settings to the corresponding configuration file. If you go to the “Indexes” page, you will see that all the *Nix data is being loaded into a separate index named os.
Figure 2-19. Splunk *Nix (TA)
Now that you have installed the *Nix TA and enabled some of the available sources, you can go to the Splunk Search App and search for indexed data to test out whether the *Nix TA was able to load the data. As we mentioned earlier, the *Nix TA loads the data into separate index called os, so you can go ahead and search for all the events by entering index=os in the search bar, and this will retrieve all the events that have been indexed into Splunk for the enabled sources. You can see in Figure 2-22, that the search shows the events captured from top, who, and various log file under /var/log directory.
CHAPTER 2 ■GETTING DATA INTO SPLUNK
Forwarders
In the real world, enterprises have numerous applications and most of them will be running on a heterogeneous infrastructure, which includes all sorts of hardware, databases, middleware, and application programs. It will not be possible to have Splunk running locally or near to each of the applications or infrastructure, meaning the data will not be local to Splunk. What we have seen in this chapter is how we can get data into Splunk which is local to it. The use cases assumed that Splunk will be able to access files or directories, which could be on local or file systems that have remote data, but they are attached to the machine where Splunk is running.
To address the use case of getting remote data into Splunk, we will explain Splunk forwarders. A Splunk forwarder is the same as a standard Splunk instance but with only the essential components that are required to forward data to receivers, which could be the main Splunk instance or indexer. The forwarder’s primary job is of gathering data that is remote to Splunk, forwarding it to a main Splunk instance or indexer that will load the remote data. Splunk universal forwarder is a downloadable component from splunk.comthat can be set up to forward the required data. Technology add-ons such as the Windows TA can work with a universal forwarder to send Windows source data to a Splunk instance running on Unix environment. Using Splunk forwarders is the recommended deployment or best practice to work with remote data. Forwarders provide many benefits, including:
They automatically buffer data at remote locations, which can be useful when the main •
instance of Splunk goes down for whatever reason.
They support making use of Technology Add-ons to gather different sources of data available •
remotely.
They can be administered remotely. •
They support securely sending the remote data, with compression and data acknowledgment. •
They provide support for load balancing, and are better suited for scalability and performance. •
They can work with any available network port on the remote location, whose data need to be gathered. We will go in more details about Splunk deployments in Chapters 14 and 15, which discuss distributed topologies and high availability.
Summary
CHAPTER 3
Processing and Analyzing the Data
In this chapter you will learn how to process and analyze the data using Splunk’s Search Processing Language (SPL). We will continue with the data-loading work that we did in Chapter 2; this will help you to get a good understanding of the combined access log format and the information that the log entries provide. You will then learn how to process the data of MyGizmoStore.com using SPL’s reporting, sorting, filtering, modifying, and grouping commands.
Getting to Know Combined Access Log Data
One of the points that we stress in this book is the need to understand the data set that you want to process and analyze; that is, getting intimately acquainted with the data you will work with first. In this chapter we are going to take the first step of explaining the data of the combined access log format that we used to generate the sample data in Chapter 2.
Log files are generated by almost all kinds of applications and servers—whether they are end-user applications, web servers, or complex middleware platforms that serve as an infrastructure to run the applications used by consumers or business users. Operating systems and firmware also generate huge amounts of raw data into log files. The challenge lies in understanding, analyzing, and mining the raw data in the log files and making sense out of it.
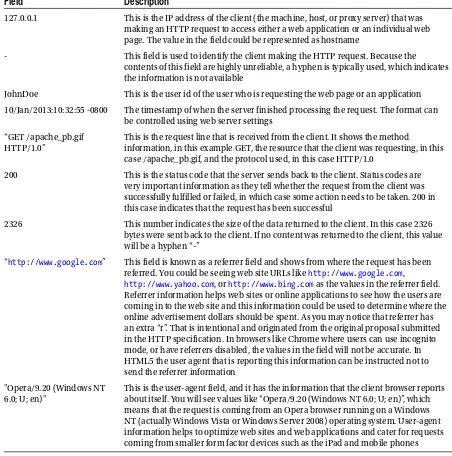
Combined access logs generated by web servers such as Apache or Microsoft IIS provide information about activity, performance, and problems that are happening, whether intermittently or continuously. These logs contain information about all of the requests processed by the server. Both Apache and IIS allow customization of the combined access log format, which is commonly used and well understood by many log analysis applications that interpret and process the entries in these log files. The log entries produced in the combined access log format look like this:
127.0.0.1 - JohnDoe [10/Oct/2000:13:55:36 -0700] "GET /apache_pb.gif HTTP/1.0" 200 2326 "http://www.google.com" "Opera/9.20 (Windows NT 6.0; U; en)"
Table 3-1. Description of fields in combined access log
Field
Description
127.0.0.1 This is the IP address of the client (the machine, host, or proxy server) that was making an HTTP request to access either a web application or an individual web page. The value in the field could be represented as hostname
- This field is used to identify the client making the HTTP request. Because the contents of this field are highly unreliable, a hyphen is typically used, which indicates the information is not available
JohnDoe This is the user id of the user who is requesting the web page or an application 10/Jan/2013:10:32:55 -0800 The timestamp of when the server finished processing the request. The format can
be controlled using web server settings “GET /apache_pb.gif
HTTP/1.0”
This is the request line that is received from the client. It shows the method
information, in this example GET, the resource that the client was requesting, in this case /apache_pb.gif, and the protocol used, in this case HTTP/1.0
200 This is the status code that the server sends back to the client. Status codes are very important information as they tell whether the request from the client was successfully fulfilled or failed, in which case some action needs to be taken. 200 in this case indicates that the request has been successful
2326 This number indicates the size of the data returned to the client. In this case 2326 bytes were sent back to the client. If no content was returned to the client, this value will be a hyphen “-”
“http://www.google.com” This field is known as a referrer field and shows from where the request has been referred. You could be seeing web site URLs like http://www.google.com, http://www.yahoo.com, or http://www.bing.com as the values in the referrer field. Referrer information helps web sites or online applications to see how the users are coming in to the web site and this information could be used to determine where the online advertisement dollars should be spent. As you may notice that referrer has an extra “r”. That is intentional and originated from the original proposal submitted in the HTTP specification. In browsers like Chrome where users can use incognito mode, or have referrers disabled, the values in the field will not be accurate. In HTML5 the user agent that is reporting this information can be instructed not to send the referrer information
"Opera/9.20 (Windows NT 6.0; U; en)"
CHAPTER 3 ■ PROCESSING AND ANALYZING THE DATA
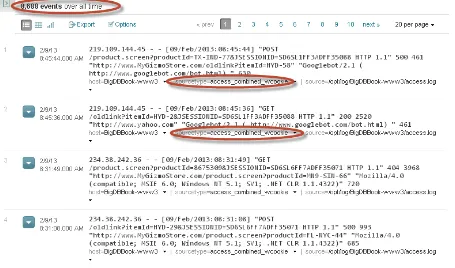
Now let us look at some of the sample log entries that we generated in Chapter 2 for MyGizmoStore.com. Here are sample entries from the /opt/log/BigDBBook-www1/access.log file. You can see that there are different status codes as well as user agents or browsers.
196.65.184.6 - - [28/Dec/2012:06:54:46] "GET
/product.screen?productId=CA-NY-99&JSESSIONID=SD5SL8FF8ADFF4974 HTTP 1.1" 200 992 "http://www.bing.com" "Opera/9.20 (Windows NT 6.0; U; en)" 597
92.189.220.86 - - [29/Dec/2012:02:58:28] "GET
/cart.do?action=purchase&itemId=HYD-2&JSESSIONID=SD2SL1FF4ADFF5176 HTTP 1.1" 500 1058 "http://www.MyGizmoStore.com/oldlink?itemId=HYD-2" "Mozilla/4.0 (compatible; MSIE 6.0; Windows NT 5.1; SV1; .NET CLR 1.1.4322)" 604
189.228.151.119 - - [30/Dec/2012:18:18:50] "GET /product.screen?productId=8675309&JSESSIONID=SD6S L9FF2ADFF6808 HTTP 1.1" 404 3577 "http://www.MyGizmoStore.com/product.screen?productId=CA-NY-99" "Opera/9.01 (Windows NT 5.1; U; en)" 916
218.123.191.148 - - [31/Dec/2012:04:28:45] "GET /category.screen?categoryId=BLUE
GIZMOS&JSESSIONID=SD0SL1FF1ADFF7226 HTTP 1.1" 500 2992 "http://www.MyGizmoStore.com/category. screen?categoryId=BLUE GIZMOS" "Mozilla/5.0 (Macintosh; U; Intel Mac OS X 10_6_3; en-US) AppleWebKit/533.4 (KHTML, like Gecko) Chrome/5.0.375.38 Safari/533.4" 928
78.65.68.244 - - [31/Dec/2012:02:22:40] "GET /category.screen?categoryId=ORANGE
WATCHMACALLITS&JSESSIONID=SD1SL5FF9ADFF7146 HTTP 1.1" 200 2120 "http://www.bing.com" "Mozilla/4.0 (compatible; MSIE 6.0; Windows NT 5.1; SV1)" 338
Searching and Analyzing Indexed Data
Searching and analyzing machine or log data can provide tremendously useful intelligence on how the applications, systems, web servers, load balancers, and firewalls are working. This information can also be used for debugging, root cause analysis, and, in general, getting a deeper understanding of external or internal customer behavior in terms of usage or buying patterns. By analyzing machine data, enterprises can start asking questions that haven’t been thought of before to find out what is happening with the IT infrastructure.
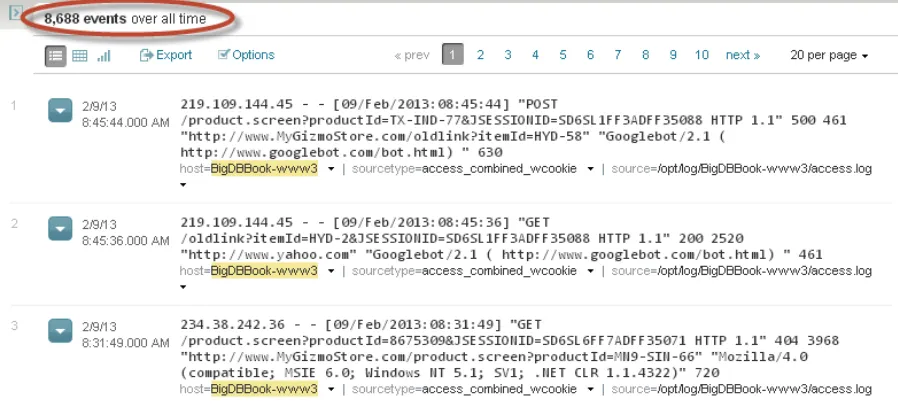
To further validate the total number of events, we can find how many events are related to each of the hosts BigDBook-www1, BigDBook-www2, and BigDBook-www3. The total number of events for all of the hosts should match up to the earlier result we got using the sourcetype field search. Type host=BigDBook* into the search bar and you will see in Figure 3-2 that 8,688 events are retrieved and the value for host field is highlighted in all events. The number of events is equal to the number that we got from the previous search.
CHAPTER 3 ■ PROCESSING AND ANALYZING THE DATA
We can also check on individual fields to further validate the data. The sample data generator by default had the following categories:
BLUE_GIZMOS •
RED_GADGETS •
WHITE_WIDGETS •
ORANGE_WATCHMACALLITS •
PURPLE_DOOHICKEYS •
BLACK_DOODADS •
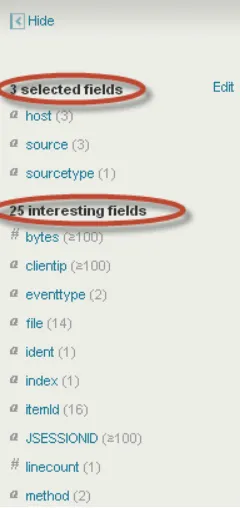
You can go the left bar in the Splunk search app as shown in Figure 3-3; this side bar always presents the default fields and additional fields, which Splunk calls fields of interest. These are defined as fields that show up in 50 percent or more of the events of that particular index.
You can see if we have got a field where we can find the list of categories. Because we cannot find a categories field in either of the fields lists, click on the “View all 44 fields” link, which is at the bottom. This will bring up a dialog box that shows the complete list of fields. You can see categoryId listed as the third field from the top, as shown in Figure 3-4.
CHAPTER 3 ■ PROCESSING AND ANALYZING THE DATA
To see the list of categories, click on the small bar graph icon shown in column 2 of the categoryId field. You will see the list of categories grouped across all the events in the popup as shown in Figure 3-5, and the list in the popup matches the list of default categories that we used in the sample data generator. In addition, the dialog box presents the category field values; it also shows some summary statistics about the field, such as the total count of events for each category and the percentage. Additionally, it presents a bar chart, making this a very compelling and easy way to gain a good understanding of a specific field.
You can always add additional fields to the side bar. We can do this while we are in the “Field” dialog box; click on the arrow sign against the field action, which is first in the list of fields, and click the Save button. You can do a quick validation on the action field. In our sample data generator, we have used the following methods for the actions that MyGizmoStore.com visitors can perform:
Purchase •
Add an item to the shopping cart (Addtocart) •
Remove an item from the shopping cart (Remove) •
View the catalog of gizmos (View) •
Change the quantity of an item in the shopping cart (Changequantity) •
In the left bar, you can now see that the action field is listed in the selected fields list. Click on the small bar graph icon for that field. Figure 3-6 shows the popup with the list of methods for the action field; these match with the list we have. We can see that the view method has the highest number of events. You will analyze this as you learn how to process the events using SPL.