BIG DATA
AND HEALTH
ANALYTICS
EDITED BY
KATHERINE MARCONI
The Graduate SchoolUniversity of Maryland University College
HAROLD LEHMANN
Boca Raton, FL 33487-2742
© 2015 by Taylor & Francis Group, LLC
CRC Press is an imprint of Taylor & Francis Group, an Informa business No claim to original U.S. Government works
Version Date: 20141023
International Standard Book Number-13: 978-1-4822-2925-7 (eBook - PDF)
This book contains information obtained from authentic and highly regarded sources. Reasonable efforts have been made to publish reliable data and information, but the author and publisher cannot assume responsibility for the validity of all materials or the consequences of their use. The authors and publishers have attempted to trace the copyright holders of all material reproduced in this publication and apologize to copyright holders if permission to publish in this form has not been obtained. If any copyright material has not been acknowledged please write and let us know so we may rectify in any future reprint.
Except as permitted under U.S. Copyright Law, no part of this book may be reprinted, reproduced, transmitted, or utilized in any form by any electronic, mechanical, or other means, now known or hereafter invented, including photocopying, microfilming, and recording, or in any information stor-age or retrieval system, without written permission from the publishers.
For permission to photocopy or use material electronically from this work, please access www.copy-right.com (http://www.copywww.copy-right.com/) or contact the Copyright Clearance Center, Inc. (CCC), 222 Rosewood Drive, Danvers, MA 01923, 978-750-8400. CCC is a not-for-profit organization that pro-vides licenses and registration for a variety of users. For organizations that have been granted a photo-copy license by the CCC, a separate system of payment has been arranged.
Trademark Notice: Product or corporate names may be trademarks or registered trademarks, and are used only for identification and explanation without intent to infringe.
v Foreword ...ix Karen Bandeen-Roche
List of Contributors ... xiii Introduction ...xvii Katherine Marconi and Harold Lehmann
List of Abbreviations ... xxv
Section i
chapter 1 Little Big Data: Mastering Existing Information as a Foundation for Big Data ... 3 Donald A. Donahue, Jr.
chapter 2 Managing Unstructured Data in a Health Care Setting ... 25 David E. Parkhill
chapter 3 Experiences with Linking Data Systems for
Analyzing Large Data ... 45 Dilhari DeAlmeida, Suzanne J. Paone, and John A. Kellum
chapter 4 The Ecosystem of Federal Big Data and Its Use in
Health Care ... 57 Ryan H. Sandefer and David T. Marc
chapter 5 Big Data from the Push of Clinical Information:
Harvesting User Feedback for Continuing Education ...79 Roland Grad, Pierre Pluye, Michael Shulha, David L. Tang,
Jonathan Moscovici, Carol Repchinsky, and Jamie Meuser chapter 6 Addressing Social Determinants of Health Using
chapter 7 An International Perspective: Institutionalizing Quality Improvement through Data Utilization
at a Multicountry, Multiclinic Level ... 127 Martine Etienne-Mesubi, Peter Memiah, Ruth Atukunda,
Constance Shumba, Francesca Odhiambo, Mercy Niyang, Barbara Bastien, Patience Komba, Eva Karorero, Mwansa Mulenga, Lanette Burrows, and Kristen Stafford
Section ii
chapter 8 Big Data: Architecture and Its Enablement ... 155 Bruce Johnson
chapter 9 Health Data Governance: Balancing Best Practices for Data Governance and Management with User
Needs ... 177 Linda Dimitropoulos and Charles (Chuck) Thompson
chapter 10 Roadblocks, Regulation, and Red Tape: How American Health Policy and Industry Norms
Threaten the Big Data Revolution ... 201 Matthew Dobra, Dorothy Weinstein, and Christopher Broyles chapter 11 Education and Training of Health Informaticists ... 223
Lynda R. Hardy
Section iii
chapter 12 Interactive Visualization ... 243 Catherine Plaisant, Megan Monroe, Tamra Meyer,
and Ben Shneiderman
chapter 14 Improving Decision-Making Using Health Data
Analytics ... 285 Margrét V. Bjarnadóttir, Ritu Agarwal, Kenyon Crowley,
QianRan Jin, Sean Barnes, and Kislaya Prasad
chapter 15 Measuring e-Health Impact: An e-Health Evaluation Framework that Leverages Process
Control Theory and Big Data Analytics ... 309 Derek Ritz
ix
Karen Bandeen-Roche
Over much of history, the generation of data was the cost-limiting step for the advancement of science. Tycho Brahe labored for decades in col-lecting the celestial observations that Johannes Kepler ultimately would use to deduce his laws of planetary motion. The last hundred years have witnessed huge data-related investments in field after field, whether in the vast accelerators that have been crucial to modern advancements in par-ticle physics, satellites that have surveyed both our planet and the cosmos, technologies through which we can now sequence the genome, hundreds of thousands of persons who have been assessed through public health cohort studies and social science surveys, or efforts to implement exhaus-tive electronic medical records. With infrastructure increasingly in place, the costs of biomedical data collection plummeting, and crowd-sourcing exploding, the cost-limiting paradigm has inverted. Data availability is outstripping existing paradigms for governing, managing, analyzing, and interpreting those data.
Forces to meet this new demand are strengthening throughout our soci-ety. Academically, we have seen the genesis of the field of “data science.” Industry demand for data scientists is skyrocketing. Government agencies such as the National Science Foundation and National Institutes of Health (NIH) are investing hundreds of millions of dollars toward producing the workforce, norms, methods, and tools needed to reap the benefits of “big data”—collections increasingly of terabyte scope or even larger. The NIH, for example, has established a new associate directorship of data science who, among other responsibilities, will oversee the “Big Data to Knowledge” (BD2K) program. BD2K will make investments, largely through grants, to “enable biomedical scientists to capitalize more fully on the Big Data being generated by those research communities”.
science, statistics, applied mathematics, engineering, information science, medicine, physics, public health, and “domain” sciences such as biology, neuroscience, and social science. A second was that training must go beyond creating experts in these fields—even ones with specialty skills in big data. Rather, what is desperately needed is training to create effective teams spanning these fields, as well as transdisciplinary or “pi-shaped” people who cross boundaries with depth in two or more fields. Finally, we seem to be moving toward a reality in which data-intensive activity will touch all areas of science, so that training will increasingly need to span all possibilities of depth—from needing merely to be “conversant” to those who can adeptly apply existing tools for dealing with big data to experts who will create the new methods and tools that are urgently needed if our expertise in utilizing the data is to catch up with the volume and complex-ity of the data itself.
This volume targets crucial members of the teams who will be needed to unlock the potential of big data: health care and medical profession-als, scientists and their students. It engages and grounds its readers in the issues to be faced by showing how health care practitioners and organiza-tions are linking data within and across their medical practice on scales that only now have become possible. It also elucidates the realities of mov-ing from medical and administrative records to useful information and the innovative ways that this can be accomplished.
An initial seven chapters sketch the landscape of biomedical big data, and in so doing, communicate the enormous diversity of data sources and types that are contributing to modern health care practice and research environments, and the massive challenges and needs that are posed by their effective integration and dissemination. They also expose us to the many uses to which these data are being applied, ranging from clinical decision-making and risk assessment, to mentorship and training to pro-mote transformation of health care through effective data usage, to the assessment of social risks for poor health and the use of resulting mea-sures to target interventions and investments.
domain, and specifically the statistical software package “R”; and for leveraging so-called “unstructured” data such as images and text-based reports.
xiii Ritu Agarwal
Robert H. Smith School of Business
University of Maryland College Park, Maryland Ruth Atukunda
Institute of Human Virology University of Maryland School
of Medicine
Robert H. School of Business University of Maryland College Park, Maryland Barbara Bastien
Institute of Human Virology University of Maryland School
of Medicine Port-au-Prince, Haiti Margrét V. Bjarnadóttir Decision, Operations, and
Information Technologies Robert H. Smith School
of Business
Center for Health Information and Decision Systems (CHIDS) Department of Decision,
Operations, and Information Technologies
Robert H. Smith School of Business School of Health and
Rehabilitation Sciences University of Pittsburgh Pittsburgh, Pennsylvania Linda Dimitropoulos
Center for the Advancement of Health IT (CAHIT)
Matthew Dobra
University of Maryland University College
Adelphi, Maryland Martine etienne-Mesubi MPH, DrPH
Institute of Human Virology University of Maryland School
of Medicine
University of Maryland University College
Robert H. Smith School of Business
Center for Assistance in Research using eRecord (CARe)
Department of Health Informatics and Information Management The College of St. Scholastica Duluth, Minnesota
Peter Memiah
Institute of Human Virology University of Maryland School
of Medicine Baltimore, Maryland Jamie Meuser
tamra Meyer
Office of the Surgeon General US Army
Washington, DC
Megan Monroe
Institute for Advanced Computer Studies
University of Maryland School of Medicine
School of Health Information Management
University of Pittsburgh Pittsburgh, Pennsylvania
David e. Parkhill
Hitachi Global Center for Innovative Analytics Hitachi Consulting Denver, Colorado catherine Plaisant
Human-Computer Interaction Lab Institute for Advanced Computer
Studies Robert H. Smith School of Business University of Maryland
Ben Shneiderman
Human Computer Interaction Lab Institute for Advanced Computer
Studies
University of Maryland College Park, Maryland Michael Shulha
Research Manager
Electronic Medical Record Project HFPC Montreal Jewish General
Hospital Montreal, Canada constance Shumba
Institute of Human Virology University of Maryland School of
Medicine Kampala, Uganda Kristen Stafford
Department of Epidemiology and Public Health
University of Maryland School of Medicine
Baltimore, Maryland
Gregory D. Stevens Keck School of Medicine
University of Southern California Alhambra, California
David L. tang Information Sciences McGill University Montreal, Canada
charles (chuck) Thompson Senior Health Research
xvii
Katherine Marconi and Harold Lehmann
PURPOSE
The practice of medicine and the business that encompasses it are rapidly changing. But while changes in health care delivery are widely recognized and discussed, much less is known about where health care as an indus-try will be 5, 10, or even 15 years from now. In the editors’ lifetimes, this highly regulated market has gone through several evolutions (or as some would posit revolutions). The Accountable Care Act (ACA) has set the direction for the near future. But what happens after health care reform?
Contributing to the changes in health care delivery is the role of comput-ing and information technology. While many writers focus on the revolu-tion at the computerized bedside, in this book, we will be focusing on the current and future uses of the material being computed: the data and their ancillary analytics. Our authors write about how individual bits of health information can be organized into big data to improve the business of delivering services and to communicate to consumers. As an industry, we are just beginning to realize the potential that myriad information health deliveries hold, for health care both in the United States and globally.
The purpose of this book is to provide frameworks using cases and examples of how big data and analytics play a role in modern health care, including how public health information can inform health delivery. This book is written for health care professionals, including executives. It is not a technical book on statistics and machine-learning algorithms to extract knowledge out of data or a book exploring the intricacies of data-base design. It represents some of the current thinking of academic and industry researchers and leaders. It is written in a style that should interest anyone interested in health information and its use in improving patient outcomes and the business practices that lead to improved outcomes.
We stress usage, because without providing the right information to the people who need it, when they need it, data capture will not add value. The authors in this volume thus provide examples of how big data’s man-agement and use can improve access, reduce cost, and improve quality.
Big data and health analytics have been criticized for their unrealized potential. In some ways, the authors of these criticisms are correct. In a 2014 article that appeared in Health IT News (p. 1), Carl Shulman talks about how “fast, easy tech” matters. At this point, fast and easy electronic health information is rarely available. Data are collected, but the business plan of making it comprehensive and valid for a variety of purposes is missing. Some of the challenges for big data and health analytics today include the following:
• Incorporating new information, such as biomedical data, and new technologies into electronic health records (EHRs) that store big data. Text data require special algorithms, genetic data may be volu-minous, and continuously monitored physiological data can be at arbitrary levels of granularity.
• The eventual movement to ICD-10-CM/PCS coding. While this cod-ing provides a wealth of specific diagnostic information, the invest-ment in data systems and associated business practices to handle complex codes is large. More generally, there is a potential loss of information between the raw data collected and the standard tag-ging required.
• Harnessing the potential of unstructured data for analysis, such as medical imaging and text.
• Building data systems that meet requirements of accountable care organizations (ACOs) and other types of payment reforms.
• Producing understandable information for both providers and consumers.
• Maintaining patient privacy while aggregating data that increas-ingly can identify the individual, even without the Health Insurance Portability and Accountability Act (HIPAA) 18 safe-harbor data items.
The National Academy of Sciences talks about teaching students to extract value of big data. This imperative assumes we know what to teach them. For those of us in the health care industry who are involved in big data and health analytics, showing added value to the many different health professions is our challenge for health big data and analytics.
ORGANIZATION OF CHAPTERS
Our book is organized into three sections that reflect the available data and potential analytics: sources and uses of health data, business practices and workforce environments, data presentation and analysis framework. Each section shows the opportunities to improve health delivery through the analysis of data sets that may range from population information to clinical and administrative data.
Section I: Sources and Uses of Health Data
Chapter 3 is a brief overview of the challenges encountered in creat-ing big data from disparate data sets. The analysts who authored this chapter are part of a large health system. They assist different prac-tices within the system to identify, gather, and analyze information to improve patient care. Some of the challenges that they have experienced are proprietary data structures, lack of standard data definitions, the need for multidisciplinary staffing, and appropriate analytical tools to handle big data.
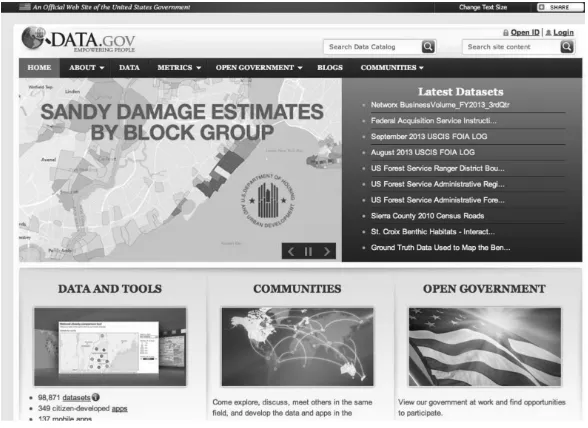
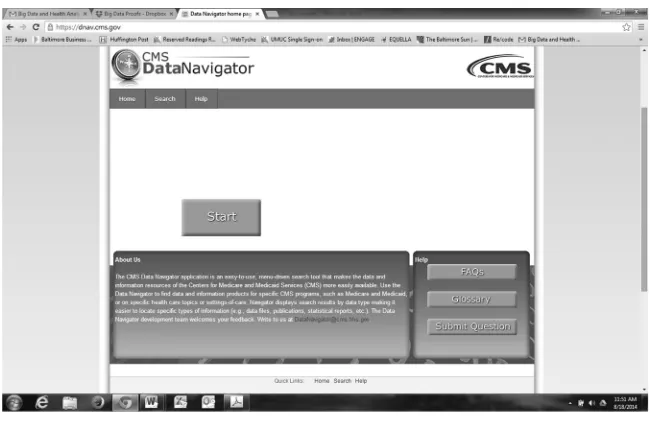
Chapters 4 through 7 focus on solving specific problems using a vari-ety of health data. In Chapter 4, Ryan Sandefer and David Marc discuss the ecosystem of federal big data and its use in health care, including HealthData.gov. They then show how open-source tools can be used to analyze one open-source data set: the Centers for Medicare and Medicaid (CMS) hospitals’ attestation data for Stage 1 of Meaningful Use. Their analysis is based on a traditional epidemiology principle: numerators (hospitals reporting Stage 1 of Meaningful Use) need denominators (the number of hospitals in a defined geographic area) for analysis. They also point out that successful big data analytics still depend on sound research methodologies.
Roland Grad and his colleagues in Chapter 5 evaluate using mHealth technologies, including email, apps, and RSS feeds, to push clinical infor-mation to physicians. In 2006 they began collecting responses from 10,000 Canadian physicians and pharmacists on the usefulness of InfoPOEMs (patient-oriented evidence that matters) to them. They also point out ways to expand their future evaluations of communicating close to real-time clinical advances to practitioners.
In Chapter 6, Gregory Stevens returns to available sources of popula-tion data. But his focus is on primary care physician practices and how community population data can be used to build models of vulnerabil-ity. In turn, these models help focus health promotion interventions for individual patients. Community health beliefs and practices do impact the health habits of patients along with the chances of changing those habits.
analytic systems from scratch even when resources are scarce, or is it more costly and time- consuming to rebuild an integrated EHR from a plethora of existing administrative and clinical systems?
Section II: Business Practices and Workforce Requirements
In Chapter 8, Bruce Johnson begins this section by discussing the data architecture needed for big data and health analytics. He shows how we should appreciate the complexity of big data. Organizations need to con-sider this complexity as they standardize data, build new technologies into their systems, and grow their analytic capacity.
The business practices surrounding big data are developing along with the technology to house and analyze it. In Chapter 9, Linda Dimitropoulos and Charles Thompson talk about the balance needed between best practices for data governance and managing and meet-ing user needs. Their chapter is organized usmeet-ing a health data gov-ernance framework adopted from the Data Govgov-ernance Institute’s general data framework. Chief information officers take note: the chapter walks through the challenges of and solutions to building governance structures and processes, establishing accountable stake-holders, managing risks, defining clear metrics, and assuring data security.
In Chapter 10, Matthew Dobra and his colleagues take a different tac-tic toward governance. They review the growing government regulations and current health practices that impact health data and the adverse con-sequences that may impact patient care. They end by making a series of policy and practice recommendations for the gathering, storage, and use of big data.
health informaticists should possess. She also stresses how blending the skills of these two groups with clinical insights has led to the development of relatively new fields, such as nurse and physician informaticists.
Section III: Data Presentation and Analysis Framework
Communication of patterns found in complex data is challenging. In Chapter 12, Catherine Plaisant, Ben Shneiderman, and their colleagues from the Human-Computer Interaction Laboratory at the University of Maryland show some of the creative ways that everything from individual patient information to prescription records and to the global burden of disease can be visually communicated. Using the analytics systems that they have developed, Lifeline and Eventflow, the beauty of identifying practice patterns can easily be read.
Kim Jayhan in Chapter 13 takes on population management, a popular concept today, showing how business intelligence enhances patient care. He uses case studies including simple analytics to show the potential to bring better health care for populations, improved patient experience, and reduced per capita cost—the triple aim.
Chapter 14 continues this discussion of how analytics improves decision-making in four areas: reducing health care costs, making informed treatment decisions, improving the design and selection of intervention programs, and combatting fraud and waste. Margarét Bjarnadóttier and her colleagues end their chapter by posing specific questions that need to be answered as the field of further analytics develops.
Thinking big is not a problem for the author of our last chapter. In Chapter 15, Derek Ritz presents an e-health evaluation framework based on process control theory and data analytics. Both internation-ally and in the United States and its states, health systems are a topic of discussion and study. What makes for an efficient and well-functioning health system? How should accessibility to health services be mea-sured? How do consumers fit into this system and stay connected to their care?
REFERENCES
Data Governance Institute. 2008. Current US federal data laws addressing data privacy, security, and governance. Available at http://www.datagovernance.com/adl_data_ laws_existing_federal_laws.html
National Council of the National Academies, Board on Mathematical Sciences and Their Applications. 2014. Training students to extract value from big data. April 11–12. Available at http://sites.nationalacademies.org/deps/bmsa/deps_087192
xxv Acronym Definition
ACA Affordable Care Act
ACA-LO Application-Levels of Outcomes ACOs Accountable Care Organizations ADT Admission, Discharge, and Transfer AeHIN Asia E-Health Information Network
AHIM American Health Information Management Association AHIP American Health Insurance Plans
AHRQ Agency for Health Research and Quality AIR Additional Improvement in Reclassification AMA American Medical Association
AMIA American Medical informatics Association ANIA American Nursing informaticists Association ARRA American Recovery and Reinvestment Act ART Antiretroviral
ASHIM American Society of Health Information Management BHC Building Healthy Communities
BHNI Bureau of National Health insurance
BI Business intelligence
CAGR Compound Annual Growth Rate
CAHIT Center for the Advancement of Health IT CAHs Critical Access Hospitals
CARe Center for Assistance in Research Using eRecord
CAS Complex Adaptive Systems
CAT Computer Axial Tomography
CBSA Core-Based Statistical Area
CBTS Community-Based Treatment Supporters
CCHIIM Commission On Certification for Health informatics and Information Management
CDE Common Data Elements
CER Comparative Effectiveness Research
CHIB Center for Health-Related informatics and Bioimaging CHIDS Center for Health Information and Decision Systems
CIA Central Intelligence Agency CIC Clinical Information Channel CMA Canadian Medical Association CME Continuing Medical Information CMMB Catholic Medical Mission Board CMO Chief Medical officer
CMS Centers for Medicare and Medicaid CNMC Children’s National Medical Center
CPHIS Certified Professional in Health Information Systems
CPT Common Procedure Terms
CQI Continuous Quality Improvement CRAN Comprehensive R Archive Network CRII Clinical Relevance of Information Index CRS Catholic Relief Services
CSDH Commission On Social Determinants of Health DALYs Disability-Adjusted Life-Years
DARPA Defense Advanced Research Projects Agency DBMS Database Management Systems
DDIU Data Demand and Information Use DFLE Disability-Free Life Expectancy DGI Data Governance Institute
DICOM Digital Imaging and Communications in Medicine EBP Evidence-Based Practice
EDM Electronic Data Methods
EDWs Enterprise Data Warehouses EHR Electronic Health Records EMR Electronic Medical Record
ENIAC Electronic Numerical Integrator and Computer
EP Eligible Professional
ER Emergency Room
ESRD End Stage Renal Disease ETL Extract, Transform, and Load FBI Federal Bureau of Investigation FDA Food and Drug Administration FOIA Freedom of Information Act
FWA Fraud, Waste, and Abuse
GBD Global Burden of Disease
GERD Gastro-esophageal Reflux Disease
GPA Grade Point Average
HALE Health-Adjusted Life Expectancy HCOs Health Care Organizations
HCUP Healthcare Cost and Utilization Project HIE Health Information Exchange
HIMSS Health Information and Management Systems Society HIPAA Health Insurance Portability and Accountability Act HIT Health Information Technology
HITECH Health Information Technology for Economic and Clinical Health
HRQoL Health-Related Quality of Life
HRSA Health Resources and Services Administration
HSA Health System Analysis
IAM Information Assessment Method
ICD 9 International Classification of Diseases 9th edition ICD 10 International Classification of Diseases 10th edition ICS Inhaled Corticosteroids
ICT Information and Communication Technology IDN Integrated Delivery Network
IHI Institute for Healthcare Improvement IMA Interchurch Medical Assistance
InfoPOEMs Patient-Oriented Evidence That Matters IOM Institute of Medicine
IOS Interorganizational Systems
IPPS Inpatient Prospective Payment System
IT Information Technology
IV Intravenous
JCAHO Joint Commission on Accreditation of Healthcare Organizations
LABAs Long-Acting Beta-Agonists
LOINC Logical Observation Identifiers Names and Codes M&E Monitoring and Evaluation
MOOCs Massive Open Online Courses
MPI Master Patient Index
MRIs Magnetic Resonance Imaging
MRN Medical Record Number
MU Meaningful Use
NICE National Institute for Health and Care Excellence NIH National Institutes of Health
NLP Natural Language Processing NSF National Science Foundation
NSQIP National Surgical Quality Improvement Program O&E Outcomes and Evaluation
OCR Optical Character Recognition
ODS Operational Data Store
OGP Open Government Partnership
ONC Office of the National Coordinator
PACS Picture Archiving and Communication System
PBA Pattern-Based Analysis
PBF Performance-Based Financing PCMHs Patient-Centered Medical Homes
PCORI Patient Centered Outcomes Research Institute PCPs Primary Care Physicians
PDSA Plan–Do–Study–Act
PEPFAR President’s Emergency Plan for AIDS Relief
PhD Doctor of Philosophy
PHI Personal Health Information
PLO Patient-Level Outcomes
PMML Predictive Model Markup Language PQRS Physician Quality Reporting System
PTCA Percutaneous Transluminal Coronary Angioplasty
PUF Public Use File
QALYs Quality-Adjusted Life-Years
QI Quality Improvement
RCT Randomized Controlled Trial ROC Receiver Operating Characteristic RWJF Robert Wood Johnson Foundation SABA Short-acting Beta-agonists
SAS Statistical Analysis System SCA Site Capacity Assessment
SES Socioeconomic Status
SNOMED Systematized Nomenclature of Human Medicine SOPs Standard Operating Procedures
SQL Structured Query Language
UMLS Unified Medical Language System
UMSOM/IHV University of Maryland’s School of Medicine/Institute of Human Virology
UN United Nations
UPI Unique Patient Identifier
UPMC University of Pittsburgh Medical Center
VAS Visual Analog Scale
VNA Vendor Neutral Archive
WHO World Health Organization
3
Little Big Data: Mastering
Existing Information as
a Foundation for Big Data
Donald A. Donahue, Jr.
OBJECTIVES
After reading this chapter, the reader shall be able to:
• Describe what volume of health data are generated by the typical health center
• Evaluate the four types of projects and their implications for answering questions with health care data
CONTENTS
• Analyze the typical methods used to examine health care data in aggregate
• Describe important attributes of a dataset used in analysis
ABSTRACT
Unprecedented changes in health care delivery are being accompanied by a dizzying array of new technologies. Pressures to identify and con-trol costs and enhance quality challenge not only the status quo but also leadership’s ability to assimilate and employ effective tools. Effective use of health care data can save an estimated 17% of the $2.6 trillion in annual U.S. health care spending. The concept of big data can be daunting, but more is not necessarily better. Health systems, payers, and public health already possess a trove of information—albeit in disparate and disconnected repositories—from which to garner tremendous insights. Emerging analytical capabilities hold great potential for leveraging both the growing health information technology (HIT) sector and existing data. Case studies of identifying cost outliers and root causes for adverse outcomes offer an understanding of advances in analytics and their application to current operations.
In the age of technology there is constant access to vast amounts of information. The basket overflows; people get overwhelmed; the eye of the storm is not so much what goes on in the world, it is the confusion of how to think, feel, digest, and react to what goes on.
Criss Jami Venus in Arms
INTRODUCTION
effective tools. A 2013 report by McKinsey & Company estimated that using big data could reduce health care spending by $300–450 billion annually, or 12–17% of the $2.6 trillion baseline in annual U.S. health care spending (Kayyali, Knott, and Van Kuiken, 2013).
THE PACE OF CHANGE
The pace at which information technology has advanced has been remarkable—almost beyond comprehension. Consider two milestone events in computational capabilities, both of which occurred within the span of an average lifetime in the developed world.
On February 14, 1946, the Moore School of Electrical Engineering of the University of Pennsylvania fulfilled its contract with the Army’s Ballistic Research Laboratory at Aberdeen Proving Ground, announc-ing the activation of the electronic numerical integrator and computer (ENIAC), the first general-purpose electronic computer. In what would today seem amusing, a 1961 retrospective described the ENIAC’s size. Weik (1961) pointed out that “by today’s standards for electronic com-puters the ENIAC was a grotesque monster. Its thirty separate units, plus power supply and forced-air cooling, weighed over thirty tons. Its 19,000 vacuum tubes, 1,500 relays, and hundreds of thousands of resistors, capac-itors, and inductors consumed almost 200 kilowatts of electrical power.”
ENIAC required a room that measured 30 by 50 feet,* twice the footprint of the ubiquitous family houses being built at the time by Levitt and Sons that would define suburban American for a generation (Gans, 1967). ENIAC’s circuits included 500,000 soldered joints with 70,000 resistors and 10,000 capacitors. It also had its own dedicated power lines, which today would power 3,125 laptop computers.
The creators of ENIAC foresaw the need for faster processing.† What they could not have envisioned was the phenomenal growth in processing
*The Levitt ranch house measured 32 feet by 25 feet.
capacity and the corresponding reduction in size of the machine. In less than 50 years, in 1995 a team at the University of Pennsylvania had rep-licated the functionality of ENIAC on a single silicon chip measuring 7.44 mm by 5.29 mm (Van Der Spiegel, 1996). A mere 12 years later, some 62 years after the launching of ENIAC, Apple released the first iPhone on June 29, 2007, heralding a new age in mobile computational power. The iPhone—and its Android and Blackberry cousins—offer substantial communication and computing capabilities. Roughly the size of a deck of cards, the iPhone 5 can perform 20,500,000 instructions per second com-pared with ENIAC’s 385 multiplications per second.
This explosion in computational power spawned a corresponding growth in data generation. This led, in turn, to the emergence of the concept of big data. But what is big data? These data come from every-where: sensors used to gather climate information, posts to social media sites, digital pictures and videos, purchase transaction records, and cell phone GPS signals, to name a few. We create 2.5 quintillion bytes of data every day. Of all the data in the world today, 90% has been created in the last two years (IBM).
The ability to store and use large amounts of data has historically been limited by the size and cost of hardware, limitations in storage capacity, and staff and maintenance requirements. Increased connectivity, advances in storage capabilities, and market dynamics have fostered the growth of network-based services, more commonly referred to as the cloud (Carroll, Kotzé, and van der Merwe, 2012). Microsoft Research Executive Tony Hey describes the potential of cloud computing as “the large cloud/utility com-puting provides can have relatively very small ownership and operational costs due to the huge scale of deployment and automation. Simple Web services interface to store and retrieve any amount of data from anywhere on the Web” (n.d.). The unprecedented growth in access can, however, present an overwhelming amount of data, exceeding the ability to effec-tively use it. Hey goes on to point out that there is a science to retrieving meaningful data and interpreting it.
sources that populate the health care landscape. While technology can be an efficiency facilitator, it can also be an overwhelming force.
THE HEALTH CARE DATA MONSTER
Health care generates a tremendous amount of structured data. A 1,000- bed facility, where each patient record potentially could contain as many as 10,000 characters, could produce ~1.2 GB per year of structured data in individual patient records alone. Information in these records is readily identifiable and directly supports analysis, allowing examination of such management indicators as average length of stay, patients per bed per year, and number of readmissions within 30 days.
The vast amount of data created—as much as 80%—is unstructured (text, voice annotations, images). The challenge becomes how to use that unstructured data toward a beneficial purpose. We find ourselves at a technological crossroads. A massive influx of new data offers advanced analytical potential, yet we do not effectively use the data already on hand.
The concept of big data impacts here. Structured data size for individ-ual providers is not a major problem in this context. Available analytical tools can identify trends and issues within the limited 20% world of struc-tured data. The key challenge is data sourcing, data extraction, data con-solidation, data cleaning, and data transformation. How can we combine the structured with the unstructured to produce a utilitarian foundation?
Establishing such utility is increasingly central for health care. Two landmark reports from the Institute of Medicine—To Err Is Human:
Building a Safer Health System (IOM, 2000) and Crossing the Quality
THE WICKED PROBLEM OF KNOWING WHERE TO LOOK
The challenge for health care is to identify where actionable data reside, to extract them, and to make use of them. Rittel and Webber (1973) and Churchman (1967) “defined a class of problems that are ill formatted, employ confusing information, many clients and decision makers, conflicting values and resolutions that have ‘thoroughly con-fusing’ ramifications, which they call ‘wicked problems’” (Tomasino, 2011, p. 1353). “The hospital— altogether the most complex human organization ever devised” (Drucker, 2006, p. 54)—is an intricate matrix organization composed of multiple autonomous and interde-pendent cohorts (ibid.). This complexity is multiplied when the broader spectrum of health care—outpatient clinics, private provider offices, emergency medical services, long-term care, pharmacies, research-ers, insurresearch-ers, and others—is considered. Each of these entities may have its own information technology (IT) system, data repository, and terminology. This can result in confusing information, many clients and decision-makers, and conflicting values and resolutions, the very essence of a wicked problem.
The health care landscape is constantly shifting. The dynamic of conflicting perspectives and the need to establish internal institutional relationships generate interorganizational systems (IOS). IOS, in turn, organize as complex adaptive systems (CAS) (Waldrop, 1992). Unlike a production line, where a product follows a prescribed linear path to com-pletion, an encounter with the health care system can vary and likely will based on myriad factors such as diagnosis, location (Dartmouth Atlas of Health Care,2014), payer–provider contractual agreements, and provider referral patterns. That these CAS are multifaceted and fluid makes insti-tutional data analysis challenging, and extant data sources often provide only apples-to-oranges comparisons.
The realm of project management offers a framework for examining the analytical needs of a health care organization. Turner and Cochrane (1993) defined four types of projects:
Type 1: Goals and methods of achieving the project are well-defined. Type 2: Goals are well-defined but methods are not.
Health care data are contained in multiple, often unconnected systems. Hospital information technology can include discrete systems for sched-uling, individual medical records, radiology, imaging, pharmacy, labora-tory, blood bank, pathology, the emergency department, a master patient index, finance, billing, human resources, and supplies. Given the individ-uality of each patient, variations in practice, and the disparate sources of data, an analytical need can be any type project. How can we manage an enterprise when the goals and methods routinely vary?
THE CHALLENGE AT HAND
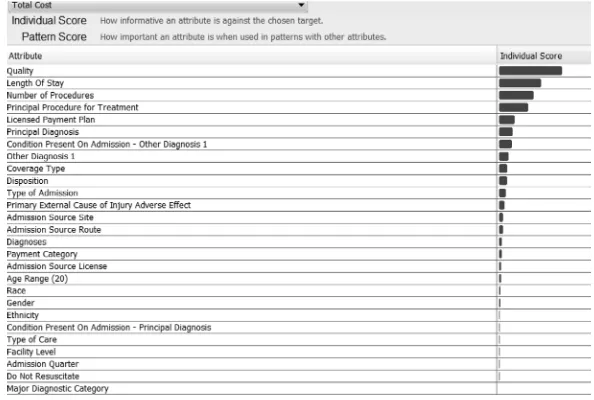
Current HIT systems generate myriad reports. Typically, these represent per-formance within a functional realm, such as financial perper-formance or clini-cal operations metrics. The result is these reports can be overwhelming. In the words of health care consultant Quint Studer (2013), “There are so many areas to oversee, decisions to make and problems to solve. If you aren’t care-ful, you’ll spend your whole day responding and reacting instead of laser-focusing on the issues that drive results … days turn into weeks that turn into months that turn into years.” With countless systems generating mul-tiple management reports, the health care executive can be awash in data but wanting for actionable insights. Consider a case study in system performance. Who are my poorly performing providers in terms of costs versus patient satisfaction and why? The source data contain approximately four million records, collected over a period of five years from more than 100 health care providers.* Data descriptors include 183 attributes, such as the following:
• Person specific information such as gender, age, and ethnicity • Encounter information such as:
• Provider ID
• Multiple diagnoses and codes • Multiple procedures and codes
• Length of stay, total costs, disposition, and medical coverage type • Patient satisfaction quality indicator
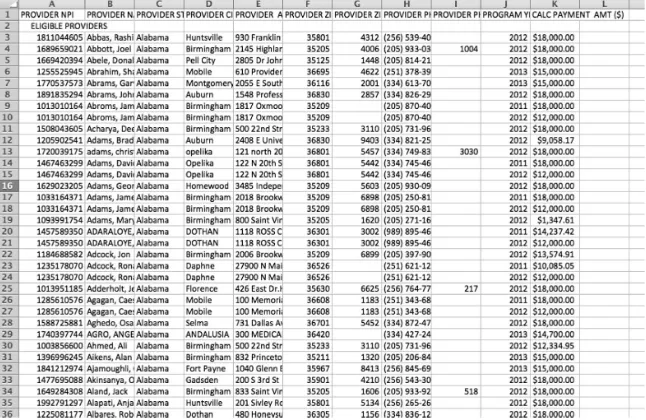
A typical management report will appear in tabular form (Figure 1.1). Even though this representation is a comprehensive depiction of a broad
D
on
a
ld A
. D
on
a
h
u
e, J
r.
FIGURE 1.1
array of indicators, it does not readily provide actionable information. It leaves the user to ponder: Are there insights in the data? Can I under-stand why there is a problem? Can I predict what could happen down the road? Can analytics point to solutions that I can track over time?
Insights can be uncovered via analytical thinking. “Analytical thinking is a structured approach to answering questions and making decisions based on facts and data” (Hanrahan, 2012):
• First, figure out that I have a problem and then clearly define it. • Get the right data to help come up with answers; check, verify, clean,
and normalize.
• Locate specific problematic areas within the data. • Prioritize these problem areas.
• Explore relationships and patterns in the data. • Drill down to identify solutions.
• Confirm hypotheses and analyze errors. • Share findings with others.
• Determine how solving the problem will affect me going forward. • Decide and act (Figure 1.2).
HIDING IN PLAIN SIGHT
There are multiple, well-established analytical programs, many dating back to the 1960s. General-purpose solutions (tools and platforms) include such rec-ognizable applications as Excel, SAS, SPSS, Cognos, Tableau, and QLikView.
Reporting
WHAT happened?
Predicting
WHAT WILL happen?
Analyzing
WHY did it happen?
Acting
MAKE IT happen! Descriptive
Predictive
Prescriptive
FIGURE 1.2
New offerings emerge on a regular basis that facilitate data mining, business intelligence, statistics/advanced analytics, prediction/forecasting, and visual exploration. Specialized solutions offer predictive applications, forecasting, scheduling, and process optimization functionalities. All have relevance in health care. The challenge is to decide which one is the optimal application. That decision should be based on the nature of the issue. The relative merits of each product are beyond the scope of this chapter.
Decision-making can be divided into three broad, progressively active categories: descriptive, predictive, and prescriptive (Bell, Raiffa, and Tversky, 1998). In health care, the information that supports descrip-tive deliberations includes patient population management, clinical quality and efficacy, outliers for providers or patients, and coding errors and fraud. These effectively measure or reflect events that have already occurred. Predictive analysis can project issues such as revenues in 30, 60, and 90 days; readmissions (e.g., patient with congestive heart fail-ure [CHF] will be readmitted to the hospital within 30 to 90 days); and patient groups for risk adjustment. Prescriptive actions influence future outcomes and include patient flow management, accurate costing, and asset management. The logical utility is that it is better to influence results than to react to past events.
Let us return to the previously mentioned case study. Health care is increasingly under pressure to control costs and improve quality. Industry internal initiatives such as the IOM reports, national policy exemplified by ACA, and market competitive forces demand greater insights into the forces that drive health care outcomes. Assume we wish to identify providers with substandard outcomes in terms of cost versus patient sat-isfaction, with a focus on circulatory system disorders. In all probabil-ity, the relevant indicators reside in multiple IT systems. The aggregate data set includes 732 million descriptors. Defining the applicable attri-butes for analysis represents a type-2 project; the goals are well defined (identifying poorly performing providers), but the methods are not. What might be the indicators of poor performance? On what hypothesis might analysis be based?
It is a capital mistake to theorize before one has data. Insensibly one begins to twist facts to suit theories, instead of theories to suit facts.
Quality pioneer Avedis Donabedian called for a multitiered approach to sampling, drawing from a broad range of attributes (1988). This might sug-gest examining the entirety of available facts. In this context, we deal only with extant data, not the vast potential being unleashed by technological advancement—and not yet available. The sheer volume of existing facts is overwhelming. The goal is not to acquire more data but to identify rel-evant data. This can be done by identifying certain patterns within the available information.
The first task is to aggregate the data. Extract, transform, and load (ETL) processes extract data from outside sources, transform it to fit operational needs, and load it into the end target (database, operational data store, or data warehouse) (Golfarelli and Rizzi, 2009). The range of target formats is broad, ranging from a single file on a laptop to sophisticated corporate-wide repositories (Inmon, 2005). For the purpose of this example, a single, comma delimited* file was created from the various source systems.
This facilitates creation of a single file within which to explore. It does not, however, provide a starting point or methodology to identify outliers. The question of what attributes typify a high-cost, low-satisfaction provider remains unanswered. A method of attributional analysis could identify these incidents. The emerging technology of pattern-based analysis (PBA) provides that tool.
PBA is an analytic methodology that identifies key multivariate correla-tions or patterns in the data. A pattern is a group of low-dimensional data records from a high-dimensional data set. Examples include frequent patterns (clustering), infrequent patterns (anomaly detection), and sequential patterns (time series). Initially developed for the U.S. Navy as a means to track ship-board travel of communicable diseases, PBA has evolved to provide insight within data to guide further exploration and analysis and to facilitate both automated hypothesis generation and domain-driven hypothesis testing.
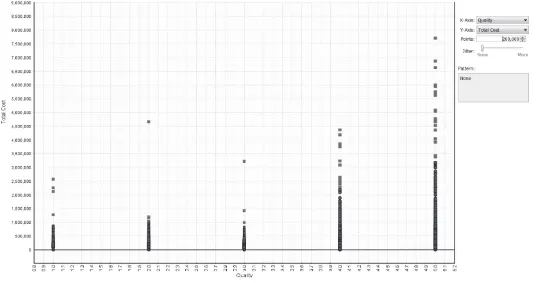
The analysis began with selection of a reference descriptor. As the focus was to compare cost with quality—characterized by patient satisfaction, measured from 1 (lowest) to 5 (highest)—total cost was selected as the baseline attribute signified within the analytical program as the target. An examination of the relationship between total costs and all other attributes identified the greatest correlation between cost and quality.
While this may seem intuitive, the nature of that correlation must be examined to understand its relevance.
PBA allows visualization of relationships. By examining the distribution of costs against satisfaction ratings, it is possible to identify areas of con-cern. Reviewing these relationships (Figure 1.3), it becomes apparent that the majority of satisfactions scores lie in the 4–5 range, even as some of those encounters incurred extremely high costs. What is troublesome, however, is the cluster of relatively high-cost events that produced the lowest satisfaction score of 1, visible in the lower-left hand corner of Figure 1.4. Identifying the underlying reason for this disparity—high cost and low satisfaction—offers the opportunity for process enhancement and improved outcomes.
Further visualization, via cascading analytics within PBA, allows examination of patterns for these events (Figure 1.5). By exploring the collections of patterns associated with the greatest cost, low patient satisfaction points, the two top attributes are identified. Some 48 patients experienced 10 or more procedures, the top pattern. The second pattern identifies that 98 patients received two to four procedures under Medicare.
The ability to drill down, applying progressive examination of the underlying patterns for any given attribute, allows more detailed investi-gation. Having identified a cluster of patients associated with the two top
FIGURE 1.3
ig D
a
ta
•
15
FIGURE 1.4
patterns, it might be instructive to ascertain which providers generated these substandard outcomes. This window (Figure 1.6) identifies the top 4 providers (of 111) that account for 46% of poor outcomes within the pattern.
This identifies a pattern of substandard performance among a small group of providers. Any corrective actions would require specific knowl-edge of the source of that substandard performance. What are the key procedures involved in these outcomes? Continuing the drill-down process, it is possible to identify the distribution of procedures among these seemingly poorly performing providers. We wish to examine the principal procedure for treatment. The PBA program allows isolation of that information as it has identified the practice pattern of the provid-ers being examined. The resultant screen shot (Figure 1.7) dramatically FIGURE 1.6
Casting a tighter net—provider ID distribution for top pattern. 48 patients
98 patients
FIGURE 1.5
demonstrates that 4 of 10 of the procedures performed by these providers are percutaneous transluminal coronary angioplasty (PTCA). A remark-able trend has been identified among these four providers.
Having identified a pattern within procedures performed, it might be beneficial to examine secondary procedures, as coronary cases are typically complex and this particular group of patients received 10 or more procedures. Viewing the highlighted Principal Procedures line, it is easy to see on the line below that a similar number of secondary procedures were performed. By highlighting the secondary procedures line, it can be seen that “Ins drug-elut coronary stent” (Insert drug-eluting coronary stent) is dominant (Figure 1.8). This makes sense in that the two procedures (the primary and the secondary) are commonly performed in tandem.
FIGURE 1.7
Principal procedure distribution for top pattern.
FIGURE 1.8
By identifying the cascading patterns in the available data, a cluster of high-cost–low-satisfaction encounters has been identified. This estab-lishes a hypothesis that a specific group of providers is contributing to high cost and low satisfaction within a particular grouping of patients. Closer examination of the patient data for this specific subpopulation may be further enlightening.
Having identified PTCA as the outlier cost issue, a review of the patient distribution for this procedure would prove instructive. Here again is where pattern discovery can be illuminating. By examining patient char-acteristics (Figure 1.9), it can be seen that the average cost for the top pattern, 65yrs+ PTCA female, is $444.570, greater than average cost for males in this same age bracket and procedure, $344.289. Armed with this insight, it becomes possible to proactively monitor this subpopulation as they enter the system with high-cost providers to potentially reduce costs and increase patient satisfaction.
Discovery of the latent patterns within the data has revealed an action-able attribute. There is real potential to reduce costs and increase satisfac-tion given the considerable disparity of costs between two groups receiving the same procedure. Considering the immense complexity within a data field containing hundreds of millions of elements reflecting dozens of cat-egories, additional exploration is possible; the extent is limited only by the intent of the analyst.
Curiosity might lead one to examine the eventual outcome of these encounters. Investigation of the disposition of these cases produces an intriguing revelation. Conventional wisdom dictates that providing ongoing
FIGURE 1.9
services is least expensive in a home health service model. Analysis of the patterns for these high-cost patients (Figure 1.10) reveals that several alter-native treatment venues are less expensive than the home health option, some considerably so. Comparison of the first four lines shows a remarkable disparity between the costs of the available options. While not a definitive descriptor—closer examination of representative cases is warranted—this is a strong indicator that a counterintuitive approach to managing these patients may be optimal.
THE UTILITY OF EXISTING DATA
Emerging technologies offer the ability to uncover actionable information within extant data. The case examined involved identification of outliers that adversely impacted health care operations. In this instance, traditional examination of the numerous management reports and data sets—data slicing and dicing—did not reveal any insights. Exploration identified an unusual and nonoptimal (Quality, Cost) relationship for the lowest sat-isfaction rating, Quality Level 1. Pattern-based discovery identified two dominant outlier patterns that explain this relationship. Drilling down into the top pattern provided a view into the dominant providers, principal and secondary procedures, and the underlying data that provide insight into the role of additional procedures and other factors.
With this added insight, the health care system can now monitor 65yrs+ females undergoing PTCA with high-cost providers to potentially FIGURE 1.10
reduce costs and improve patient satisfaction. It can also conduct what-if analysis on discharge dispositions, suggesting an option of transferring patients to other treatment venues to reduce costs.
Fidelity of data exploration can be increased through application of another emerging capability, semantic technology. Semantic technologies provide an abstraction layer above existing IT technologies that enable bridging and interconnection of data, content, and processes (Pollock and Hodgson, 2004). In a sense, this offers a universal translator to correlate disparate terms. Consider, for example, a search for issues related to the knee. Knee injuries are a common complaint. “In 2003, patients made approximately 19.4 million visits to physicians’ offices because of knee problems. It was the most common reason for visiting an ortho-paedic surgeon” (American College of Orthoortho-paedic Surgeons, 2007). Unfortunately, a search for a specific term or diagnosis can miss relevant annotations. Knee problems can by recorded as knee pain, patella, chondromalatia, bursitis, ACL, MCL, PCL, anterior cruciate ligament, meniscus tear, or torn cartilage. In fact, the list of terminology sources in health care is itself dizzying. A program used in the Military Health System in a project to enhance data interoperability itself drew from a dozen sources (Figure 1.11).
Semantic technology correlates these disparate terms so that a search on one will reveal all. Given the wide variety of terminology in medicine, this increases the accuracy of analysis.
CPT – Current Procedural Terminology, medical nomenclature used to report medical procedures and services
ICD9/10 – Th e International Classifi cation of Diseases
LIONC – universal code system for identifying laboratory and clinical observations
MedDRA – the Medical Dictionary for Regulatory Activities
MEDCIN – terminology around EMRs and point-of-care tools
Medi-Span – Master Drug Data Base, Medi-Span Electronic Drug File™
NCBI – curated classifi cation and nomenclature for all of the organisms in the public se-quence databases.
NDDF – National Drug Data File
NLP – Natural Language Processing
RxNorm – normalized names for clinical drugs
SNOMED CT – SNOMED Clinical Terms, the most comprehensive, multilingual clinical healthcare terminology in the world
UMLS – National Library of Medicine’s Unifi ed Medical Language System
FIGURE 1.11
INTO THE FUTURE
The ability to use existing data in no way diminishes the promise of rapidly advancing technology. IBM’s highly touted Watson supercomputer is being developed as a clinical decision support system. In February 2013, IBM announced that Watson software system’s first commercial application would be for utilization management decisions in lung cancer treatment at Memorial Sloan-Kettering Cancer Center in conjunction with WellPoint (IBM). Initial results have been impressive. A full 90% of nurses in the field who use Watson now follow its guidance.
Equally impressive is the capital expenditure needed to operate Watson. Watson is made up of a cluster of 90 IBM Power 750 servers (plus addi-tional input-output [I/O], network and cluster controller nodes in 10 racks) with a total of 2,880 POWER7 processor cores and 16 terabytes of RAM. The hardware cost is in the millions (IBM). It is likely that this power will one day become a common utility in health care. Until then, health care organizations can leverage the power of the data already on hand.
The concept of big data can be both daunting and exhilarating, but more is not necessarily better. Health systems, payers, and public health already possess a trove of information—albeit in disparate and disconnected repositories—from which to garner tremendous insights. Emerging ana-lytical capabilities hold great potential for leveraging both the growing HIT sector and existing data.
The rush toward increased volume is likely to exacerbate the already disjointed and dysfunctional array of information sources that populate the health care landscape. While technology can be an efficiency facilitator, it can also be an overwhelming force. Absent foundational understanding, the cloud is simply fog at a high elevation.
Don’t wait for what you don’t have. Use what you have, begin now and what you don’t even expect will come alongside with excess of what you expect. Go, make it happen.
Israelmore Ayivor
REFERENCES
American College of Orthopaedic Surgeons. 2007. Common Knee Injuries. Available at http://orthoinfo.aaos.org/topic.cfm?topic = a00325
Bell, David E., Howard Raiffa, and Amos Tversky (Eds.). 1998. Decision Making: Descriptive, Normative, and Prescriptive Interactions. New York: Cambridge University Press. Carroll, Mariana, Paula Kotzé, and Alta van der Merwe. 2012. Securing Virtual and Cloud
Environments. In I. Ivanov et al., Cloud Computing and Services Science, Service Science: Research and Innovations in the Service Economy. New York: Springer Science+Business Media.
Churchman, C. West. 1967. Guest Editorial: Wicked Problems. Management Science, 14(4): B141–B142.
Dartmouth Atlas of Health care. 2014. Available at http://www.dartmouthatlas.org/ Donabedian, Avedis. 1988. The Quality of Care. How Can It Be Assessed? JAMA 260(12):
1743–1748.
Donahue, Donald A., Jr. 2011. BioWatch and the Brown Cap. Journal of Homeland Security and Emergency Management 8(1): Article 5. Available at http://www.bepress.com/ jhsem/vol8/iss1/5, DOI: 10.2202/1547-7355.1823
Drucker, Peter F. 2006. Classic Drucker. Cambridge, MA: Harvard Business School Publishing Corp.
Gans, Herbert J. 1967. The Levittowners. Ways of Life and Politics in a New Suburban Community. New York: Columbia University Press.
Golfarelli, Matteo, and Stefano Rizzi. 2009. Data Warehouse Design: Modern Principles and Methodologies. New York: McGraw-Hill.
Hanrahan, Pat. 2012. Analytic Database Technologies for a New Kind of User—The Data Enthusiast. Paper presented at the ACM SIGMOD/PODS Conference, Scottsdale, AZ, May.
Hey, Tony. n.d. eScience, Semantic Computing and the Cloud. Available at http:// computerlectures.pnnl.gov/pdf/hey_presentation.pdf
Inmon, William. 2005. Building the Data Warehouse. New Jersey: John Wiley and Sons. Institute of Medicine (IOM). 2000. To Err Is Human: Building a Safer Health System.
L. T. Kohn, J. M. Corrigan, and M. S. Donaldson, eds. Washington, DC: National Academy Press.
Institute of Medicine (IOM). 2001. Crossing the Quality Chasm: A New Health System for the 21st Century. Washington, DC: National Academy Press.
Kayyali, Basel, David Knott, and Steve Van Kuiken. 2013. The Big-Data Revolution in US Health Care: Accelerating Value and Innovation. April. Available at http://www. mckinsey.com/insights/health_systems_and_services/the_big-data_revolution_ in_us_health_care
Pollock, Jeffrey T., and Ralph Hodgson. 2004. Adaptive Information: Improving Business through Semantic Interoperability, Grid Computing, and Enterprise Integration. New Jersey: J. Wiley and Sons.
President’s Council of Advisors on Science and Technology. 2007. Leadership under Challenge: Information Technology R&D in a Competitive World An Assessment of the Federal Networking and Information Technology. R&D Program 35.
Steinberg, Earl P. 2003. Improving the Quality of Care—Can We Practice What We Preach? New England Journal of Medicine 348(26): 2681–83.
Tomasino, Arthur P. 2011. Public Safety Networks as a Type of Complex Adaptive System. Paper presented at the International Conference on Complex Systems, Boston, MA, June 26–July 1, p. 1353. Available at http://necsi.edu/events/iccs2011/ papers/77.pdf
Turner, J. Rodney. 1992. The Handbook of Project Based Management: Improving the Processes for Achieving Your Strategic Objectives. New York: McGraw-Hill.
Turner, J. Rodney, and Robert A. Cochrane. 1993. Goals-and-Methods Matrix: Coping with Projects with Ill Defined Goals and/or Methods of Achieving Them. International Journal of Project Management 11(2): 93–102.
Van Der Spiegel, Jan. 1996. ENIAC-on-a-Chip PENNPRINTOUT. March. Available at http://www.seas.upenn.edu/~jan/eniacproj.html
Waldrop, M. Mitchell. 1992. Complexity: The Emerging Science at the Edge of Chaos. New York: Simon and Schuster.
25
2
Managing Unstructured Data
in a Health Care Setting
David E. Parkhill
CONTENTS
OBJECTIVES
After reading this chapter, the reader shall be able to:
• Describe what data are considered unstructured
• Understand techniques for extracting information out of unstruc-tured data
• Describe analytic methods used with unstructured data • Distinguish between text- and natural-language processing • Articulate differences between text- and image-based searching
ABSTRACT
Paper and electronic medical records are filled with physicians’ comments, interpretations of patient tests, nursing observations, and images. These notes are important to interpreting diagnoses and treatments, but they provide challenges when creating and performing analytics in electronic medical records. Taking the many forms of unstructured data, tagging and indexing them, and providing accessible analytics is a necessity if electronic health records (EHRs) are to save time for medical teams and facilitate care and treatment. In this chapter, an overview is provided of the emerging technologies for unstructured data analysis.
INTRODUCTION
and Transactions. All of these data are typically stored in a relational database, which enables ease of updating, querying and aggregating the data to provide operational information, and so-called business intelligence to the financial institution.
In the medical arena, structured data also exist, and there is a growing amount of such data with the implementation of electronic medical record (EMR) and EHR systems. EMR implementations are being driven by the Meaningful Use incentives provided by the U.S. government, while the EHR systems are motivated by individuals desiring to keep their own record of conditions and treatments. Much of the data stored by an EMR are structured, though it is not always stored in a strict relational format, as the Epic EMRTM uses what the company calls an extended relational data store. Concurrently, there is also an ever-increasing amount of elec-tronic data being created that are not structured. The unstructured kinds of data of interest in health care are text-based documents such as physi-cian encounter notes, progress notes, and test results as well as medical imaging studies including magnetic resonance imaging (MRIs), computer axial tomography (CAT) scans, and the common x-ray. It is estimated that 80% of the data created in a typical health care provider environment are unstructured data of one form or another (Terry, 2013).
With the pressures that the industry faces to improve patient outcomes and reduce cost, unstructured data have become an important focus of analytics in both the provider and health plan communities. The informa-tion contained in physician notes, progress notes, and radiology reports provides a comprehensive view of the treatment of a particular patient. The aggregation of such documents across a larger population of patients provides the foundation for analysis of quality of care, treatment pro-tocols, patient outcomes, drug effectiveness, and the effectiveness and durability of medical devices. However, until these documents are classi-fied and analyzed in a manner that enables analytics to be performed, the relevant information remains locked inside of them.
This chapter explores the types of unstructured data found in a typical health care environment and examines the techniques that can be used to analyze, classify, and use these data types and sources. The intent of the chapter is to provide an overview of use cases and techniques for application in the integration of unstructured data in the health care field. Certain concepts and approaches from natural language processing (NLP), text analytics, and text search are included in the discussion but are not explored in depth.
UNSTRUCTURED DATA IN DETAIL
There are many forms of unstructured data in the health care arena. As noted already, these forms include text documents such as encoun-ter notes, progress notes, radiology reports, and lab reports. A sample encounter note is shown in Figure 2.1.
Encounter Notes
Note that there is substantial semantic content in the encounter note, and much of it is actually data that could be considered structured data, were if it was extracted and formatted in a manner that allows it to be stored in a database. For example, the patient ID, the number “377784364,” appears twice in the record and in the second occurrence is tagged with the text tag “Patient ID.” Also, the patient name “Alex Nayberg” is indicated as well as the patient gender, “M”. Both the procedures performed and the diagnoses are indicated, as “annual eye exam” and “1. Diabetes Mellitus (sic) 2. Diverticulosis. 3. Hypertension,” respectively. This information is
377784364 Alex Nayberg M
Encounter Note:
DATE OF VISIT: 8/22/2012 Patient I D: 377784364
ENCOUNTER DIAGNOSES: 1. Diabetes Mellitus. 2. Diverticulosis. 3. Hypertension.
1 PROCEDURE: annual eye examination Patient’s retinal changes occurring in diabetes mellitus, marked by microaneury
FIGURE 2.1
immediately and obviously meaningful to a human reader but is simply a collection of characters to an unsophisticated software analytics program.
In some EMR systems, this information would be added to the patient record as structured data, with the procedure indicated in a procedure field and the diagnoses entered in a set of diagnosis fields. However, in other sit-uations, this document would simply be attached to the electronic record of the patient as is, either in a plain text, Word, or PDF electronic format. As such, it is virtually useless for anything other than human analysis. This situation is exacerbated in circumstances where a third-party provider, such as a radiologist, is analyzing an image and then verbally dictating a report that is converted to a text document (Nuance Communications, Inc., 2013). Such a document is frequently then delivered to the primary care physician, either as an electronic text document, paper document, or, in the worst case, a fax document. In this situation, the document is likely attached to the patient record as is or is scanned into the record as an image, again making it useless for anything other than human reading.
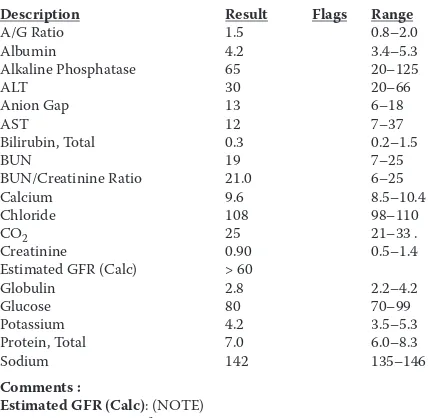
An analogous situation exists for information such as blood test results. A sample lab report is shown in Figure 2.2. To a human reader, it is obvious who the patient is and what the blood test results are, along with the expected ranges for the various tests requested. However, in this form, the informa-tion is no more useful than that in the aforemeninforma-tioned encounter note.
Medical Images
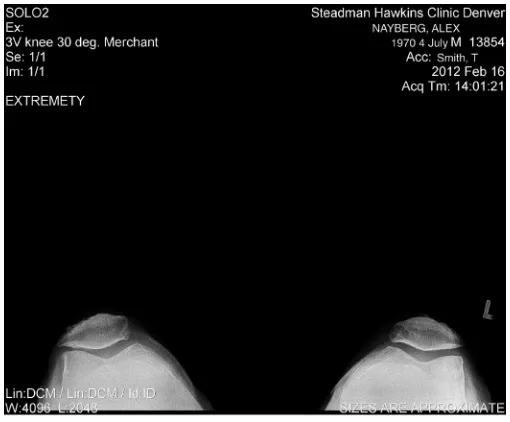
If we include medical images, the problem becomes even more acute, in that the images usually don’t have any text associated with them—they are essentially pictures, and the same limits that apply to pictures of the world around us apply to medical images. A sample image of a knee x-ray is shown in Figure 2.3. Fundamentally, unless we bring prior knowledge of the sub-ject of the picture or image we don’t have any idea of what we’re looking at or, in the case of a medical image, what we might be looking for.