Informasi Dokumen
- Penulis:
- Venkat Ankam
- Pengajar:
- Akram Hussain, Commissioning Editor
- Ruchita Bhansali, Acquisition Editor
- Sumeet Sawant, Content Development Editor
- Pranil Pathare, Technical Editor
- Sekolah: Packt Publishing
- Mata Pelajaran: Big Data Analytics
- Topik: Big Data Analytics
- Tipe: reference guide
- Tahun: 2016
- Kota: Birmingham
Ringkasan Dokumen
I. Big Data Analytics at a 10,000-Foot View
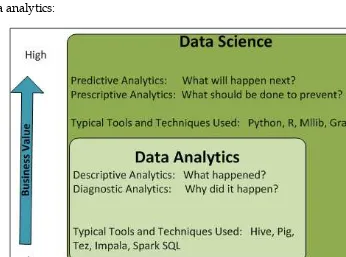
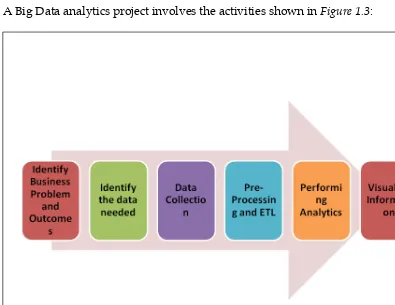
This section introduces Big Data analytics, emphasizing the significance of tools like Hadoop and Spark. It delineates the life cycle of a Big Data analytics project, highlighting the necessity of identifying business problems and desired outcomes. The section contrasts traditional data analytics with data science, illustrating their interconnectedness and distinct objectives. It outlines the various phases of a typical analytics project, including data identification, collection, preprocessing, analytics, and visualization. The role of Hadoop and Spark is also discussed, showcasing their capabilities in managing large datasets and facilitating flexible data processing.
1.1 Big Data analytics and the role of Hadoop and Spark
This subsection elaborates on the transition from traditional RDBMS to Hadoop's Schema-on-Read approach. It discusses the limitations of conventional data warehouses and the advantages of using Hadoop for analytics, such as flexibility and the ability to handle diverse data types. The integration of Spark with Hadoop for enhanced data processing capabilities is also emphasized, highlighting its benefits for data-driven innovation.
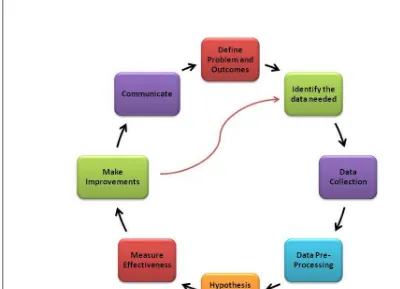
1.2 A typical Big Data analytics project life cycle
The project life cycle is detailed, outlining key stages such as problem identification, data collection, preprocessing, analytics, and visualization. Each phase is explained in terms of its importance in achieving successful analytics outcomes. The integration of various tools and techniques at each stage is also discussed, providing a comprehensive view of the analytics process.
1.3 Big Data science and the role of Hadoop and Spark
This subsection focuses on the evolution from data analytics to data science, emphasizing the need for predictive analytics and data products. It discusses the roles of data scientists and their differences from data analysts and software engineers. The integration of Hadoop and Spark in data science projects is highlighted, showcasing their advantages in extracting insights and building data-driven applications.
II. Getting Started with Apache Hadoop and Apache Spark
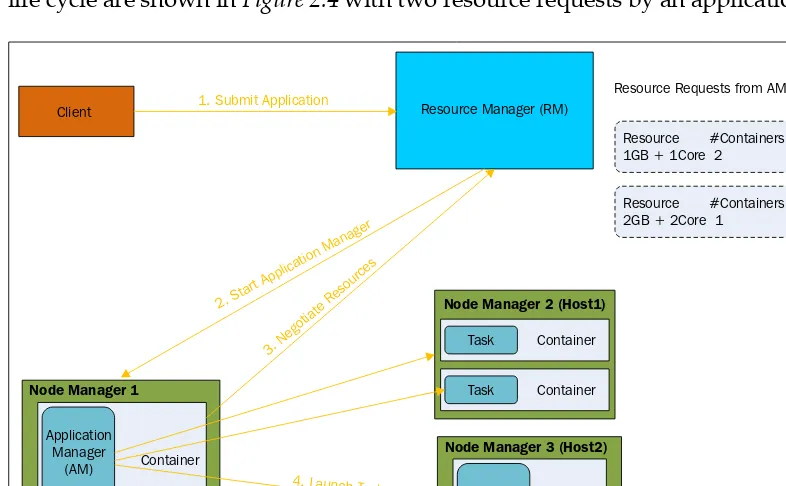
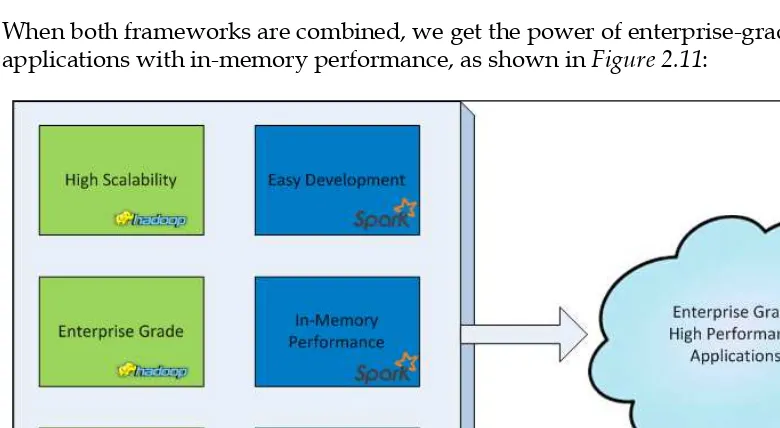
This section provides foundational knowledge on Apache Hadoop and Spark, discussing their architectures and the unique features that differentiate them. It covers the installation process of Hadoop and Spark clusters, explaining the prerequisites and setup requirements. The section also introduces key components like MapReduce, YARN, and various storage options, highlighting their roles in data processing. The advantages of using Spark in conjunction with Hadoop are emphasized, particularly in terms of performance and ease of use.
2.1 Introducing Apache Hadoop
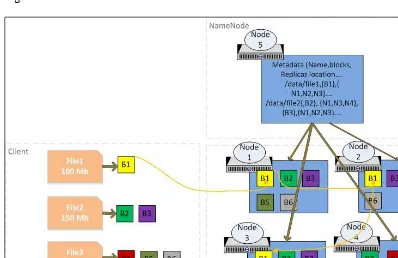
An overview of Hadoop is provided, detailing its architecture, core components, and the role of HDFS in data storage. The section explains how Hadoop handles large volumes of data and the importance of its distributed computing model.
2.2 MapReduce
This subsection delves into the MapReduce programming model, explaining its features and functionality. It contrasts MapReduce v1 with v2, addressing the challenges faced in earlier versions and the improvements introduced in v2.
2.3 Introducing Apache Spark
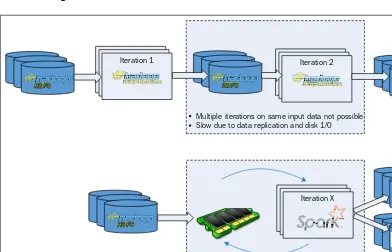
An introduction to Apache Spark is presented, highlighting its history and core features. The section explains what Spark is and what it is not, addressing common misconceptions and outlining its advantages over MapReduce.
III. Deep Dive into Apache Spark
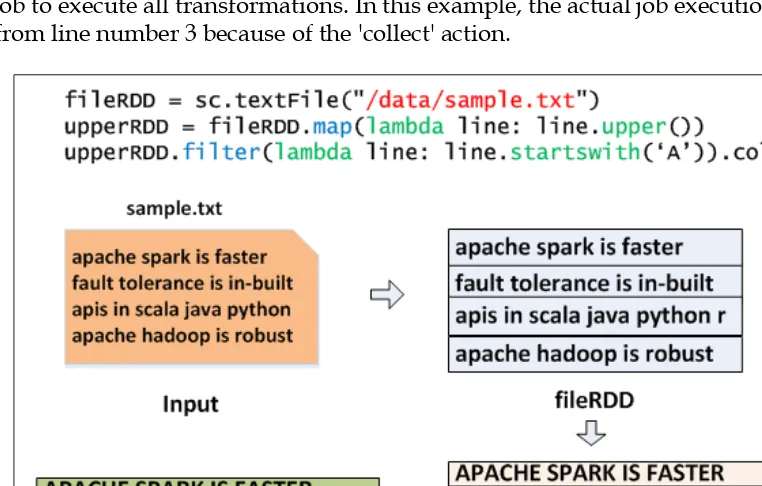
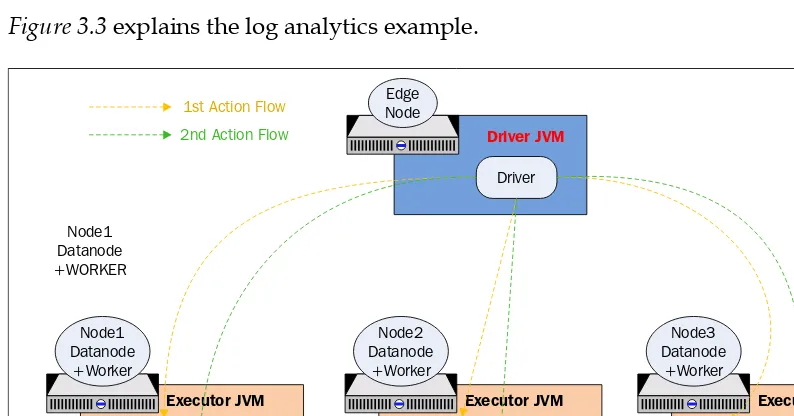
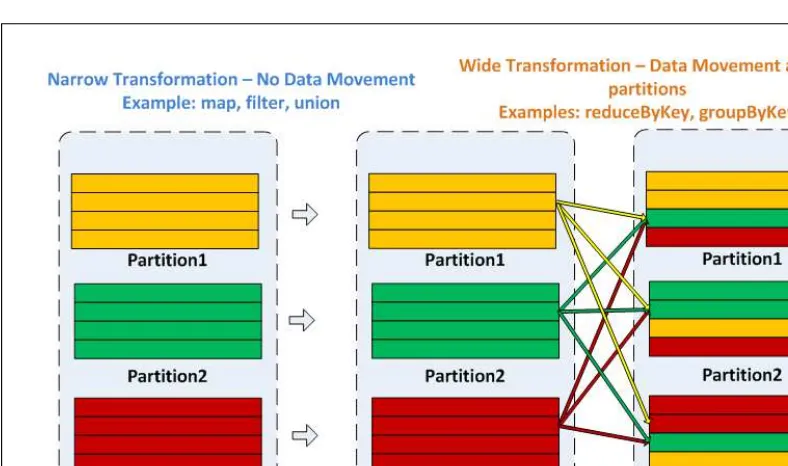
This section takes a comprehensive look at Spark's core concepts, including its architecture and execution model. It discusses the lifecycle of a Spark application, emphasizing concepts like Resilient Distributed Datasets (RDDs), transformations, and actions. The section also covers Spark's resource management capabilities and how to optimize performance through caching and persistence. Practical examples and code snippets are provided to illustrate key concepts, making it an invaluable resource for learners.
3.1 Starting Spark daemons
This subsection explains the process of starting Spark daemons and the configuration settings required for optimal performance. It provides insights into managing Spark applications effectively.
3.2 Learning Spark core concepts
Core concepts of Spark are explored in detail, including RDDs, transformations, and actions. The section emphasizes the importance of understanding these concepts for effective Spark programming.
IV. Big Data Analytics with Spark SQL, DataFrames, and Datasets
This section focuses on Spark SQL and the DataFrames and Datasets APIs, explaining their evolution and advantages over traditional RDDs. It discusses the architecture of Spark SQL and how it integrates with various data sources. The section highlights the importance of optimization techniques and provides practical examples of data manipulation and analysis using DataFrames. The benefits of using Spark SQL as a distributed SQL engine are also discussed, showcasing its utility in analytics applications.
4.1 History of Spark SQL
The historical development of Spark SQL is outlined, detailing its evolution and significance in the Spark ecosystem. The section emphasizes the need for a unified data processing model.
4.2 Analytics with DataFrames
This subsection provides practical examples of performing analytics with DataFrames, highlighting common operations and functions. It emphasizes the ease of data manipulation and the power of the DataFrame API.
V. Real-Time Analytics with Spark Streaming and Structured Streaming
This section introduces real-time processing concepts using Spark Streaming and Structured Streaming. It explains the architecture of Spark Streaming and discusses various processing techniques, including stateless and stateful processing. The section provides insights into integrating Spark Streaming with sources like Kafka and HBase, emphasizing the importance of fault tolerance and performance tuning. Practical examples illustrate the implementation of real-time analytics applications.
5.1 Introducing real-time processing
The fundamentals of real-time processing are introduced, explaining its significance in modern data analytics. The section discusses the advantages and challenges of implementing real-time analytics.
5.2 Pros and cons of Spark Streaming
This subsection evaluates the strengths and weaknesses of Spark Streaming, providing a balanced view of its capabilities in real-time analytics scenarios.
VI. Notebooks and Dataflows with Spark and Hadoop
This section explores the use of web-based notebooks like Jupyter and Apache Zeppelin for data analytics. It discusses their functionalities and how they enhance the data analysis experience. The section also introduces Apache NiFi for building data flows, explaining its role in managing data pipelines. Practical examples demonstrate how to use these tools effectively in conjunction with Spark and Hadoop.
6.1 Introducing web-based notebooks
An overview of web-based notebooks is provided, detailing their features and advantages for data analysis. The section emphasizes the interactivity and ease of use these tools offer.
6.2 Analytics with Jupyter
This subsection focuses on using Jupyter for analytics, providing practical examples and best practices for leveraging its capabilities in data analysis workflows.
VII. Machine Learning with Spark and Hadoop
This section aims to familiarize readers with machine learning techniques applicable in Spark and Hadoop environments. It covers various algorithms and their implementations, emphasizing the importance of building machine learning pipelines. The section discusses practical applications of machine learning in data science, providing examples that illustrate the concepts effectively. The integration of MLlib and other libraries is also highlighted, showcasing their utility in machine learning projects.
7.1 Introducing machine learning
An introduction to machine learning is presented, explaining its relevance in data science and the various algorithms used. The section sets the stage for deeper exploration of machine learning techniques.
7.2 Building machine learning pipelines
This subsection outlines the process of building machine learning pipelines in Spark, emphasizing the importance of structured workflows for model development and evaluation.
VIII. Building Recommendation Systems with Spark and Mahout
This section focuses on the development of recommendation systems using Spark and Mahout. It covers various filtering techniques, including collaborative filtering, and discusses the challenges associated with building effective recommendation systems. Practical examples illustrate the implementation of recommendation algorithms, providing insights into the design and evaluation of such systems. The integration of Spark with Mahout is also highlighted, showcasing its advantages in building scalable recommendation solutions.
8.1 Content-based filtering
An overview of content-based filtering techniques is provided, explaining their principles and applications in recommendation systems. The section discusses the advantages and limitations of this approach.
8.2 Collaborative filtering
This subsection delves into collaborative filtering methods, explaining user-based and item-based approaches. Practical examples illustrate how to implement these techniques in Spark.
IX. Graph Analytics with GraphX
This section introduces graph processing concepts and the GraphX library in Spark. It discusses various graph algorithms and operations, providing practical examples that illustrate their applications. The section emphasizes the importance of graph analytics in understanding complex relationships within data. It also introduces GraphFrames, showcasing how they extend the capabilities of GraphX for DataFrame integration.
9.1 Introducing graph processing
The fundamentals of graph processing are introduced, explaining its significance in data analytics. The section discusses the differences between graph databases and graph processing systems.
9.2 Graph algorithms
This subsection covers various graph algorithms available in GraphX, providing practical examples that illustrate their implementation and effectiveness in real-world scenarios.
X. Interactive Analytics with SparkR
This final section focuses on using SparkR for interactive analytics. It covers the installation and configuration of SparkR, explaining its architecture and functionalities. The section discusses how to leverage SparkR for data manipulation and machine learning, providing practical examples that illustrate its applications. The integration of SparkR with RStudio and other tools is also highlighted, showcasing its utility for data scientists and analysts.
10.1 Introducing R and SparkR
An introduction to R and SparkR is provided, explaining their relevance in data analytics and the advantages of using SparkR for big data applications.
10.2 Machine learning with SparkR
This subsection discusses machine learning techniques in SparkR, providing practical examples that illustrate how to implement models and evaluate their performance.