Informasi Dokumen
- Penulis:
- Simon Walkowiak
- Pengajar:
- Dr. Zacharias Voulgaris
- Dipanjan Sarkar
- Sekolah: University of Essex
- Mata Pelajaran: Data Science
- Topik: Big Data Analytics with R
- Tipe: book
- Tahun: 2016
- Kota: Birmingham
Ringkasan Dokumen
I. The Era of Big Data
This section introduces the concept of Big Data, emphasizing its significance in the contemporary data landscape. It discusses the challenges and opportunities presented by large datasets, particularly in relation to traditional data analysis methods. The section highlights the evolving toolbox for managing Big Data, including tools like Hadoop and Spark, which are essential for handling massive data volumes efficiently. The relevance of this content lies in its foundational role for students and professionals aiming to understand the dynamics of Big Data and its implications for various industries.
1.1 Big Data – The monster re-defined
In this subsection, Big Data is characterized by its complexity and the challenges it presents to traditional data processing methods. The discussion includes the varying perceptions of what constitutes 'Big Data' across different fields and the implications of these definitions. This is crucial for learners to grasp the conceptual breadth of Big Data, which forms the basis for further exploration of analytical techniques.
1.2 Big Data toolbox - dealing with the giant
This subsection outlines the essential tools and frameworks that have emerged to tackle Big Data challenges. It introduces Hadoop as a pivotal technology in the Big Data ecosystem, setting the stage for deeper dives into specific tools in subsequent chapters. Understanding this toolbox is vital for students as it equips them with the knowledge to select appropriate technologies for data management tasks.
II. Introduction to R Programming Language and Statistical Environment
This chapter serves as an introduction to R, detailing its capabilities as a statistical programming language. It covers the fundamental data structures in R, including vectors, matrices, and data frames, which are essential for data manipulation and analysis. The chapter also emphasizes the importance of R in performing exploratory data analysis and hypothesis testing, which are critical skills for data analysts and researchers. This foundational knowledge is integral to achieving learning outcomes related to data analysis proficiency.
2.1 Learning R
This subsection provides a step-by-step guide to getting started with R, including installation and setup. It emphasizes the significance of R in the context of Big Data analytics, preparing learners to utilize R effectively in their data analysis tasks.
2.2 R data structures
An exploration of R's data structures is presented here, focusing on their roles in data analysis. Understanding these structures is fundamental for students, as they form the building blocks for more complex data manipulation and analysis techniques.
III. Unleashing the Power of R from Within
This section addresses the limitations traditionally associated with R, particularly regarding memory management and processing speed. It introduces advanced packages that enhance R's capabilities for handling large datasets, making it a viable option for Big Data analytics. The insights gained here are crucial for students aiming to optimize their R programming skills for real-world applications, particularly in data-heavy environments.
3.1 Traditional limitations of R
This subsection discusses the inherent limitations of R in processing large datasets and the common challenges users face. Understanding these limitations allows learners to appreciate the need for supplementary tools and techniques in Big Data analytics.
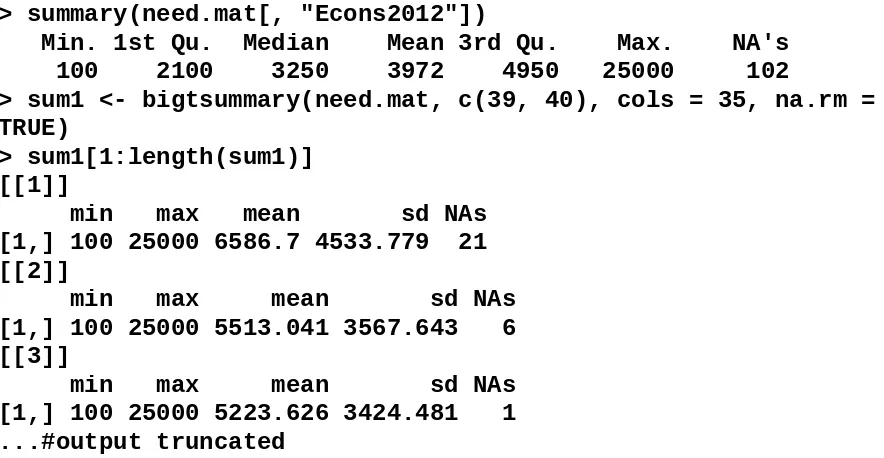
3.2 Expanding memory with the bigmemory package
Here, the focus is on the bigmemory package, which facilitates the handling of large matrices in R. This knowledge is essential for students who need to work with data that exceeds the typical memory limits of R, thus broadening their analytical capabilities.
IV. Hadoop and MapReduce Framework for R
This chapter introduces Hadoop and the MapReduce framework, essential components of the Big Data ecosystem. It explains how these technologies can be integrated with R to enhance data processing capabilities. The content is highly relevant for students as it provides practical knowledge on deploying Hadoop for large-scale data analysis, which is a critical skill in the field of data science.
4.1 Hadoop architecture
An overview of Hadoop's architecture is provided, detailing its components and how they interact. This foundational knowledge is necessary for understanding how to leverage Hadoop for Big Data analytics.
4.2 MapReduce framework
This subsection delves into the MapReduce programming model, explaining its phases and how it processes large datasets. Mastery of MapReduce is essential for students looking to implement efficient data processing workflows.
V. R with Relational Database Management Systems (RDBMSs)
This section covers the integration of R with relational databases, providing a comprehensive overview of how to manage and query data stored in RDBMSs. It emphasizes the importance of SQL in data manipulation and retrieval, which is crucial for students aiming to work with structured data. This knowledge enhances their data management skills, making them more versatile in their analytical capabilities.
5.1 Structured Query Language (SQL)
An introduction to SQL is presented, highlighting its role in interacting with RDBMSs. Understanding SQL is fundamental for students as it equips them with the skills necessary to perform complex queries and data manipulations.
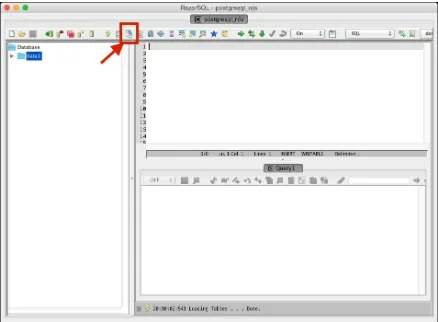
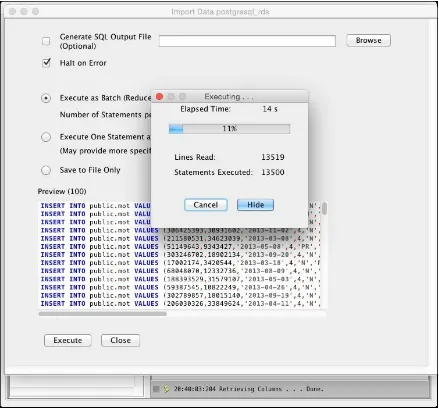
5.2 SQLite with R
This subsection focuses on using SQLite, a lightweight database, with R. It provides practical examples that enhance students' understanding of database interactions and data retrieval processes.
VI. R with Non-Relational (NoSQL) Databases
This chapter introduces NoSQL databases, explaining their relevance in handling unstructured data and real-time analytics. It discusses how R can interact with popular NoSQL databases like MongoDB and HBase, providing students with the skills to work with diverse data types. This knowledge is essential for adapting to the evolving landscape of data storage and retrieval.
6.1 Introduction to NoSQL databases
An overview of NoSQL databases is provided, emphasizing their advantages over traditional RDBMSs. This understanding is crucial for students as they learn to navigate the complexities of modern data environments.
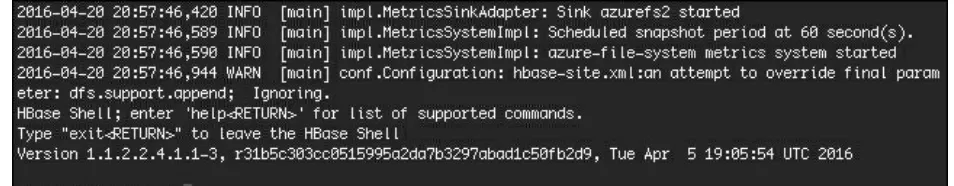
6.2 MongoDB with R
This subsection details the integration of MongoDB with R, focusing on practical applications and data manipulation techniques. Mastering this integration is key for students seeking to analyze large volumes of unstructured data.
VII. Faster than Hadoop - Spark with R
This section highlights the advantages of using Spark over Hadoop for Big Data processing. It explains how Spark can significantly enhance data manipulation speed and efficiency when used with R. Understanding Spark's capabilities is essential for students aiming to implement high-performance data analysis solutions.
7.1 Spark for Big Data analytics
An introduction to Spark is provided, detailing its architecture and advantages in handling large datasets. This foundational knowledge is critical for students as they explore advanced data processing techniques.
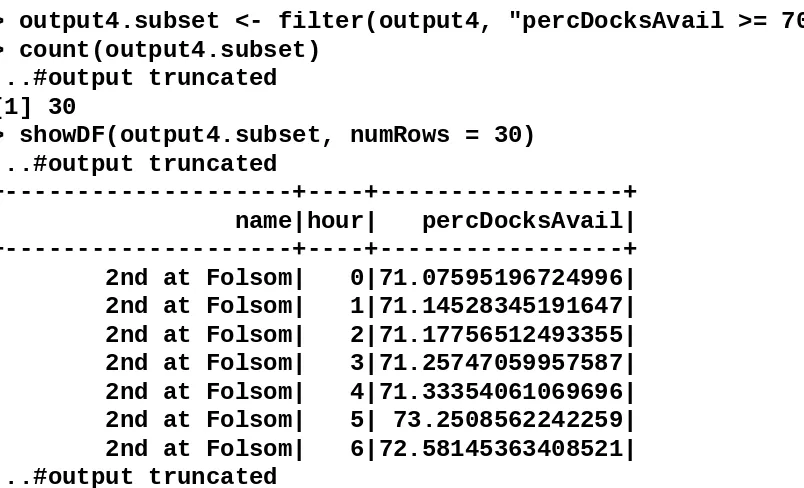
7.2 Bay Area Bike Share analysis using SparkR
This practical example demonstrates the application of SparkR for real-world data analysis. Engaging with such examples enhances students' practical skills and prepares them for real-world data challenges.
VIII. Machine Learning Methods for Big Data in R
This chapter explores machine learning techniques applicable to Big Data using R. It covers both supervised and unsupervised learning methods, providing students with a comprehensive understanding of predictive analytics. This knowledge is vital for those looking to apply machine learning in data-driven decision-making processes.
8.1 What is machine learning?
An introduction to machine learning concepts is provided, emphasizing its relevance in Big Data analytics. Understanding these concepts is essential for students as they embark on learning advanced analytical techniques.
8.2 Machine learning methods with R
This subsection discusses various machine learning algorithms and their implementations in R. Mastering these methods equips students with the skills necessary for conducting advanced data analyses.
IX. The Future of R - Big, Fast, and Smart Data
This concluding chapter reflects on the current state of R in the Big Data landscape and discusses future trends and developments. It emphasizes the ongoing evolution of data analytics tools and the importance of staying updated with emerging technologies. This content is relevant for students as it prepares them for future challenges and opportunities in the field of data science.
9.1 The current state of Big Data analytics with R
An overview of R's role in Big Data analytics is provided, highlighting its strengths and areas for improvement. This understanding is crucial for students as they assess the effectiveness of R in various data scenarios.
9.2 Where to go next
This subsection offers guidance on future learning paths and resources for students interested in advancing their knowledge of Big Data analytics with R. Preparing students for continuous learning is essential in the rapidly evolving field of data science.