• •
•
•
•
Components
of Strategic
Decision
Making
Stephan Kudyba
Foreword by Thomas H. Davenport
Big Data,
Big Data,
Mining, and
Analytics
Components of
Big Data,
Mining, and
Analytics
Components of
Strategic Decision Making
Stephan Kudyba
Boca Raton, FL 33487-2742
© 2014 by Taylor & Francis Group, LLC
CRC Press is an imprint of Taylor & Francis Group, an Informa business
No claim to original U.S. Government works Version Date: 20140203
International Standard Book Number-13: 978-1-4665-6871-6 (eBook - PDF)
This book contains information obtained from authentic and highly regarded sources. Reasonable efforts have been made to publish reliable data and information, but the author and publisher cannot assume responsibility for the validity of all materials or the consequences of their use. The authors and publishers have attempted to trace the copyright holders of all material reproduced in this publication and apologize to copyright holders if permission to publish in this form has not been obtained. If any copyright material has not been acknowledged please write and let us know so we may rectify in any future reprint.
Except as permitted under U.S. Copyright Law, no part of this book may be reprinted, reproduced, transmit-ted, or utilized in any form by any electronic, mechanical, or other means, now known or hereafter inventransmit-ted, including photocopying, microfilming, and recording, or in any information storage or retrieval system, without written permission from the publishers.
For permission to photocopy or use material electronically from this work, please access www.copyright. com (http://www.copyright.com/) or contact the Copyright Clearance Center, Inc. (CCC), 222 Rosewood Drive, Danvers, MA 01923, 978-750-8400. CCC is a not-for-profit organization that provides licenses and registration for a variety of users. For organizations that have been granted a photocopy license by the CCC, a separate system of payment has been arranged.
Trademark Notice: Product or corporate names may be trademarks or registered trademarks, and are used only for identification and explanation without intent to infringe.
members, Lauren and Kirsten, who through their evolving curiosity have reminded me that you never stop learning, no matter what age you are. Perhaps they will grow up to become analysts . . . perhaps
not. Wherever their passion takes them, they will be supported.
To the contributors to this work, sincere gratitude for taking the time to share their expertise to enlighten the marketplace of an evolving era, and to Tom Davenport for his constant leadership in promoting
vii
Foreword ...ix
About the Author ... xiii
Contributors ... xv
Chapter 1 Introduction to the Big Data Era ... 1
Stephan Kudyba and Matthew Kwatinetz Chapter 2 Information Creation through Analytics ... 17
Stephan Kudyba Chapter 3 Big Data Analytics—Architectures, Implementation Methodology, and Tools ... 49
Wullianallur Raghupathi and Viju Raghupathi Chapter 4 Data Mining Methods and the Rise of Big Data ... 71
Wayne Thompson Chapter 5 Data Management and the Model Creation Process of Structured Data for Mining and Analytics ... 103
Stephan Kudyba Chapter 6 The Internet: A Source of New Data for Mining in Marketing ... 129
Robert Young Chapter 7 Mining and Analytics in E-Commerce ... 147
Stephan Kudyba Chapter 8 Streaming Data in the Age of Big Data... 165
Chapter 9 Using CEP for Real-Time Data Mining ... 179
Steven Barber
Chapter 10 Transforming Unstructured Data into Useful
Information ... 211
Meta S. Brown
Chapter 11 Mining Big Textual Data ... 231
Ioannis Korkontzelos
Chapter 12 The New Medical Frontier: Real-Time Wireless Medical Data Acquisition for 21st-Century
Healthcare and Data Mining Challenges ... 257
ix
Big data and analytics promise to change virtually every industry and business function over the next decade. Any organization that gets started early with big data can gain a significant competitive edge. Just as early analytical competitors in the “small data” era (including Capital One bank, Progressive Insurance, and Marriott hotels) moved out ahead of their competitors and built a sizable competitive edge, the time is now for firms to seize the big data opportunity.
As this book describes, the potential of big data is enabled by ubiqui-tous computing and data gathering devices; sensors and microproces-sors will soon be everywhere. Virtually every mechanical or electronic device can leave a trail that describes its performance, location, or state. These devices, and the people who use them, communicate through the Internet—which leads to another vast data source. When all these bits are combined with those from other media—wireless and wired telephony, cable, satellite, and so forth—the future of data appears even bigger.
The availability of all this data means that virtually every business or organizational activity can be viewed as a big data problem or initiative. Manufacturing, in which most machines already have one or more micro-processors, is increasingly becoming a big data environment. Consumer marketing, with myriad customer touchpoints and clickstreams, is already a big data problem. Google has even described its self-driving car as a big data project. Big data is undeniably a big deal, but it needs to be put in context.
Although it may seem that the big data topic sprang full blown from the heads of IT and management gurus a couple of years ago, the concept actually has a long history. As Stephan Kudyba explains clearly in this book, it is the result of multiple efforts throughout several decades to make sense of data, be it big or small, structured or unstructured, fast moving or quite still. Kudyba and his collaborators in this volume have the knowl-edge and experience to put big data in the broader context of business and organizational intelligence.
data is not being treated separately from the more traditional forms of analytics. Instead, it is being combined with traditional approaches into a hybrid capability within organizations.
There is, of course, considerable information in the book about big data alone. Kudyba and his fellow experts have included content here about the most exciting and current technologies for big data—and Hadoop is only the beginning of them. If it’s your goal to learn about all the technologies you will need to establish a platform for processing big data in your orga-nization, you’ve come to the right place.
These technologies—and the subject of big data in general—are exciting and new, and there is no shortage of hype about them. I may have contrib-uted to the hype with a coauthored article in the Harvard Business Review
called “Data Scientist: The Sexiest Job of the 21st Century” (although I credit the title to my editors). However, not all aspects of big data are sexy. I remember thinking when I interviewed data scientists that it was not a job I would want; there is just too much wrestling with recalcitrant data for my skills and tastes.
Kudyba and his collaborators have done a good job of balancing the sexy (Chapter 1, for example) and the realistic (Chapter 5, for example). The lat-ter chaplat-ter reminds us that—as with traditional analytics—we may have to spend more time cleaning, integrating, and otherwise preparing data for analysis than we do actually analyzing it. A major part of the appeal of big data is in combining diverse data types and formats. With the new tools we can do more of this combining than ever before, but it’s still not easy.
Many of the applications discussed in this book deal with marketing— using Internet data for marketing, enhancing e-commerce marketing with analytics, and analyzing text for information about customer senti-ments. I believe that marketing, more than any other business function, will be reshaped dramatically by big data and analytics. Already there is very strong demand for people who understand both the creative side of marketing and the digital, analytical side—an uncommon combination. Reading and learning from Chapters 6, 7, 10, and others will help to pre-pare anyone for the big data marketing jobs of the future.
The discussions and examples in the book are spread across different industries, such as Chapter 12 on evolving data sources in healthcare. We can now begin to combine structured information about patients and treat-ments in electronic medical record systems with big data from medical equipment and sensors. This unprecedented amount of information about patients and treatments should eventually pay off in better care at lower cost, which is desperately needed in the United States and elsewhere. However, as with other industry and functional transformations, it will take consider-able work and progress with big data before such benefits can be achieved.
In fact, the combination of hope and challenge is the core message of this book. Chapters 10 and 11, which focus on the mining and automated interpretation of textual data, provide an exemplary illustration of both the benefits from this particular form of big data analytics and the hard work involved in making it happen. There are many examples in these two chapters of the potential value in mining unstructured text: customer sentiment from open-ended surveys and social media, customer service requests, news content analysis, text search, and even patent analysis. There is little doubt that successfully analyzing text could make our lives and our businesses easier and more successful.
However, this field, like others in big data, is nothing if not challeng-ing. Meta Brown, a consultant with considerable expertise in text mining, notes in Chapter 10, “Deriving meaning from language is no simple task,” and then provides a description of the challenges. It is easy to suggest that a firm should analyze all the text in its customers’ blogs and tweets, or that it should mine its competitors’ patents. But there are many difficulties involved in disambiguating text and dealing with quintessentially human expressions like sarcasm and slang. As Brown notes, even the best auto-mated text analysis will be only somewhat correct.
As we move into the age of big data, we’ll be wrestling with these imple-mentation challenges for many years. The book you’re about to read is an excellent review of the opportunities involved in this revolution, but also a sobering reminder that no revolution happens without considerable effort, money, and false starts. The road to the Big Data Emerald City is paved with many potholes. Reading this book can help you avoid many of them, and avoid surprise when your trip is still a bit bumpy.
xv
New Jersey Institute of Technology Newark, New Jersey
Matthew Kwatinetz
QBL Partners New York, New York
David Lubliner
New Jersey Institute of Technology Newark, New Jersey
Viju Raghupathi
Brooklyn College
1
1
Introduction to the Big Data Era
Stephan Kudyba and Matthew Kwatinetz
By now you’ve heard the phrase “big data” a hundred times and it’s intrigued you, scared you, or even bothered you. Whatever your feeling is, one thing that remains a source of interest in the new data age is a clear understanding of just what is meant by the concept and what it means for the realm of commerce. Big data, terabytes of data, mountains of data, no matter how you would like to describe it, there is an ongoing data explo-sion transpiring all around us that makes previous creations, collections, and storage of data merely trivial. Generally the concept of big data refers
CONTENTS
Description of Big Data ...2
Building Blocks to Decision Support ...4
Source of More Descriptive Variables ...5
Industry Examples of Big Data ...6
Electioneering ...6
Investment Diligence and Social Media ...7
Real Estate ...8
Specialized Real Estate: Building Energy Disclosure and Smart Meters ...9
Commerce and Loyalty Data ...9
Crowd-Sourced Crime Fighting ...10
Pedestrian Traffic Patterns in Retail ...10
Intelligent Transport Application ...11
Descriptive Power and Predictive Pattern Matching ...11
The Value of Data ...13
Closing Comments on Leveraging Data through Analytics ...14
Ethical Considerations in the Big Data Era ...14
to the sources, variety, velocities, and volumes of this vast resource. Over the next few pages we will describe the meaning of these areas to provide a clearer understanding of the new data age.
The introduction of faster computer processing through Pentium tech-nology in conjunction with enhanced storage capabilities introduced back in the early 1990s helped promote the beginning of the information economy, which made computers faster, better able to run state-of-the-art software devices, and store and analyze vast amounts of data (Kudyba, 2002). The creation, transmitting, processing, and storage capacities of today’s enhanced computers, sensors, handheld devices, tablets, and the like, provide the platform for the next stage of the information age. These super electronic devices have the capabilities to run numerous applica-tions, communicate across multiple platforms, and generate, process, and store unimaginable amounts of data. So if you were under the impression that big data was just a function of e-commerce (website) activity, think again. That’s only part of the very large and growing pie.
When speaking of big data, one must consider the source of data. This involves the technologies that exist today and the industry applications that are facilitated by them. These industry applications are prevalent across the realm of commerce and continue to proliferate in countless activities:
• Marketing and advertising (online activities, text messaging, social media, new metrics in measuring ad spend and effectiveness, etc.) • Healthcare (machines that provide treatment to patients, electronic
health records (EHRs), digital images, wireless medical devices) • Transportation (GPS activities)
• Energy (residential and commercial usage metrics)
• Retail (measuring foot traffic patterns at malls, demographics analysis) • Sensors imbedded in products across industry sectors tracking usage
These are just a few examples of how industries are becoming more data intensive.
DESCRIPTION OF BIG DATA
different types/formats of data resources. The data we are referring to isn’t just numbers that depict amounts, or performance indicators or scale. Data also includes less structured forms, such as the following elements:
• Website links • Emails
• Twitter responses • Product reviews • Pictures/images
• Written text on various platforms
What big data entails is structured and unstructured data that correspond to various activities. Structured data entails data that is categorized and stored in a file according to a particular format description, where unstruc-tured data is free-form text that takes on a number of types, such as those listed above. The cell phones of yesteryear have evolved into smartphones capable of texting, surfing, phoning, and playing a host of software-based applications. All the activities conducted on these phones (every time you respond to a friend, respond to an ad, play a game, use an app, conduct a search) generates a traceable data asset. Computers and tablets connected to Internet-related platforms (social media, website activities, advertis-ing via video platform) all generate data. Scannadvertis-ing technologies that read energy consumption, healthcare-related elements, traffic activity, etc., cre-ate data. And finally, good old traditional platforms such as spreadsheets, tables, and decision support platforms still play a role as well.
The next concept to consider when merely attempting to understand the big data age refers to velocities of data, where velocity entails how quickly data is being generated, communicated, and stored. Back in the beginning of the information economy (e.g., mid-1990s), the phrase “real time” was often used to refer to almost instantaneous tracking, updating, or some activities revolving around timely processing of data. This phrase has taken on a new dimension in today’s ultra-fast, wireless world. Where real time was the goal of select industries (financial markets, e-commerce), the phrase has become commonplace in many areas of commerce today:
Real time involves high-velocity or fast-moving data and fast genera-tion of data that results in vast volumes of the asset. Non-real-time data or sources of more slowly moving data activities also prevail today, where the volumes of data generated refer to the storage and use of more historic data resources that continue to provide value. Non-real time refers to mea-suring events and time-related processes and operations that are stored in a repository:
• Consumer response to brand advertising • Sales trends
• Generation of demographic profiles
As was mentioned above, velocity of data directly relates to volumes of data, where some real-time data quickly generate a massive amount in a very short time. When putting an amount on volume, the following sta-tistic explains the recent state of affairs: as of 2012, about 2.5 exabytes of data is created each day. A petabyte of data is 1 quadrillion bytes, which is the equivalent of about 20 million file cabinets’ worth of text, and an exabyte is 1000 times that amount. The volume comes from both new data variables and the amount of data records in those variables.
The ultimate result is more data that can provide the building blocks to information generation through analytics. These data sources come in a variety of types that are structured and unstructured that need to be man-aged to provide decision support for strategists of all walks (McAfee and Brynjolfsson, 2012).
BUILDING BLOCKS TO DECISION SUPPORT
Data itself is a record of an event or a transaction:
A purchase of a product
A response to a marketing initiative A text sent to another individual A click on a link
In its crude form, data provides little value. However, if data is cor-rected for errors, aggregated, normalized, calculated, or categorized, its value grows dramatically. In other words, data are the building blocks to information, and information is a vital input to knowledge generation for decision makers (Davenport and Prusak, 2000). Taking this into consider-ation, the “big” part of big data can actually augment value significantly to those who use it correctly. Ultimately, when data is managed correctly, it provides a vital input for decision makers across industry sectors to make better decisions.
So why does big data imply a significant increase in the value of data? Because big data can provide more descriptive information as to why something has happened:
Why and who responded to my online marketing initiative? What do people think of my product and potentially why? What factors are affecting my performance metrics? Why did my sales increase notably last month? What led my patient treatment outcomes to improve?
SOURCE OF MORE DESCRIPTIVE VARIABLES
descriptive information that affects your decision. As a result, you locate your store in what seems to be a strategically appropriate space, but for some reason, the traffic for your business just isn’t there. You may want to know what the market thinks of your new product idea, but unfortu-nately you were only able to obtain 1000 responses to your survey of your target population. The result is you make decisions with the limited data resources you have. However, if you text your question to 50,000 of your target population, your results may be more accurate, or let’s say, more of an indication of market sentiment.
As technology continues to evolve and become a natural part of every-one’s lives, so too does the generation of new data sources. The last few years have seen the explosion of mobile computing: the smartphone may be the most headlining example, but the trend extends down to your laun-dry machine, sprinkler system, and the label on the clothing that you bought retail. One of the most unexpected and highest impact trends in this regard is the ability to leverage data variables that describe activities/ processes. We all know that technology has provided faster, better com-puters—but now the trend is for technology to feed in the generation of never before seen data at a scale that is breathtaking. What follows are some brief examples of this.
The following illustrations depict the evolution of big data in various industry sectors and business scenarios. Just think of the new descriptive variables (data resources) that can be analyzed in these contemporary sce-narios as opposed to the ancient times of the 1990s!
INDUSTRY EXAMPLES OF BIG DATA
Electioneering
ever-important fund-raising initiatives as well. Campaigners are able to leverage the power of big data and focus on micro-donations and the viral power of the Internet to spread the word—more dollars were raised through this vehicle than had been seen in history. The key function of the use of the big data allowed local supporters to organize other local sup-porters, using social networking software and self-identified zip code and neighborhood locations. That turned data resources locational, adding a new dimension of information to be exploited, polled, and aggregated to help determine where bases of support were stronger/weaker. Where will it go next? It is likely that in the not-so-distant future we will find voter registrations tagged to mobile devices, and the ability to circum-vent statistical sampling polls with actual polls of the population, sorted by geography, demography, and psychographics. Democratic campaign managers estimate that they collected 13 million email addresses in the 2008 campaign, communicating directly with about 20% of the total votes needed to win. Eric Schmidt (former CEO of Google) says that since 2008, the game has completely changed: “In 2008 most people didn’t operate on [Facebook and Twitter]. The difference now is, first and foremost, the growth of Facebook, which is much, much more deeply penetrated . . . you can run political campaigns on the sum of those tools [Facebook, YouTube and Twitter]” (quotes from Bloomberg Business Week, June 18–24, 2012; additional info from Tumulty, 2012).
Investment Diligence and Social Media
can make investment choices on one product vs. another—or on the gen-eral investor sentiment. This information does not replace existing invest-ment diligence, but in fact adds to the depth and quality (or lack thereof sometimes!) of analysis.
Real Estate
Specialized Real Estate: Building Energy Disclosure and Smart Meters
Over 40% of energy use and carbon emissions in the United States come from existing buildings (http://www.eia.gov/consumption/com-mercial/index.cfm). To put this in perspective, if you combined the energy use and emissions output of all of the SUVs on the road in North America, this would be approximately 3%. So you can see that the use of energy by existing buildings is a very important piece of data. Until recently, this data has been held in many different data-bases for utilities across the country, with no central repository or easy means for reconciling these data sets. Today, three trends have picked up: (1) energy disclosure ordinances, (2) satellite heat map data, and (3) data warehousing aggregations based on smart meters. The amount of data needed here to control for effective information is staggering: any analysis must account for building size, use, geographic location, seasonality, climactic variation, occupancy, etc. In many of these cases, information is collected on a granularity of 1–15 minutes! That is for every building, in every city, in every state in the country: billions of data points per day (http://www.eebhub.org/).
Commerce and Loyalty Data
to connect with or apply for a job from. Moreover, it is not just informa-tion from their own site that these online merchants can now pull from— the trend has now reclaimed the point-of-sale data from brick-and-mortar stores as well. Retailers integrate physical data with online point-of-sale data, and can also view what other sites you visit, where else you make purchases, who makes purchases for you, and what “like-minded shop-pers” may be in your network.
Crowd-Sourced Crime Fighting
In an effort to aid local policing efforts, policing has found a new ally: you! Over the last decade “hot spot” policing has become the effective leading strategy for reducing crime: take careful record of where crime occurs, measure density regions, and overwhelm the highest density regions with extremely quick and overpowering responses. However, this strategy still relies on actually being able to track all of the crime incidents—no small task, as the force’s personnel have limited resources. Enter the crowd sourcing platforms. Some cities have created apps for mobile devices (or other interfaces) that allow individual citizens to upload informa-tion that indicates crimes they have witnessed (http://spotcrime.com/ga/ augusta)! The upload contains the description of the crime, a geographic location, and a time stamp. As participation increases, so too do “eyes on the street,” and the map is filled with the information needed to improve police performance.
Pedestrian Traffic Patterns in Retail
promotion to the customer’s phone before he or she leaves the store, offering a discount on—you guessed it—leather goods. This is only the beginning of this technology. Expect to see it deployed in cities to track crime patterns, the safety of certain intersections, and more (http:// techcrunch.com/2007/12/14/path-intelligence-monitors-foot-traffic-in-retail-stores-by-pinging-peoples-phones/; http://allthingsd.com/20111103/ ex-googlers-raise-5-8-million-to-help-retailers-track-foot-traffic/).
Intelligent Transport Application
New applications being developed for smartphones pool voluntarily offered information from unique sources into a real-time database provid-ing an instant advantage from the use of big data. Uber, a mobile phone-based transportation application, connects drivers (of limousines, taxis) with potential passengers. As each driver “opts in” to uber from his or her phone, the phone sends a GPS signal update to the master Uber map. When a passenger is ready for a ride, the passenger turns on his or her Uber signal and effectively puts out an electronic thumb. Both passen-ger and driver receive an instant updated map with the potential matches to be found as moving dots across the map, with estimates of congestion (which influence pricing), as well as arrival information. In a similar fash-ion, Waze is a transport application for local drivers. When drivers get in their car, they turn on Waze, which utilizes the phone’s GPS tracker, motion sensors, and built-in geographic road information (speed limits, lights, stop signs) to estimate the level of traffic you are experiencing while driving. Waze then merges your information with all other local drivers’ information, creating a real-time picture of road traffic. The application also allows for the reporting of police presence, traffic, accidents, and not-to-miss sights! In essence, this application creates a virtual cloud of self-reported big data.
DESCRIPTIVE POWER AND PREDICTIVE
PATTERN MATCHING
location data from mobile phones to estimate the number of shoppers at a particular department store on the biggest shopping day of the year: Black Friday. By combining this information with historical sales data, demo-graphics of the trade region surrounding the department store, and other relevant factors (macroeconomic, weather, etc.), the team was able to predict retail sales on that day even before the department store itself could (McAfee and Brynjolfsson, 2012)! Another example of the same practice comes from Farecast.com (now owned by Microsoft and accessed through Bing). By aggregating pricing information from all airlines and comparing it to his-torical information as well as statistically correlated databases that signal pricing, Farecast is able to accurately predict whether the price of a specific airline ticket will go up or down in the near, mid, or short term. At one point it even offered insurance to guarantee the accuracy of its information (http:// www.upgradetravelbetter.com/2006/11/13/fare-guarantee-farecast-lets-you-insure-its-fare-predictions/)! Other examples of this approach include pre-dicting housing price changes in the United States with publicly available web information (Wu and Brynjolfsson, 2009) and the Center for Disease Control (CDC) using tweets (twitter.com) to predict the spread of disease, such as cholera in Haiti. In development today is the Square Kilometre Array (SKA), a telescope that is being designed to crunch 300–1500 pet-abytes of data a year. Just how much data is that? “If you take the current global daily internet traffic and multiply it by two, you are in the range of the data set that the Square Kilometre Array radio telescope will be collecting every day,” says IBM researcher Tom Engbersen. “This is big data analytics to the extreme” (Peckham, 2012).
activities is a daunting task and requires not only competent analysts, but also the inclusion of subject matter experts and data experts. This book will address the various activities that must be undertaken in order to fully leverage data to create true value for organizations. Remember, analytic techniques of all types are not self-generating methods for decision makers. Skilled professionals are essential to guide the process. Just consider some of the questions below regarding data that potentially describe processes:
• Do Twitter responses reflect accurate consumer sentiment toward events (was the tweet an overreaction or misinterpretation of the reported occurrence?)?
• Were survey questions interpreted correctly by responders? • Do LinkedIn connections share the same business interests? • Do Facebook friends share the same product interests?
• Do the demographics generated from credit card purchases truly reflect the profile of the consumer purchasing the product (did younger consumers borrow parents’ credit cards?)?
THE VALUE OF DATA
CLOSING COMMENTS ON LEVERAGING
DATA THROUGH ANALYTICS
Data resources can provide value to organizations from the information that can be extracted from them. This extraction process involves query-ing data resources for particular variables at particular levels of aggre-gation in a particular format, and then initiating some type of analytic process. However, before conducting any of these activities, one essential task that underpins the information creation initiative involves the cre-ation of a conceptual model. In other words, whether you have terabytes of data or just a few thousand records, whether you are considering trends over the past few years or focusing on real-time data feeds, decision mak-ers must determine what questions they are looking to answer with data and information. This process can be classified as a conceptual model. Consider using analytics to address the following scenario (e.g., what data variables and level of detail are needed to provide relevant information).
As a hospital administrator, you are looking to analyze those factors that impact the patients’ satisfaction metric that describes their experience while being treated at your hospital.
No matter what industry you operate in, the bottom line to the decision-making process is that individuals must rigorously deliberate over what they are looking to better understand. Once this has been established, the process of leveraging data resources can be undertaken. That process then entails extracting the relevant data variables at corresponding lev-els of detail and initiating an analytic framework. This concept will be addressed in greater detail in Chapter 5.
ETHICAL CONSIDERATIONS IN THE BIG DATA ERA
in mind when dealing with data resources, with a particular emphasis on data that describes individuals.
This book does not promote or support heavy- or underhanded, con-troversial techniques in acquiring extensive personal data. Individuals should be made aware of how data is generated and gathered regarding their everyday activities, and privacy and security rules should be strictly adhered to. Ultimately, this book adheres to the notion that the manage-ment of data resources and analytics should be conducted to yield positive outcomes for processes and individuals who interact with them.
REFERENCES
Cha, A.E. “Big Data” from Social Media, Elsewhere Online Redefines Trend-Watching. Washington Post, June 6, 2012.
Davenport, T., and Prusak, L.Working Knowledge. Harvard Business Review Press, Boston,
Massachusetts, 2000.
Kudyba, S. Information Technology, Corporate Productivity, and the New Economy. Westport,
Connecticut: Quorum Books. 2002.
McAfee, A., and Brynjolfsson, E. Big Data: The Management Revolution. Harvard Business
Review, October 2012, pp. 60–62.
Peckham, M. IBM to Help Research and Develop ‘Exascale’ Supercomputing Telescope. Time Magazine, April 2, 2012. http://techland.time.com/2012/04/02/ibm-to-help- research-and-develop-exascale-supercomputing-telescope/.
Tumulty, K. Twitter Becomes a Key Real-Time Tool for Campaigns. Washington Post, April
26, 2012.
What the Experts Say: Twitter Guided Trading. The Week, June 14, 2012.
Wu, L., and Brynjolfsson, E. The Future of Prediction: How Google Searches Foreshadow
Housing Prices and Quantities. In ICIS 2009 Proceedings, 2009, paper 147. http://
17
2
Information Creation through Analytics
Stephan Kudyba
The primary initiative in leveraging the value of data resources lies in the realm of analytics. This term, however, encompasses a wide variety of methodologies that can provide descriptive, comparative, and predictive information for the end user. This chapter will provide a brief background and description of some noteworthy analytic approaches as applied to more historical, structured data and include references to big data issues
CONTENTS
Introduction to the Concept of Analytics ...19 Business Intelligence ...19 Reports ...19 Pivot Tables ...21 Dynamic Reporting through OLAP ...21 Analytics at a Glance through Dashboards ...25 Robust BI and Drill-Down behind Dashboard Views ...26 Data Mining and the Value of Data ... 28 Why Things Are Happening ... 28 What Is Likely to Happen ...29 Real-Time Mining and Big Data ... 30 Analysis of Unstructured Data and Combining Structured
along the way. The area of big data and analytics will be addressed in greater detail in the real time and continuous analysis section at the end of this chapter and in Chapter 3.
Analytic methods can range from simple reports, tables, and graphics to more statistically based endeavors to quantitative-based methods. We provided some analytic approaches according to some commonly referred to categories below. Regardless of the techniques deployed, the end result of an analytic endeavor is to extract/generate information to provide a resource to enhance the decision-making process.
1. Spreadsheet applications (also facilitated by vendor software packages) a. Data/variable calculations, sorting, formatting, organizing b. Distribution analysis and statistics (max, min, average, median,
percentages, etc.)
c. Correlation calculation between variables d. Linear and goal programming (optimization)
e. Pivot tables (an intro to online analytic processing (OLAP) and business intelligence)
2. Business intelligence
a. Query and report creating b. Online analytic processing c. Dashboards
3. Multivariate analysis (also part of business intelligence) a. Regression (hypothesis approach)
b. Data mining applications (data-driven information creation) − Neural networks
− Clustering
− Segmentation classification − Real-time mining
4. Analysis of unstructured data a. Text mining
5. Six Sigma 6. Visualization
impact that metric. Once the scope of the analytic endeavor (problem defi-nition) has been established, then corresponding data resources must be managed (variables selected at a particular level of detail) and analysis can begin. The steps to conducting a problem definition for analytics will be addressed in detail in Chapter 5. The remainder of this chapter will pro-vide an overview of some of the analytic methods mentioned above.
INTRODUCTION TO THE CONCEPT OF ANALYTICS
One of the initial stages of any analytic endeavor is the incorporation of an investigative study of a data resource. In other words, before a report is generated or quantitative modeling is conducted, an analyst needs to better understand what’s in a data file. This investigative process involves conducting a distribution analysis of various data variables, perhaps cal-culating maximum, minimum, and variance metrics such as standard deviations. This provides a descriptive character of what the data variables are comprised of and renders additional analysis more robust, as it iden-tifies the presence of such issues as data bias or skew, outliers, and even errors in data resources.
BUSINESS INTELLIGENCE
Reports
adequate information for the decision maker). However, as simple as the process of generating a report may be, creating one that provides essential information to those that receive it may be a quite complex task.
Consider a request by an Internet marketing department to produce an analytic report that depicts the performance of various Internet market-ing tactics that drive traffic to a company’s landmarket-ing page. Although this initiative appears to be straightforward and simplistic in nature, one must consider all the variables that comprise the area to be analyzed, along with the needs of the user of the report.
Some dimensions and variables that could be included in this analysis would involve:
Time Performance Metric Marketing Source Source Traffic Location
Hour
Platforms such as Google Analytics provide robust functionality to accomplish extensive report generation in the e-commerce spectrum. When conducting customized analytics (tailored analytics to a specific company’s activities) data experts and analysts must apply due diligence to acquire that information that provides a strategic advantage in the marketplace. This involves the storage, processing, management, and ultimate analysis of data resources that describe a particular process.
Pivot Tables
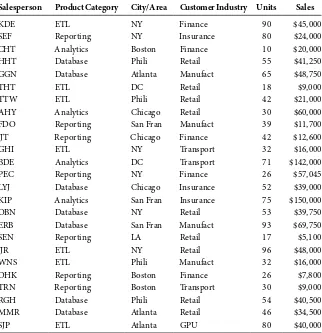
A simplistic version of OLAP that many users can quickly relate to includes the use of pivot tables in a spreadsheet environment. Pivot tables leverage data in a flat, spreadsheet file to present alternative scenarios that describe a business activity. Through basic spreadsheet functionality, users can quickly generate a table view of relevant variables at a particular level of aggregation. For example, a spreadsheet of data that describes a software company’s sales activities can include numerous rows according to cor-responding variables. Hypothetical data recording national sales activities of branches across the country is illustrated in Table 2.1.
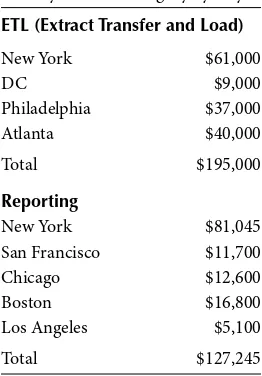
With a simple pivot function, Table 2.2 could be calculated with ease.
Dynamic Reporting through OLAP
Pivot tables are similar to OLAP in that they provide a multidimensional view of an activity. Enterprise OLAP provides greater scale to the ana-lytic process, as it provides the platform to address multiple levels of aggregation of data resources, can depict updated views as source data is updated, and can process extremely large volumes of data. With this flex-ibility OLAP can help decision makers investigate information addressing multiple descriptive scenarios regarding an operation’s activity, therefore
Annual E-Marketing Performance (Cost) Annual E-Marketing Performance (Conversions)
0 10 20 30 40 50
Banners Mobile Message
PPC 2013
2012
Banners Mobile Message Email
PPC
Tactic 2012 (cost) 2013 (cost) Change Tactic 2013 Conv PPC 30,000 44,000 46% PPC 22% Email 34,000 39,000 15% Email 20% Mobile 35,000 40,000 14% Mobile 42% Banner 30,000 34,000 13% Banner 16%
FIGURE 2.1
enhancing the knowledge generation process and overall ability to gen-erate effective strategic conclusions. The diversity of information views involves various dimensions of time, performance metrics, and descrip-tive variables.
General Cube Inputs
Time Descriptive Variables Performance Metrics
Daily Demographics Sales
Weekly Behavioral Response rate
Monthly Strategic Operational
Quarterly Process related Units
TABLE 2.1
Hypothetical Data Recording National Sales Activities
Salesperson Product Category City/Area Customer Industry Units Sales
KDE ETL NY Finance 90 $45,000
SEF Reporting NY Insurance 80 $24,000
CHT Analytics Boston Finance 10 $20,000
HHT Database Phili Retail 55 $41,250
GGN Database Atlanta Manufact 65 $48,750
THT ETL DC Retail 18 $9,000
TTW ETL Phili Retail 42 $21,000
AHY Analytics Chicago Retail 30 $60,000
FDO Reporting San Fran Manufact 39 $11,700
JJT Reporting Chicago Finance 42 $12,600
GHI ETL NY Transport 32 $16,000
BDE Analytics DC Transport 71 $142,000
PEC Reporting NY Finance 26 $57,045
LYJ Database Chicago Insurance 52 $39,000
KIP Analytics San Fran Insurance 75 $150,000
OBN Database NY Retail 53 $39,750
ERB Database San Fran Manufact 93 $69,750
SEN Reporting LA Retail 17 $5,100
JJR ETL NY Retail 96 $48,000
WNS ETL Phili Manufact 32 $16,000
DHK Reporting Boston Finance 26 $7,800
TRN Reporting Boston Transport 30 $9,000
RGH Database Phili Retail 54 $40,500
MMR Database Atlanta Retail 46 $34,500
These inputs must be organized to provide information (variables at lev-els of detail) that describes a business scenario in order to facilitate deci-sion support for the end user. Consider the graphical view of a cube in Figure 2.2.
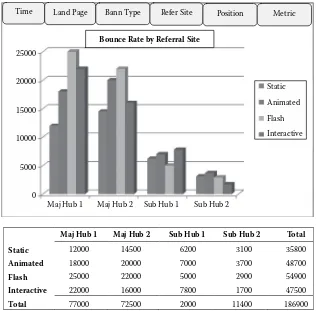
Figure 2.2 depicts an illustration of an OLAP cube that facilitates ana-lytics of banner Internet marketing tactics. The cube presents a multidi-mensional view of the variables that describe the activities involved in banner advertising. The platform gives the analyst the ability to query data variables from different levels of detail and in different combinations, through both numeric data and visualization. The tabs at the top of the graphic depict the variables that are available to be analyzed. The scenario depicted illustrates the bounce rate (number of bounces) according to dif-ferent types of referral sites where the various banner styles (static, ani-mated, flash, and interactive) are displayed.
Users have the ability to change variable views from different perspec-tives, including:
Time (hourly, daily, quarterly)
Landing page (social media, home, custom landing design) Banner type (static, animated, etc.)
Referral site (main hub, MSN, Yahoo; subhub, complementary site) Position (banner position, top, middle, bottom)
TABLE 2.2
Sales by Product Category by City
ETL (Extract Transfer and Load)
New York $61,000
DC $9,000
Philadelphia $37,000
Atlanta $40,000
Total $195,000
Reporting
New York $81,045
San Francisco $11,700
Chicago $12,600
Boston $16,800
Los Angeles $5,100
These perspectives can be analyzed according to predefined metrics, including bounce, views, click-throughs, and conversions. By navigating the different dimensions of the cube, the analyst can quickly identify strengths and weaknesses in different banner advertising initiatives. OLAP enhances the decision makers’ ability to more fully understand the attributes that comprise the activities of banner advertising.
So what about big data, you say? Remember, big data entails not only vol-ume of data but also the new variables (sources of data). Both these factors are considered when conducting analytics. In other words, a conceptual model must be generated that best describes the attributes of a desired process (entity to be better understood), and then data corresponding to those variables must be applied to that analytic framework. Big data adds complexity to the generation of the conceptual model as it introduces new
Maj Hub 1 Maj Hub 2 Sub Hub 1 Sub Hub 2
Maj Hub 1 25000
20000
15000
10000
5000
0
Maj Hub 2 Sub Hub 1 Sub Hub 2
Total
Static 12000 14500 6200 3100 35800
Animated 18000 20000 7000 3700 48700
Flash 25000 22000 5000 2900 54900
Interactive 22000 16000 7800 1700 47500
Total 77000 72500 2000 11400 186900
Time Land Page Bann Type Refer Site Position Metric
Bounce Rate by Referral Site
Static
Animated
Flash
Interactive
FIGURE 2.2
descriptive variables that may not have been available or incorporated in the traditional structure of the particular process. The value of big data fol-lows the basic concepts just mentioned; however, it can provide even greater value to the user by providing more robust models that provide greater descriptions and understanding of what affects process performance. In the banner ad scenario above, perhaps the new variable that must be added to provide more insightful information to decision makers regarding the effectiveness of their e-commerce advertising is the source of where traffic is coming from regarding the technological platform. In other words, is traf-fic coming from mobile devices, laptops, or tablets? When considering big volumes and velocities of data in an OLAP environment, methods such as parallel processing and map reduction of data resources must be considered. This topic will be addressed in greater detail in Chapter 3.
OLAP provides a robust source of business intelligence to decision makers, as it can leverage data resources including big data volumes and provides a platform that offers a flexible, accurate, and user-friendly mech-anism to quickly understand what has happened and what is happening to a business process. The multidimensional framework will give users the power to view multiple scenarios of a given process, such as the following:
• What is the bounce rate if I utilize a specific type of landing page? • Where are my highest conversion rates coming from?
• Is there seasonality according to day of the week or month of the year for my traffic?
The key to a valuable OLAP cube involves the combination of a few fac-tors. One of these relates to the concept mentioned earlier, namely, that a cube must effectively describe a business scenario. The conceptual model that is used to build the cube must include noteworthy variables (relevant) with an appropriate detailed format that give users true business intelli-gence. The next major factor is filling the cube with accurate, current, and consistent data. Deficiencies in either of these areas can quickly render the analytic method useless for decision making.
Analytics at a Glance through Dashboards
Often the level of analytics is filtered down to a few insightful reports, ongoing insights absorbed in the marketplace, and the access to real-time dashboards that display key performance indicators relevant to a particular process. These dashboards are designed to provide decision makers with a feedback mechanism as to how an organization is per-forming. The key elements of dashboards are the delineation of relevant key performance indicators (KPIs) to a particular process, timeliness of their readings (currency of information), and finally, a user-friendly visual that provides the decision maker with a clear way of determining whether a process is operating successfully or not. The more traditional visual platform resembles that of an odometer in an automobile, where color schemes of performance reflect that of traffic lights (e.g., green, all is well; yellow, caution; and red, something is wrong and needs to be inves-tigated). However, dashboard technology is quickly evolving where styles can include combinations of a variety of visuals (bar, line, pie charts) according to designated scales and are being utilized by decision makers at all levels in an organization.
The key to the effectiveness of a dashboard design involves its connection to the process at hand and use for decision making. Displays must be simple to understand and interpret. Just as a simple graphic display must adhere to design conventions (e.g., coherent color scheme, axis labeling, scale), so too must dashboard design, which adds complexity to the process as it com-bines various visual elements. The true key to a successful dashboard is evi-dent by its effectiveness in providing timely, easy-to-understand decision support of a corresponding process. Dashboards that are too busy (include too many visuals), that are difficult to interpret, can quickly become omit-ted from an analyst’s arsenal of decision support information.
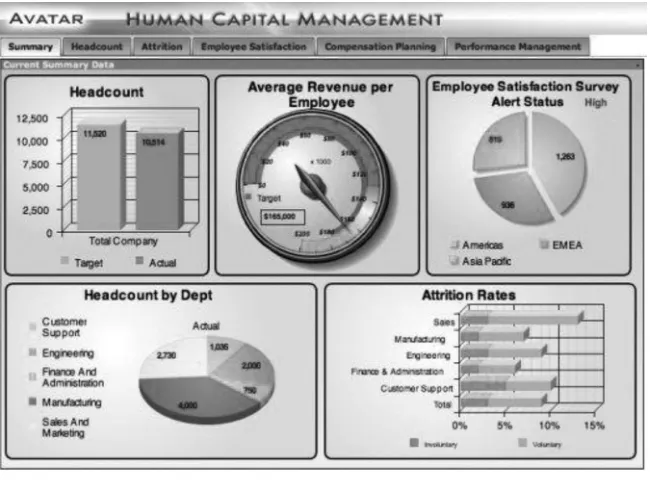
Consider the dashboard example in Figure 2.3. The various graphic dis-plays are clearly delineated from one another (separate sections) and are clearly labeled. Also, the design includes different visual displays, so the information presentation does not appear to overlap or include a blended view. Finally, complementary but distinctly different key performance indicators give the decision maker a well-rounded view of a human capital management application in this case.
Robust BI and Drill-Down behind Dashboard Views
capabilities through business intelligence applications can have OLAP cubes that can be quickly drilled into from a dashboard KPI that provides descriptive analytics of underlying variables that underpin the KPI. A prime example of an e-commerce-based KPI is the bounce rate on a land-ing page for an organization, especially when a new marketland-ing initiative has been launched. Perhaps an organization has initiated an Internet mar-keting campaign with banners listed on various complementary referral sites. A red signal indicating a higher than acceptable bounce rate would provide decision makers with a timely analytic alert mechanism to inves-tigate the source of the problem. A real-time cube or report could quickly depict which referral site may be the greatest source of misdirected traffic.
Not all dashboard displays need to be real time, where a simple refresh of data on an interim basis provides decision makers with an accurate indication of whether a process’s performance is adequate. However, the big data era involving high velocity of streaming data resources often requires a real-time dashboard visual of a given process to provide users with a quick view of variable impacts on KPIs.
FIGURE 2.3
DATA MINING AND THE VALUE OF DATA
As we’ve illustrated in the business intelligence section (e.g., reporting, OLAP, dashboards), a primary approach to generating value from data resources is to manage it into useful information assets (e.g., building con-ceptual models and viewing data according to level of details according to variables that describe a process). The next step in the valuation process is to generate a higher level of knowledge through the information created from data. Data mining involves the application of quantitative methods (equa-tions and algorithms), along with forms of statistical testing that process data resources, which can identify reliable patterns, trends, and associations among variables that describe a particular process. Techniques such as seg-mentation classification, neural networks, logistic regression, and clustering, to name a few, incorporate the use of algorithms and code or mathematical equations to extract actionable information from data resources. Chapter 4 provides detailed descriptions and applications of major mining methods.
Why Things Are Happening
Data mining can provide decision makers with two major sources of valu-able information. The first refers to descriptive information, or the iden-tification of why things may be occurring in a business process. This is done through the identification of recurring patterns between variables. Cross-sectional graphic displays can add significant information to deci-sion makers to illustrate patterns between variables. Figure 2.4 provides a simple graphical view that illustrates an ad spend vs. dollar revenue elas-ticity curve as identified in the mining process. The figure depicts that a recurring pattern exists between the two variables, and that a direct rela-tionship is prominent, where an increase in ad spend yields an increase in product revenue. Many non-mining-centric analysts would quickly raise the point that this information is not noteworthy, given the natural relationship between the two variables (e.g., the more spent on advertis-ing, the more sales that are generated); however, this criticism is quickly dispelled when posing the question: If ad spend is increased by 5% from $200,000, what is the expected increase in revenue? That question is dif-ficult to answer without the use of mining.
impacts of process components on performance metrics, and many more. Below are a few prominent applications where mining is often utilized:
• Consumer propensities
• Marketing and advertising effectiveness • E-commerce initiatives
• Fraud detection
• Worker and team performance • Pricing policies
• Process-related applications (throughput, workflow, traffic analysis) • Healthcare-related areas (outcomes measurement, treatment
effectiveness) • Risk assessment
What Is Likely to Happen
The other main source of information where mining provides value to decision makers is in the deployment of mining results. The patterns that have been identified are often embedded in an equation or algorithmic function, often referred to as the model, which can be used to perform a “what if” analysis or estimate future expected results based on inputs. In other words, if I market my product to a particular market segment defined by demographics, what is my expected response rate? Or, is a par-ticular activity (e.g., credit card use) likely to be fraudulent? If the analysis
$4,000,000
$3,500,000
$3,000,000
$2,500,000
$2,000,000
$1,500,000
$1,000,000
$500,000
$0
$80,000 $150,000 $220,000 $270,000 $300,000 $370,000 $440,000 $510,000
FIGURE 2.4
is based on a time series approach, mining models can provide forecasts for product sales. The analyst in this case needs to make assumptions as to future input values.
Real-Time Mining and Big Data
The evolution of the big data era has increased the utilization of the concept of real-time or streaming mining approaches. More traditional streaming mining involves the creation of models through analyzing a data sample or historical data of a given process. The resulting model then becomes a function that can be used to process streaming or real-time incoming data, and corresponding actionable outputs are generated in real time as well. Streaming mining addresses the big data concept of velocity and volume of data and is incorporated in processes where timely results are needed to improve strategies. Streaming mining applications are commonly applied in
• Website traffic analysis for real-time online marketing • Fraud detection for online transactions
• Financial market risk and trading
The real time and continuous analytic section described later in this chap-ter along with Chapchap-ters 8 and 9 provide more detailed descriptions and applications in this area.
Some big data sources (e.g., sensor and satellite producing entities) with extreme velocity and volume sometimes render the ability to extract a sample that represents the entire data source as difficult, to say the least. In these instances, the ability to create optimized quantitative models to process this streaming data is limited. Techniques such as multisampling (Rajaraman and Ullman, 2011) and the implementation of self-optimizing quantitative techniques that learn as data is encountered have evolved to address this issue.
Analysis of Unstructured Data and Combining Structured and Unstructured Sources
analytics of textual data (words, phrases, messages, emails, etc.). At a high level of description, text analytics seeks to create structure from unstruc-tured sources. It does this by processing various unstrucunstruc-tured forms and classifies them into particular categories. Processing is generally based in mathematics or linguistics.
In the realm of the vastly growing utilization of electronic communica-tion, which includes texting, tweeting, leaving content on social media, emailing, etc., one can quickly see the possible value that exists in deploy-ing analytic techniques to extract information that describes responses to marketing initiatives and product and service offerings, reactions to news and events, and general consumer behavior and sentiment.
An example involving the analysis of both structured and unstructured data for informative decision support is evident when examining patients’ electronic health records (EHR) to better understand treatment outcomes and patient diagnosis.
More structured physiological data (e.g., blood sugar levels) can be com-bined with unstructured data (e.g., physician comments on treatment) to better understand a patient’s status. Analytic techniques such as semantic mining can be applied in this situation to extract actionable information. The concept of mining unstructured data will be addressed in great detail in Chapters 4, 10, and 11.
SIX SIGMA ANALYTICS
Still many other analytic approaches exist outside the realm of BI appli-cations. More intensive user-generated analytics include Six Sigma-based initiatives. The core of Six Sigma is a philosophy and focus for reducing vari-ability in process operations. It involves process definition and the incorpo-ration of an array of statistical analytic methods to measure the performance of various attributes (Pande and Neuman, 2000). Classic Six Sigma is under-pinned by the DMAIC methodology, which is an acronym for the following:
Define: Process attributes and project objectives.
Measure: Identify relevant data variables and measure performance of the process.
Control: Establish metrics to measure performance for ongoing feed-back and take appropriate actions to address shortcomings of process.
The initial three steps to the methodology clearly depict classic analytics as they involve the definition of the problem objective and corresponding use of statistics and techniques to analyze the performance of the process. In the big data era, new sources of descriptive variables and volumes can enhance the application of Six Sigma across processes and industries. Consider the recent evolution of the healthcare industry that has involved an aggressive adoption of information technologies to underpin the vast processes that exist in a healthcare provider’s operations in treating patients.
Activity time stamps are commonplace for many processes in healthcare organizations that simply record when an activity of a subprocess begins and ends. This data is available at the patient level of detail. This seemingly trivial data element yields great significance in its facilitation of conducting analyt-ics. Consider the activity of a patient checking in to an emergency room.
The entire process of checking in to an ER to being diagnosed is com-prised of various subcomponents (Table 2.3). Variability or breakdowns in throughput in any of these subcomponents can adversely increase waiting times for patients, which can result in poor customer satisfaction ratings and the subpar outcome of the patient’s well-being. A DMAIC scenario is provided to illustrate the analytic initiative.
In the ER scenario provided, the process has been defined (e.g., track-ing the time to patient disposition from checktrack-ing in to an ER), and the [D]/define step for DMAIC has been addressed. The next step is to create data variables that describe the various subcomponents of the process and measure corresponding performance rates.
• Patient checks in to ER
• Patient is moved to triage, where nurse is assigned and patient is moved to bed
• Nurse collects patient information (medical history)
• Medical service exam (MSE) is performed by a physician and tests are ordered
• Test results are received and patient disposition (admitted to hospital or sent home) is conducted
measured. In this case, the healthcare service provider has a historic per-spective of measuring the process and has calculated the previous quarter’s average duration for all the subcomponents. The next step is to analyze cur-rent performance (average for curcur-rent month) to identify any significant changes to the baseline. Table 2.3 depicts a significant change (variance) in the duration of finishing the MSE to receiving lab results for patient disposition. Statistical techniques considering variance measurement are incorporated at the analytic stage to determine the level of significance, and therefore a need to implement the improve (I) stage. Here the analyst drills down into details of the process of ordering, conducting tests, and receiving results and communicating them back to the ER. At this stage, another, more detailed DMAIC study can be conducted to determine the factors that cause a high time duration from ordering to receiving test results to occur. Once this is accomplished, the decision maker can then formulate a strategic plan to address bottlenecks affecting the process (e.g., add radiology staff, adjust technology platform that communicates information in the test ordering process, implement an activity schedul-ing system). Once strategic initiatives have been implemented, the final step, control (C), follows to monitor effectiveness of the strategic endeavor and overall performance of the process (Kudyba and Radar, 2010).
The combination of available data (e.g., simple but voluminous sources of activity time stamps) in conjunction with a project and process defini-tion and analytics enhances efficiency and organizadefini-tional outcomes.
AN OFTEN OVERLOOKED SECTOR OF ANALYTICS
(POWER OF THE SIMPLE GRAPHIC)
Although many think of analytics as crunching numbers through an array of techniques and interpreting metrics to support decision making,
TABLE 2.3
Subcomponents of ER Throughput
Activity Time Duration % Change Alert
Check in at ER 2:00 a.m.
Move to Triage 2:20 a.m. 20 min. 5%
Information Collection 2:28 a.m. 8 min. 10%
MSE by Physician 2:42 a.m. 14 min. 12%
analytics are greatly enhanced by the incorporation of an often taken for granted application of visual displays. Just think of having to analyze tables and columns of pure numbers when reviewing analytic reports. The process can quickly become mundane and even painful. In the host of analytic applications we described above and for numerous additional ana-lytic methods, there is a common denominator to a successful endeavor, and that is the use of graphics to disseminate information. A simple view of a well-designed graphic can provide the decision maker with a clear presentation of extensive analytic results in a comprehendible manner.
In order to successfully leverage graphics, a few key points need to be considered. Before you become intrigued with robust colors and images that quickly draw you to generate dramatic conclusions about a particular process, take a step back and increase your understanding of what the information is actually portraying. In other words:
1. Analyze the titles and legends. 2. Take notice of the scale of the axis.
3. Understand the graphic/chart method used.
When you fully understand the variables that are depicted in the graphic, what the type of graphic focuses on, and the scale of the axis, only then can the analyst begin to generate effective interpretations. In the following sec-tion, a variety of graphical styles are listed with some simple descriptions of when they should be used. Keep in mind that when considering graph-ics in a big data era, the most significant elements are real-time graphgraph-ics that provide analysts with a streaming view of processes. The real-time streaming visualization of data actually becomes a dashboard that ana-lysts can monitor to observe variances in KPIs in relation to some event.
Graphic Types
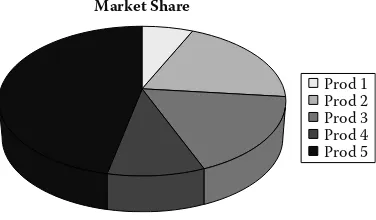
Figure 2.5 illustrates the classic pie chart that depicts how a whole unit is divided among some subcomponents (pieces of an established pie). Market share is a prime example for pie charts, where share can be delineated by product lines, regions, industry competitors, etc. Pie charts have limita-tions when considering negative values.
process (call centers in this case) in a time series setting (quarterly views). With a quick glance, the analyst can make inferences regarding relative performance (customer satisfaction) of three different call centers over time. Bar charts are more appropriate in depicting quantities or amounts of select variables.
Bar charts are also often used to illustrate variable distributions (per-centages of ranges or categories of a given variable). Figure 2.7 depicts a cat-egorical age variable and the amount of data that exists in selected ranges. This gives analysts a better understanding of the dimensions of a given data variable, and in this case enables them to determine if there is any age skew or bias (high percentage of one age range relative to the population).
Center 1 Center 2 Center 3
Qrt 4 Qrt 3
Qrt 2 Qrt 1
0 10 20 30 40 50 60
Customer Satisfaction Index
FIGURE 2.6
Bar chart (comparative view of multi-component process).
Market Share
P r o d 1 P r o d 2 P r o d 3 P r o d 4 P r o d 5
FIGURE 2.5
In conducting market research, a variable distribution view enables the researcher to determine if a target market is included in a data resource.
Variable distribution analysis can often include visuals via line graphs that are useful in illustrating scenarios involving continuous variables. Figure 2.8 illustrates the continuous data variable of mall foot traffic for a given day according to retailers.
Time series line charts provide users with a visual of potential sea-sonality in processes. Figure 2.9 depicts the classic holiday effect in retail as is seen in the repetitive bump in sales in Q4.
35
30
25
20
15
10
5
0
18–22 23–27 28–33 34–39 40–46 47–55
Column Chart Distribution
FIGURE 2.7
Age distribution chart.
35
30
25
20
% Data 15
10
5
0
20,000 43,000 89,000 115,000 170,000
FIGURE 2.8
Another type of chart involves the scatter plot that is commonly used to illustrate correlations between variables, where simple plots of individual data points are depicted. Figure 2.10 depicts data points depicting correla-tions between employee performance and training received.
A rather insightful chart style is the bubble chart. The bubble graphic enables analysts to depict three-dimensional scenarios in a coherent fashion by incorporating bubble size to illustrate variable attributes. Figure 2.11 depicts the multi-dimensional scenario of organizational team performance according to workload and team size.
50
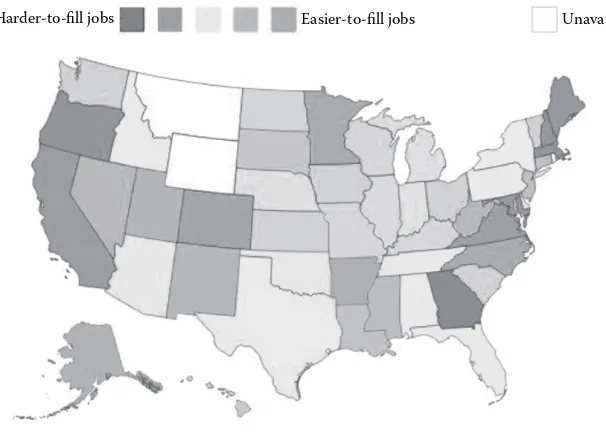
Yet another graphic style that has increased in importance over the evo-lution of the big data era is the use of maps. Map visuals are generally uti-lized when an analysis involving location is emphasized; however, location can also refer to a process location. Applications such as traffic analysis or population analytics are common examples. Traffic can refer to website activities, vehicular, consumer, or some type of designated activity. See Chapter 7 for more on heat maps for the web.
In a simple web traffic visual, a map can illustrate cross sections of time and area of a web page that are receiving high user traffic. This can provide strategists with actionable information to more effectively apply online marketing tactics (e.g., display banners in hot spots on a particular page at a particular time).
Civil engineering can leverage heat maps by incorporating GPS data to investigate hot areas of traffic incidents (congestion, accidents) and opti-mize new designs to alleviate existing trouble areas and in designing new roadways.
Figure 2.12 provides a standard heat map where “hot colors” depict more intense activity. In this case, the hotter areas depict areas where job vacancies are difficult to fill.
Map visuals are particularly applicable in the big data era, when real-time, high-velocity analytics and voluminous sources are involved. Applications that leverage big data include geovisualization that involves the analysis of geographic specific flows of data and bioinformatics and sensor output in the healthcare spectrum. For example, the healthcare industry is increasingly
98