Dr. Arvind Sathi
First Edition
First Printing — October 2012
© 2012 IBM Corporation. All rights reserved.
Every attempt has been made to provide correct information. However, the publisher and the author do not guarantee the accuracy of the book and do not assume responsibility for information included in or omitted from it.
The following terms are trademarks or registered trademarks of International Business Machines Corporation in the United States, other countries, or both: IBM, Big Insights, Cognos, DB2, Entity Analytics, InfoSphere, Netezza, NPS, Optim, pureScale, SlamTracker, Smarter Cities, SPSS, Streams, Unica, Vivisimo, and z/OS. TEALEAF is a registered trademark of Tealeaf, an IBM Company. WORKLIGHT is trademark of Worklight, an IBM Company. A current list of IBM trademarks is available on the Web at www.ibm.com/legal/us/en/ copytrade.shtml.
Adobe is a registered trademark of Adobe Systems Incorporated in the United States and/or other countries. Linux is a registered trademark of Linus Torvalds in the United States, other countries, or both. Microsoft and Windows are trade-marks of Microsoft Corporation in the United States, other countries, or both. Java and all Java-based trademarks and logos are trademarks or registered trademarks
of Oracle and/or its affiliates. Other company, product, or service names may be
trademarks or service marks of others.
Printed in Canada. All rights reserved. This publication is protected by copyright, and permission must be obtained from the publisher prior to any prohibited reproduction, storage in a retrieval system, or transmission in any form or by any means, electronic, mechanical, photocopying, recording, or likewise.
MC Press offers excellent discounts on this book when ordered in quantity for bulk purchases or special sales.
MC Press Online, LLC, 3695 W Quail Heights Court, Boise, ID 83703-3861 USA
Customer Service: Toll Free: (877) 226-5394; [email protected]
Permissions and Special/Bulk Orders: [email protected]
In memory of Professor Herbert Simon, who sparked my curiosity in qualitative reasoning
To Neena, Kinji, Kevin, and Conal
About the Author
Dr. Arvind Sathi is the World Wide Communication Sector architect for the Information Agenda team at IBM®. Dr. Sathi received his Ph.D. in Business
Administration from Carnegie Mellon University and worked under Nobel Prize winner Dr. Herbert A. Simon. Dr. Sathi is a seasoned professional with more than 20 years of leadership in Information Management architecture and delivery. His primary focus has been in creating visions and roadmaps for Advanced Analytics at leading IBM clients in telecommunications, media and entertainment, and energy and utilities organizations worldwide. He has conducted a number of workshops on Big Data assessment and roadmap development.
Prior to joining IBM, Dr. Sathi was the pioneer in developing knowledge-based solutions for CRM at Carnegie Group. At BearingPoint, he led the development of Enterprise Integration, MDM, and Operations Support Systems/ Business Support Systems (OSS/BSS) solutions for the communications market
and also developed horizontal solutions for communications, financial services,
and public services. At IBM, Dr. Sathi has led several Information Manage-ment programs in MDM, data security, business intelligence, and related areas and has provided architecture oversight to IBM’s strategic accounts. He has also delivered a number of workshops and presentations at industry conferences on technical subjects including MDM and data architecture, and he holds two
Acknowledgements
First and foremost, I would like to acknowledge the hard work from the Infor-mation Agenda community in creating a world-class reference material. I have heavily referenced the material here, including the Business Maturity Model, the Solution Architecture framework, and a number of case studies. I would like to acknowledge Bob Keseley, Wayne Jensen, and Mick Fullwood for conceiving the ideas and organizing the reference material. I would like to acknowledge Tim
Davis for his encouragement and for providing financial services examples. Jeff
Jonas provided me with inspiration for experimenting with the ideas and provid-ed me with much of the backbone for this book. The technical ideas were creatprovid-ed with help from Beth Brownhill, Paul Christensen, Elizabeth Dial, Ram Dorairaj, Tommy Eunice, Rich Harken, Eberhard Hechler, Bob Johnston, Noman Moham-med, Peter Harrison, Daryl BC Peh, Steve Rigo, and Barry Rosen. The Dallas Global Solutions Center team—Christian Loza, Tom Slade, Mathews Thomas, and Janki Vora—provided valuable experimentations on the ideas. Mehul Shah, Emeline Tjan, Livio Ventura, Wolfgang Bosch, Steve Trigg, Don Bahash, and Jessica White have provided valuable business value analysis components in this book. I would also like to thank the Communication Sector Industry Consulting team—Ken Kralick, Dirk Michelsen, Tushar Mehta, Richard Lanahan, Rick Flamand, Linda Moss, and David Buck—for providing the opportunities, customers, and contributions to the Big Data Analytics solutions.
Next, I would like to acknowledge the excellent work from the IBM Business Analytics and Optimization consulting team. In particular, Adam Gersting, Joseph Baird, Anu Jain, Bruce Weiss, Aparna Betigeri, and John Held provided the ideas behind the business scenarios and use cases through their consulting activities. I would also like to thank Mark Holste for collaborations and brain-storms on these solutions.
The IBM Software Group product teams provided the much-needed case studies and product examples. I would like to thank Roger Rea, Dan Debrun-ner, and Vibhor Kumar for their help on the InfoSphere® Streams® product; Arun
Manoharan and Patrick Welsh for their support in getting Vivisimo® information;
Andrew Colby for help on the Netezza™ Analytics Engine; Shankar Venkatara-man, Girish Venkatachaliah, and Karthik Hariharan for Big Insights®; Claudio
Zancani for Optim™ Privacy; and Mike Zucker for SPSS®.
Bhatnagar, Jay Praturi, Jessica Shah, Jim Hicks, Joshua Koran, Judith List, Kedrick Brown, Ken Babb, Lindsey Pardun, Mahesh Dalvi, Maureen Little, Neil Isford, Norbert Herman, Oliver Birch, Perry McDonald, Philip Smolin, Piyush Sarwal, Ravi Kothari, Randy George, Raquel Katigbak, Richa Pandey, Rob Smith, Robert Segat, Sam King, Sankar Virdhagriswaran, Sara Philpott, Steve Cohen, Steve Teitzel, Sumit Chowdhury, Sumit Singh, Teresa Jacobs, Umadevi Reddy, Vasco Queiros, Vikas Pathuri, Von McConnell and Yoel Arditi. I am grateful for the insightful discussions and implementations in understanding business opportunities as well as current Big Data practices.
I would like to thank Cheryl Daugherty for her review of the book and Sunil Soares for inspiring me to write the book. Gaurav Deshpande did a fair amount of work behind the scenes to help me organize and fund the book. It was also Gaurav’s inspiration to introduce the cartoon strip, which was eventu-ally co-authored between the two of us. Susan Visser provided valuable help organizing the publication process. Katie Tipton provided valuable publication and editorial guidance.
Foreword
by Bob Keseley
We are seeing an unprecedented interest in Big Data Analytics around the globe. Top performers have declared themselves “Analytics driven” organiza-tions. Savvy business and IT leaders are starting to leverage Big Data Analytics to drive substantial enhancements in their business models, partnerships, and business processes. While almost everyone is talking about Big Data at the tool or product level, successful organizations are focused on Big Data use cases and techniques that drive the greatest business value. They are focused on the “business” of Big Data Analytics. Arvind has taken the same perspective in
Big Data Analytics: Disruptive Technologies for Changing the Game. Over the past three years, our Information Agenda team has worked extensively helping organizations shape their Big Data Analytics strategies and solutions. Starting with the business is fundamental to the success of any organization. I am pleased to see a book starting with the business as the primary focus and exploring best practices across sales, marketing, customer service, and risk management, before linking them to the solutions and architec-tures that make it all possible. We hope you enjoy this book about evolving best practices and their impact on the competitive landscape. May it facilitate the right dialogue between your business and IT leaders.
Foreword
by Jeff Jonas
This book covers a number of Big Data use cases, architecture considerations, and the rise of emerging observation spaces (social, geospatial, etc.) and covers some of the thorny issues around data privacy. An organization’s available obser-vation space (data they can get their hands on within law and policy) is growing faster than their ability to make sense of it. As organizations struggle to keep up, they are being forced to reconsider what kind of infrastructure will be required to harness Big Data.
Going forward, organizations must be able to sense and respond to
trans-actions happening now and must be able to deeply reflect over what has been observed—this deep reflection is a necessary activity to discover relevant weak
signal and emerging patterns. Following fairly recent experiments involving how humans piece jigsaw puzzles together, I have witnessed the criticality of tightly
coupling discovery from deep reflection right back into the real-time sense and respond analytics. In fact, as the feedback loop gets faster and tighter, it signifi -cantly enhances the discovery.
The organizations that figure out how to make sense of what they learn fast
enough to do something about it while it is happening will be more competitive.
Contents
Foreword by Bob Keseley...ix
Foreword by Jeff Jonas ...xi
Chapter 1: Introduction ... 1
1.1 Volume ... 3
1.2 Velocity ... 3
1.3 Variety ... 3
1.4 Veracity ... 4
Chapter 2: Drivers for Big Data? ... 7
2.1 Sophisticated Consumers ... 7
2.2 Automation ... 11
2.3 Monetization ... 12
Chapter 3: Big Data Analytics Applications ... 15
3.1 Social Media Command Center ... 15
3.2 Product Knowledge Hub ... 16
3.3 Infrastructure and Operations Studies ... 18
3.4 Product Selection, Design and Engineering ... 19
3.5 Location-Based Services ... 22
3.6 Micro-Segmentation and Next Best Action ... 24
3.7 Online Advertising ... 27
3.8 Improved Risk Management ... 29
Chapter 4: Architecture Components ... 31
4.1 Massively Parallel Processing (MPP) Platforms ... 31
4.2 Unstructured Data Analytics and Reporting ... 34
Qualitative Comparisons ... 37
Focus on Specific Time Slice or Using Other Dimensions ... 38
4.3 Big Data and Single View of Customer/Product ... 39
4.4 Data Privacy Protection ... 43
4.5 Real-Time Adaptive Analytics and Decision Engines ... 46
Chapter 5: Advanced Analytics Platform ... 51
5.1 Real-Time Architecture for Conversations ... 52
5.2 Orchestration and Synthesis Using Analytics Engines ... 54
Entity Resolution ... 57
Model Management ... 57
Command Center ... 57
Analytics Engine ... 57
5.3 Discovery Using Data at Rest ... 58
5.4 Integration Strategies ... 59
Chapter 6: Implementation of Big Data Analytics ... 61
6.1 Revolutionary, Evolutionary, or Hybrid ... 61
6.2 Big Data Governance ... 63
Integrating Big Data with MDM ... 63
6.3 Journey, Milestones, and Maturity Levels ... 66
Analytics Business Maturity Model ... 68
Chapter 7: Closing Thoughts ... 71
Notes ... 75
Big Data Analytics:
Chapter 1
Introduction
B
ig Data Analytics is a popular topic. While everyone has heard stories of new Silicon Valley valuation bubbles and critical shortages of data scientists, there are an equal number of concerns: Will it take away my current investment in Business Intelligence or replace my organization? How do I integrate my Data Warehouse and Business Intelligence with Big Data? How do I get started, so I can show some results? What are the skills required? What happens to data governance? How do we deal with data privacy?Over the past 9 to 12 months, I have conducted many workshops with
practi-tioners in this field. I am always fascinated with the two views that so often clash
in the same room—the bright-eyed explorers ready to share their data and the worriers identifying ways this can lead to trouble. A similar divide exists among
consumers. As in any new field, implementation of Big Data requires a delicate
balance between the two views and a robust architecture that can accommodate divergent concerns.
Unlike many other Big Data Analytics blogs and books that cover the basics and technological underpinnings, this book takes a practitioner’s viewpoint. It
identifies the use cases for Big Data Analytics, its engineering components, and
So, what is Big Data? There are two common sources of data grouped under the banner of Big Data. First, we have a fair amount of data within the corpora-tion that, thanks to automacorpora-tion and access, is increasingly shared. This includes emails, mainframe logs, blogs, Adobe PDF documents, business process events, and any other structured, unstructured, or semi-structured data available inside the organization. Second, we are seeing a lot more data outside the organization— some available publicly free of cost, some based on paid subscription, and the rest
available selectively for specific business partners or customers. This includes
information available on social media sites, product literature freely distributed by competitors, corporate customers’ organization hierarchies, helpful hints available from third parties, and customer complaints posted on regulatory sites.
Many organizations are trying to incentivize customers to create new data. For example, Foursquare (www.foursquare.com) encourages me to document my visits to a set of businesses advertised through Foursquare. It provides me with points for each visit and rewards me with the “Mayor” title if I am the most
frequent visitor to a specific business location. For example, every time I visit
Tokyo Joe’s—my favorite nearby sushi place—I let Foursquare know about my visit and collect award points. Presumably, Foursquare, Tokyo Joe’s, and all the competing sushi restaurants can use this information to attract my attention at the next meal opportunity.
Sunil Soares has identified five types of Big Data: web and social media,
machine-to-machine (M2M), big transaction data, biometrics, and human gener-ated.1 Here are some examples of Big Data that I will use in this book:
• Social media text
• Cell phone locations
• Channel click information from set-top box
• Web browsing and search
• Product manuals
• Communications network events
• Call detail records (CDRs)
• Radio Frequency Identification (RFID) tags
• Maps
• Traffic patterns • Weather data
• Mainframe logs
Chapter 1: Introduction • 3
and Veracity. Some analysts have added other V’s to this list, but for the purpose of this book, I will focus on the four V’s described here.
1.1 Volume
Most organizations were already struggling with the increasing size of their databases as the Big Data tsunami hit the data stores. According to Fortune
magazine, we created 5 exabytes of digital data in recorded time until 2003. In 2011, the same amount of data was created in two days. By 2013, that time period is expected to shrink to just 10 minutes.2
A decade ago, organizations typically counted their data storage for analytics infrastructure in terabytes. They have now graduated to applications requiring storage in petabytes. This data is straining the analytics infrastructure in a number of industries. For a communications service provider (CSP) with 100 million customers, the daily location data could amount to about 50 terabytes, which, if stored for 100 days, would occupy about 5 petabytes. In my discussions with one cable company, I learned that they discard most of their network data at the end of the day because they lack the capacity to store it. However, regulators have asked most CSPs and cable operators to store call detail records and associated usage data. For a 100-million-subscriber CSP, the CDRs could easily exceed 5 billion records a day. As of 2010, AT&T had 193 trillion CDRs in its database.3
1.2 Velocity
There are two aspects to velocity, one representing the throughput of data and the other representing latency. Let us start with throughput, which represents the data moving in the pipes. The amount of global mobile data is growing at a 78 percent compounded growth rate and is expected to reach 10.8 exabytes per month in 20164 as consumers share more pictures and videos. To analyze this data, the
corporate analytics infrastructure is seeking bigger pipes and massively parallel processing.
Latency is the other measure of velocity. Analytics used to be a “store and report” environment where reporting typically contained data as of yester-day—popularly represented as “D-1.” Now, the analytics is increasingly being embedded in business processes using data-in-motion with reduced latency. For example, Turn (www.turn.com) is conducting its analytics in 10 milliseconds to place advertisements in online advertising platforms.5
1.3 Variety
The data was compiled from a variety of sources and transformed using ETL (Extract, Transform, Load) or ELT (Extract the data and Load it in the warehouse, then Transform it inside the warehouse). The basic premise was narrow variety
and structured content. Big Data has significantly expanded our horizons, enabled
by new data integration and analytics technologies. A number of call center analytics solutions are seeking analysis of call center conversations and their correlation with emails, trouble tickets, and social media blogs. The source data includes unstructured text, sound, and video in addition to structured data. A number of applications are gathering data from emails, documents, or blogs. For example, Slice provides order analytics for online orders (see www.slice.com for details). Its raw data comes from parsing emails and looking for information from a variety of organizations—airline tickets, online bookstore purchases, music download receipts, city parking tickets, or anything you can purchase and pay for that hits your email. How do we normalize this information into a product catalog and analyze purchases?
Another example of enabling technology is IBM’s InfoSphere Streams platform, which has dealt with a variety of sources for real-time analytics and decision making, including medical instruments for neonatal analysis, seismic
data, CDRs, network events, RFID tags, traffic patterns, weather data, mainframe
logs, voice in many languages, and video.
1.4 Veracity
Unlike carefully governed internal data, most Big Data comes from sources
outside our control and therefore suffers from significant correctness or accuracy
problems. Veracity represents both the credibility of the data source as well as the suitability of the data for the target audience.
Let us start with source credibility. If an organization were to collect product information from third parties and offer it to their contact center employees to support customer queries, the data would have to be screened for source accur-acy and credibility. Otherwise, the contact centers could end up recommending competitive offers that might marginalize offerings and reduce revenue opportun-ities. A lot of social media responses to campaigns could be coming from a small number of disgruntled past employees or persons employed by competition to post negative comments. For example, we assume that “like” on a product
signi-fies satisfied customers. What if the “like” was placed by a third party?6
We must also think about audience suitability and how much truth can be
Chapter 1: Introduction • 5
data may not be available for wider communication. For example, if customer service has provided inputs to engineering on product shortcomings as seen at the customer touch points, this data should be shared selectively, on a need-to-know basis. Other data may be shared only with customers who have valid contracts or other prerequisites.
Over the past year, the Information Agenda team has been asked to conduct a number of Big Data Analytics workshops. The three most common questions have been as follows:
1. What is Big Data and what are others doing with it?
2. How do we build a strategic plan for Big Data Analytics in response to a management request?
3. How does Big Data change our analytics organization and architecture?
Most of the material included in this book was collated in response to answering these questions.
This book provides three perspectives on Big Data Analytics.
First, why is Big Data Analytics becoming so important, and what can we do with it? The book projects major trends behind the rise of Big Data and shows typical use cases tackled by Big Data Analytics, where leading organizations are
already seeing major benefits.
Second, the book lists major components of Big Data Analytics and introduces an integrated architecture—Advanced Analytics Platform (AAP)— that combines Big Data Analytics with the rest of the analytics infrastructures and integrates with business processes. It shows how these components work together in the AAP to provide an integrated engine that can combine Big Data with traditional Data Warehouse and Business Intelligence to provide an overall solution.
Third, the book provides a glimpse at implementation concerns and how they must be tackled. How do we establish a roadmap and implement key pilot programs to gather momentum and persist to create a game-changing vision? How do we provide governance across this data when the originating data may have varying quality or privacy constraints?
unknown consequences. However, I have outlined a number of critical areas to probe further, as well as a number of required components, irrespective of the position taken.
I have relied heavily on my personal work for illustrations of the concepts discussed in this book. As a result, most of the examples are tilted towards CSPs, advertising, and retail industries. This is not to say that these industries are leading the pack or that other industries do not have good Big Data
oppor-tunities. To the contrary, we are finding a large number of examples across
Chapter 2
Drivers for Big Data?
W
e are increasing the pace for Big Data creation. This chapter examines the forces behind this tsunami of Big Data. There are three contributing factors: consumers, automation, and monetization. More than each of these contributing factors, their interaction is speeding the creation of Big Data. With increasing automation, it is easier to offer Big Data creation and consumption opportunities to the consumers and the monetization process is increasinglyproviding an efficient marketplace for Big Data.
2.1 Sophisticated Consumers
The increase in information level and the associated tools has created a new breed of sophisticated consumers. These consumers are far more analytic, far savvier at using statistics, and far more connected, using social media to rapidly collect and collate opinion from others. We live in a world full of market-ing messages. While most of the marketmarket-ing is still broadcast usmarket-ing newspaper, magazine, network TV, radio, and display advertising, even in the conventional media, narrow casting is gradually becoming more prominent. This is seen in local advertisement insertions in magazines, insertion of narrow cast commer-cials using set-top boxes, and use of commuter information to change street display ads. The Internet world can become highly personalized. Search engines,
social network sites, and electronic yellow pages insert advertisements specific
to an individual or to a micro-segment. Internet cookies are increasingly used to track user behavior and to tailor content based on this behavior.
expectations, and disappointments with small and large social groups. Unlike email and text, the conversations are on the Web for others to read, either now or later.
So far, we have been dealing only with single forms of communication. The next sets of sources combine information from more than one media. For example, Facebook conversations involve a number of media, including text, sound clips, photos, and video. Second world and alternate reality are becom-ing interestbecom-ing avenues for trybecom-ing out product ideas in a simulated world where product usage can be experimented with.
We often need experts to help us sort out product features and how they relate to our product usage. A large variety of experts are available today to help us with usage, quality, pricing, and value-related information about products. A number of marketers are encouraging advisor or ambassador programs using social media sites. These selected customers get a preview of new products and actively participate in evaluating and promoting new products. At the end of the day, people we know and trust sway our decisions. This is the biggest contribu-tion of social networks. They have brought consumers together such that sharing customer experiences is now far more frequent than ever before.
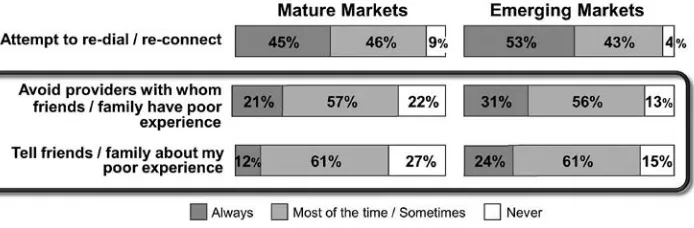
How would a consumer deal with a poor service quality experience? Figure 2.1 shows typical behaviors in mature and emerging markets as studied by an IBM Global Telecom Consumer Survey conducted with a sample size of 10,177.7
In this survey, 78 percent of the consumers surveyed in the mature markets said they avoid providers with whom friends or family had bad experience. The percentage was even higher (87 percent) in growth markets. In response to a
Source: 2011 IBM Global Telecom Consumer Survey, Global N = 10177; Mature Countries N = 7875
Chapter 2: Drivers for Big Data? • 9
related question, survey participants said that they inform friends and family about poor experience (73 percent in mature markets and 85 percent in growth
markets). These numbers together show a strong influence of social network on purchase behavior. These are highly significant percentages and are now
increasingly augmented by social media sites (e.g., the “Like” button placed on Facebook). The same survey also found that the three most preferred sources for recommendation information are Internet, recommendations from family/friends, and social media.
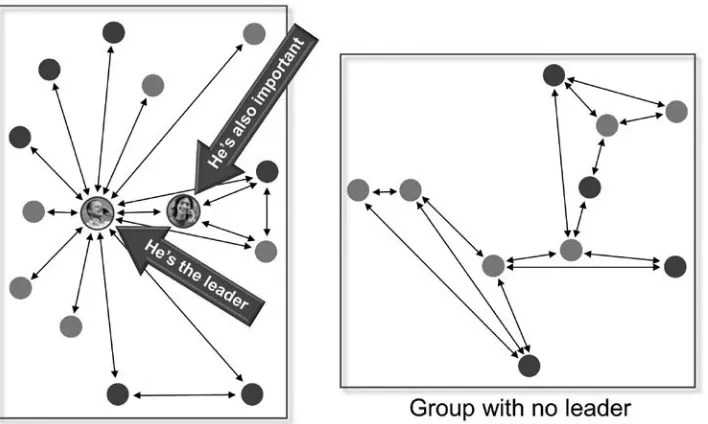
In any group, there are leaders. These are the people who lead a change from one brand to another. Leaders typically have a set of followers. Once a leader switches a brand, it increases the likelihood for the social group members to churn as well. Who are these leaders? Can we identify them? How can we direct our marketing to these leaders?
In any communication, the leaders are always the center of the hub (see Figure 2.2). They are often connected to a larger number of “followers,” some of
whom could also be leaders. In the figure, the leaders have a lot more communi -cation arrows either originating or terminating to them compared with others.
How do we identify the leaders? IBM Research conducted a series of experiments with CSPs.8 Call detail records, which carry information about
person A calling person B, were analyzed. By synthesizing call information and abstracting communications networks, we discovered webs of communications across individuals. We also used the customer churn information to correlate churn among leaders to subsequent churn among followers. Here are some of the highlights from one of the experiments I helped conduct:
• Leaders were 1.2 times more likely to churn compared with non-leaders.
• There were two types of leaders: disseminating leaders who were connected to their group through outgoing calls, and authority leaders who were connected through a larger proportion of incoming calls.
• When a disseminating leader churned, additional churns were 28.5 times more likely. When an authority leader churned, additional churns were 19.9 times more likely.
• Typically, there was a very limited time between leaders’ churn and the followers’ churn.
Social groups can be inferred from any type of communication—emails, SMS texts, calls, Facebook friendships, and so on. It is interesting to see strong
statistics associated with leaders’ influence on the group.
There are many ways to utilize social networks to influence purchase and
reuse:
• Studying consumer experience—A fair amount of this data is unstruc-tured. By analyzing the text for sentiments, intensity, readership, related blogs, referrals, and other information, we can organize the data into
positive and negative influences and their impact on the customer base.
• Organizing customer experience—We can provide reviews to a prospective buyer, so they can gauge how others evaluated the product.
• Influencing social networks—We can provide marketing material, product changes, company directions, and celebrity endorsements to
social networks, so that social media may influence and enhance the
buzz.
• Feedback to products, operations, or marketing—By using information generated by social media, we can rapidly make changes in the product mix and marketing to improve the offering to customers.
Chapter 2: Drivers for Big Data? • 11
instant access to this action. If I consider a restaurant worth its money, Yelp can help me broadcast that fact worldwide. If I hate the new cell phone service from a CSP, I can blog to complain about it to everyone.
2.2 Automation
Interactive Voice Response (IVR), kiosks, mobile devices, email, chat, corpor-ate Websites, third-party applications, and social networks have genercorpor-ated a fair amount of event information about the customers. In addition, customer interactions via traditional media such as call centers can now be analyzed and organized. The biggest change is in our ability to modify the customer experience using software policies, procedures, and personalization, making self-service increasingly customer friendly.
Sales and marketing have received their biggest boost in instrumentation from Internet-driven automation over the past 10 years. Browsing, shopping, ordering, and customer service on the Web not only has provided tremendous
control to users but also has created an enormous flood of information to the
marketing, product, and sales organization in understanding buyer behavior. Each sequence of Web clicks can be collected, collated, and analyzed for customer delight, puzzlement, dysphoria, or outright defection. More informa- tion can also be obtained about sequence leading up to a decision.
Self-service has crept in through a variety of means: IVRs, kiosks, handheld devices, and many others. Each of these electronic means of communication acts like a gigantic pool of time-and-motion studies. We have data available on how many steps customers took, how many products they compared, and what attributes they focused on, such as price, features, brand comparisons, recom-mendations, defects, and so on. Suppliers have gained enormous amounts of data from self-service and electronic sensors connected to products. If I use a two-way set-top box to watch television, the supplier has instant access to my
channel-surfing behavior. Did I change the channel when an advertisement started? Did
What are the sources of data from such self-service interactions?
• Product—As products become increasingly electronic, they provide a lot of valuable data to the supplier regarding product use and product quality. In many cases, suppliers can also collect information about the context in which a product was used. Products can also supply information related to frequency of use, interruptions, usage skipping, and other related aspects.
• Electronic touch points—A fair amount of data can be collected from the touch points used for product shopping, purchase, use, or payment. IVR tree traversals can be logged, Web click streams can be collected, and so on.
• Components—Sometimes, components may provide additional information. This information could include data about component failures, use, or lack thereof. For example, a wireless CSP can collect data from networks, cell towers, third parties, and handheld devices to understand how all the components together provided a good or bad service to the customer.
2.3 Monetization
From a Big Data Analytics perspective, a “data bazaar” is the biggest enabler to create an external marketplace, where we collect, exchange, and sell customer information. We are seeing a new trend in the marketplace, in which customer experience from one industry is anonymized, packaged, and sold to other indus-tries. Fortunately for us, Internet advertising came to our rescue in providing an incentive to customers through free services and across-the-board opt-ins.
Internet advertising is a remarkably complex field. With over $26 billion
in 2010 revenue,9 the industry is feeding a fair amount of startup and initial
public offering (IPO) activity. What is interesting is that this advertising money is enhancing customer experience. Take the case of Yelp, which lets consumers share their experiences regarding restaurants, shopping, nightlife, beauty spas, active life, coffee and tea, and others.10 Yelp obtains its revenues through
adver-tising on its website; however, most of the traffic is from people who access Yelp to read customer experience posted by others. With all this traffic coming
Chapter 2: Drivers for Big Data? • 13
Big Data Analytics is creating a new market, where customer data from one industry can be collected, categorized, anonymized, and repackaged for sale to others:
• Location—As we discussed earlier, location is increasingly available to suppliers. Assuming a product is consumed in conjunction with a mobile device, the location of the consumer becomes an important piece of information that may be available to the supplier.
• Cookies—Web browsers carry enormous information using web cookies. Some of this may be directly associated with touch points.
• Usage data—A number of data providers have started to collect, synthesize, categorize, and package information for reuse. This includes credit-rating agencies that rate consumers, social networks with blogs published or “Like” clicked, and cable companies with audience information. Some of this data may be available only in summary form or anonymized for the protection of customer privacy.
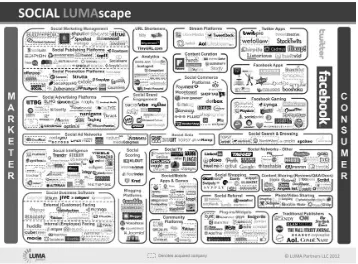
Terence Kawaja has been studying this market for a number of years and has characterized a number of markets and associated players. “Terence Kawaja has a new way for potential investors to visualize it,” says Wall Street Journal writer Amir Efrati. “The market involves hundreds of small and large companies that help advertisers reach consumers and help website publishers, mobile-applica-tion developers, search engines, and other digital destinamobile-applica-tions generate revenue
through advertising. Kawaja, who runs the investment firm LUMA Partners,
spent months putting together six new graphics that show how 1,240 different
companies fit into the following categories of online advertising: display, video,
search engines, mobile, social, and commerce.”11 I have replicated Kawaja’s
Chapter 3
Big Data Analytics Applications
T
his chapter discusses a number of important use cases for Big Data Analytics. In each case, Big Data Analytics is becoming integrated with business processes and traditional analytics to provide major outcomes. In many cases, these use cases represent game changers essential to the survival and growth of an organization in an increasingly competitive marketplace. Some of these use cases are still in their infancy, while others are becoming increasingly commonplace.3.1 Social Media Command Center
Last year, Blackberry faced a serious outage when its email servers were down for more than a day. I tried powering my Blackberry off and on because I wasn’t sure whether it was my device or the CSP. It never occurred to me that the outage could be at the Blackberry server itself. When I called the CSP, they were not aware of the problem. For a while, I was okay without receiving any emails, but then I started to become curious. So I turned to one obvious source: Twitter. Sure enough, I found information about the Blackberry outage on Twitter.
One of my clients told me that his VP of Customer Service is glued to Twitter looking for customer service problems. Often, someone discovers the problem on Twitter before the internal monitoring organization. We found that a large number of junior staffers employed by marketing, customer service, and public relations search through social media for relevant information. Does this sound like an automation opportunity?
A Social Media Command Center combines automated search and display of consumer feedback expressed publicly on the social media. Often, the feedback is summarized in the form of “positive” or “negative” sentiment. Once the feedback
conversation with the affected consumers, whether to respond to questions about an outage or obtain feedback about a new product offering.
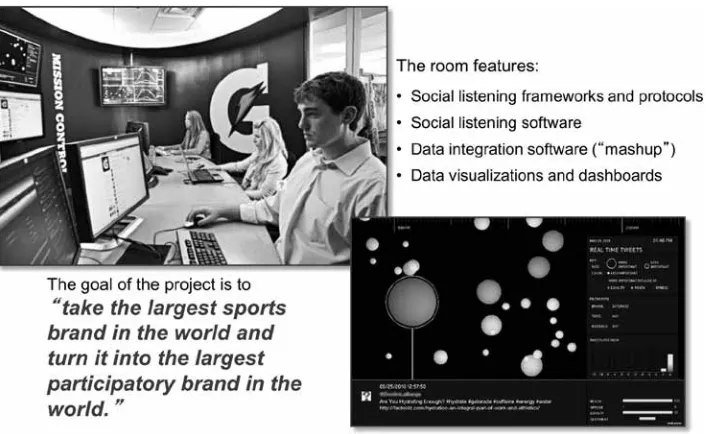
The marketing organization for Gatorade, a sports drink product, decided to create a Social Media Command Center to increase consumer dialog with Gatorade.12 Figure 3.1 shows the monitoring station with the dashboard. Big Data
Analytics can be used to monitor social media for feedback on product, price, and promotions as well as to automate the actions taken in response to the feedback. This may require communication with a number of internal organizations, track-ing a product or service problem, and dialog with customers as the feedback results in product or service changes. When consumers provide feedback, the dialog can only be created if the responses are provided in low latency. The
automated solutions are far better at systematically finding the information,
categorizing it based on available attributes, organizing it into a dashboard, and orchestrating a response at conversation speed.
3.2 Product Knowledge Hub
As consumers turn into sophisticated users of technology and the marketplace becomes specialized, the product knowledge seldom belongs to one organization. Take the Apple iPhone as an example. The iPhone is marketed by Apple, but its parts came from a large supply chain pool, the apps running on the iPhone come
Chapter 3: Big Data Analytics Applications • 17
from a large community of app developers, and the communications service is provided by a CSP. Google’s Android is even more diverse, as Google provides the operating system while a cell phone manufacturer makes the device. The smartphones do not work in isolation. They act as WiFi hubs for other devices. So, what happens if I want to know how to tether an iPhone to an Apple iPad? Do I call my CSP, or do I call Apple? Would either of their websites give me a simple step-by-step process I can follow?
Every time I get into these technical questions about products I am trying to use, I end up calling my son, who happens to know the answers to any such
question. Recently, he decided to educate me on how he finds the answer, and
so I was introduced to a myriad of third-party sites where a variety of solutions
can be found. In most cases, we can find them by searching using any popular
search engine. However, the solutions do not always favor the CSPs, and they are often dated, failing to take into account the latest offerings. Between the device operating system, the offerings from CSPs, and the apps, one must tread carefully through the versions to make sure the solution we discover is for the same version of software that is on the device. So now, we are facing data that is characterized by both variety and veracity. Can we use Big Data Analytics to solve this problem?
The solution involves three sets of technologies. Fortunately, Vivisimo has packaged these technologies into its Velocity product, making it easier to obtain
an integrated solution. The first part of the solution is the capability to tap any
sources of data. A CSP may already have pieces of the solution on its intranet, put together by product managers or customer service subject matter experts. Or, the information may reside on a device manufacturer site or a third-party site. All this data must be pulled and stripped of its control information so that the raw text is available to be reused.
The second part of the solution is to create a set of indices so that the raw information can be categorized and found when needed. Because many combina-tions of products exist, we would like to collect and combine information for the devices searched. The federated indexing system lets us organize the information for easy access.
What we have created is a knowledge hub, which can now be used directly
from a website or made available to the call centers. It significantly reduces call-handling time in the call centers and also increases first call resolution. By
placing the information on the web, we are now promoting the CSP’s website
as the source of knowledge, which increases web traffic and reduces the number
of people who resort to contacting the call center. Figure 3.2 depicts the Product Knowledge Hub.
Once we have created a single source of knowledge, this source can be used to upsell other products, connecting usage knowledge to product features and using the knowledge pool to discover new product or business partnership ideas. A lot of stray, fragmented knowledge about the products may be rapidly
organ-ized and find a variety of other uses.
3.3 Infrastructure and Operations Studies
A number of industries are exploring the use of Big Data to improve their infra-structure. In many situations, the best way to improve the infrastructure is to
Chapter 3: Big Data Analytics Applications • 19
understand its use and how bottlenecks or configurations impact performance.
In the past, this data required extensive manual data collection costs. Big Data provides a natural source of data with minimal data collection costs. I will lay out examples from public services to illustrate this point.
The city of Boston decided to use Big Data to identify potholes in the streets by sponsoring a competition in the analyst community. A winner came from
Sprout & Co., a nonprofit group in Somerville, Massachusetts. The solution
included the use of magnitude-of-acceleration spikes along a cell phone’s z-axis
to spot impacts, plus additional filters to distinguish potholes from other irregu -larities on the road. The new algorithm made Street Bump, a free download in Apple’s App Store, a winner.13 This analysis can save significant road survey cost.
Navigation systems can also use the cell phone data to avoid traffic congestion
and offer alternate routes. This type of use of Big Data is one of the best ways to gain acceptance without getting into privacy or security issues.
In another example, city bus and train agencies are making their real-time
transit information available to riders. This information significantly improves
the user experience and reduces the uncertainty associated with both planned and unexpected delays. Transloc (www.transloc.com) provides this information for riders using a variety of technologies, including smartphones, web, and SMS messages. It also provides prediction capabilities on expected arrival time. Once the app is loaded on a smartphone, the rider can use it to accurately estimate travel time and also review the travel route.
IBM’s Smarter Cities® initiative is using Big Data in a number of
applica-tions directed at city infrastructure and operaapplica-tions. Location data from cell
phones can be used to provide raw material for detecting traffic patterns.
These patterns can then be used to decide on new transportation projects,
to change controls, or to redirect traffic in case of an emergency.
Another important application for Big Data Analytics is public safety. The New York Police Department is using Big Data for crime prevention.14
3.4 Product Selection, Design, and Engineering
handheld devices, giving publishers an opportunity to understand what we read, how many times we read it, and which parts we look at. We watch television using a two-way set-top box that can record each channel click and correlate it to analyze whether the channel was switched right before, during, or after a commercial break. Even mechanical products such as automobiles are increasing electronic interactions. We make all of our ordering transactions electronically, giving third parties opportunities to analyze our spending habits by month, by season, by ZIP+4, and by tens of thousands of micro-segments. Usage data can be synthesized to study the quality of customer experience and can be mined for component defects, successes, or extensions. Marketing analysts can identify micro-segmentations using this data. For example, in a wireless company, we isolated problems in the use of cell phones to defective device antenna by analyz-ing call quality and comparanalyz-ing it across devices.
Products can be test marketed and changed based on feedback. They can also be customized and personalized for every consumer or micro-segment based on their needs. Analytics plays a major role in customizing, personalizing, and changing products based on customer feedback. Product engineering combines a set of independent components into a product in response to a customer need. Component quality impacts overall product performance. Can we use analytics to isolate poorly performing components and replace them with good ones? In addition, can we simplify the overall product by removing components that are rarely used and offer no real value to the customer? A lot of product engineering
analytics using customer experience data can lead to building simplified products
that best meet customer requirements.
To conduct this analysis and predictive modeling, we need a good under-standing of the components used and how they participate in the customer experience. Once a good amount of data is collected, the model can be used to isolate badly performing components by isolating the observations from custom-er expcustom-erience and tracing them to the poorly pcustom-erforming component. Complex products, such as automobiles, telecommunications networks, and engineering
goods, benefit from this type of analytics around product engineering.
The first level of analysis is in identifying a product portfolio mix and its
success with the customers. For example, if a marketer has a large number of products, these products can be aligned to customer segments and their usage.
We may find a number of products that were purchased and hardly used, leading
Chapter 3: Big Data Analytics Applications • 21
Once we have identified less-used products, the next analysis question is
whether we can isolate the cause of customer disinterest. By analyzing usage patterns, we can differentiate between successful products and unsuccessful ones. Were the unsuccessful ones never launched? Did many users get stuck with the
initial security screen? Maybe the identification process was too cumbersome.
How many users could use the product to perform basic functions offered by the product? What were the highest frequency functions?
The next level of analysis is to understand component failures. How many times did the product fail to perform? Where were the failures most likely? What led to the failure? What did the user do after the failure? Can we isolate the component, replace it, and repair the product online?
These analysis capabilities can now be combined with product changes to create a sophisticated test-marketing framework. We can make changes to the
product, try the modified product on a test market, observe the impact, and, after
repeated adjustments, offer the altered product to the marketplace.
Let us illustrate how Big Data is shaping improved product engineering and operations at the communications service providers. Major CSPs collect enormous amounts of data about the network, including network transport information coming from the routers and the switches, as well as usage infor-mation, popularly known as call detail records (CDRs), which are recorded each time we use telephones to connect with one another. As the CSP networks grew in sophistication, the CDRs were extended to data and video signals using IPDRs. Most CSPs refer to this usage information as xDRs (where x is now a variable that can be substituted for “any” usage information). For larger CSPs, the usage statistics not only are high volume (in billions of transactions a day) but also require low-latency analytics for a number of applications. For example, detecting a fraudulent transaction or abusive network user in the middle of a
video download or call may be more valuable than finding out this information
the next day. In addition, it is always a strategic driver for CSPs to lay out all the network and usage information on their network topology and geography and use a variety of automated analytics and manual visualization techniques to connect
the dots between network trouble or inefficiencies and usage. The analytics
provides CSP with a valuable capability to improve the quality of the communi-cation. If every user call is dropping in a particular area that is a popular location for premier customers, it could lead to churn of those customers to competitors.
purposes. CSPs have used this analytics to detect spots with poor network performance to reorganize towers and boosters. The differences in usage can be
analyzed to detect device problems such as faulty antennas on specific models. The variations can also be analyzed to find and fix network policies or routing
problems. As CSPs race to implement high-volume, low-latency xDR hubs, they
are finding plenty of business incentives to fund these programs and reap benefits
in the form of improved product offerings to their customers.
3.5 Location-Based Services
A variety of industries have location information about their customers. Cell phone operators know customer location through the location of the phones. Credit-card companies know the location of transactions, and auto manufactur-ers the location of cars, while social media is trying its best to get custommanufactur-ers to disclose their location to their friends and family. On a recent short trip to India, I decided to use Endomondo, an app on my cell phone to record my jogging activity in Mumbai, India, which was instantly posted on my Facebook page, thereby letting my friends know of my visit to Mumbai.
Let us take a wireless CSP example to study how we collect and summar-ize location information. A cell phone is served by a collection of cell phone
towers, and its specific location can be inferred by triangulating its distance from
the nearest cell towers. In addition, most smartphones can provide GPS location information that is more accurate (up to about 1 meter). The location data includes longitude and latitude and, if properly stored, could take about 26 bytes of information. If we are dealing with 50 million subscribers and would like to store 24 hours of location information at the frequency of once a minute, the data stored is about 2 terabytes of information per day. This is the amount of informa-tion stored in the locainforma-tion servers at a typical CSP.
Customer locations can be summarized into “hang outs” at different levels of granularity. The location information can be aggregated into geohashes that draw geo boundaries and transform latitude-longitude data into geohash so that it
can be counted and statistically analyzed. The presence of a person in a specific
location for a certain duration is considered a space-time box and can be used to
encode the hang out of an individual in a specific business or residential location for a specific time period.
Many of our smartphone apps collect location data, provided a subscriber “opts-in.”15 If a marketer is interested in increasing the traffic to a grocery
-Chapter 3: Big Data Analytics Applications • 23
ing campaign by analyzing and understanding which neighborhood people are
more likely to hang out or shop in that specific grocery store. Instead of blast -ing a promotion to all neighborhoods, the communication can now be directed
to specific neighborhoods, thereby increasing the efficiency of the market -ing campaign. This analysis can possibly be conducted us-ing 6-byte location
geohash over a span of one hour and finding all the cell phones that have visited
the grocery store regularly. A predictive model can compute the probability of a customer visiting the grocery store based on their past hang out history, and customer residence information can be clustered to identify neighborhoods most likely to visit the shopping center.
Analysis of machine-to-machine transaction data using Big Data technolo-gies is revolutionizing how location-based services can be personalized and offered at low latency. Consider the example of Shopkick, a retail campaign tool that can be downloaded on a smartphone. Shopkick seeks and uses location data to offer campaigns. Once the app is downloaded, Shopkick seeks permission to use current location as recorded by the smartphone. In addition, Shopkick has a database of retailers and their geo-locations. It runs campaigns on behalf of the merchants and collects its revenues from merchants. Shopkick will let me know, for example, that the department store in my neighborhood would like me to visit the store. As a further incentive, Shopkick will deposit shopping points in my account for just visiting the store. As I walk through the store, Shopkick can use my current location in the smartphone to record my presence at the store and award points.
Jeff Jonas provided me tremendous motivation for playing with location data. I used openpaths.cc, a site that tracks cell phone location, to track my where-abouts for approximately three months. Watching my movements over these months was like having a video unfold my activities event by event. I could also see how I could improve the accuracy of the location data collected by openpaths with other known information such as street maps. With the help of a business
directory, it is easy to find out the number and duration of my trips to Starbucks,
Tokyo Joe’s, and Sweet Tomato, my three most common eating hang outs.
Why would a customer “opt-in”? Device makers, CSPs, and retailers are beginning to offer a number of location-based services, in exchange for location
“opt-in.” For example, smartphones offer “find my phone” services, which
configuration service that switches a smartphone to silent mode every time the
subscriber enters the movie theater and switches back to normal ring tone once the subscriber leaves the movie theater. Prepaid wireless providers are engaging in location-based campaigns targeted at customers who are about to run out of prepaid minutes. These customers are the most likely to churn to a competitor and could easily continue with their current wireless provider if they were to be directed to a store that sells prepaid wireless cards.
These scenarios raise the obvious data privacy concern, which is a hotly debated topic worldwide. We will spend some time in the technical sections talking about data privacy, governance, and how consumer data can be protected and used only as permitted by the customer. As expected, there are many avenues for abuse of customer data, and data privacy must be engrained in the architec-ture for an effective protection of customer data.
3.6 Micro-Segmentation and Next Best Action
Automation has provided us with tremendous opportunity to use sensors to collect data in every step of the customer-facing processes, such as click streams in the use of a website. Sensor data gives us an opportunity to establish behav-ioral patterns using analytics. The early evolution was in use of analytics for segmentation. The original segmentations were demographic in nature and used hard consumer data, such as geography, age, gender, and ethnic characteristics to establish market segmentations. Marketers soon realized that behavioral traits were also important parameters to segment customers.
As our understanding grew, we saw more emphasis on micro-segments—
specific niche markets based on analytics-driven parameters. For example,
marketers started to differentiate innovators and early adopters from late adopt-ers in their willingness to purchase new electronic gadgets. Customer experience data let us characterize innovators who were eager to share experiences early on and could be more tolerant of product defects.
In the mid-1990s, with automation in customer touch points and use of the Internet for customer self-service, marketing became more interested in personal-ization and 1:1 marketing. As Martha Rogers and Don Peppers point out in their book The One to One Future, “The basis for 1:1 marketing is share of customer, not just market share. Instead of selling as many products as possible over the next sales period to whomever will buy them, the goal of the 1:1 marketer is to sell one customer at a time as many products as possible over the lifetime
of that customer’s patronage. Mass marketers develop a product and try to find customers for that product. But 1:1 marketers develop a customer and try to find
Chapter 3: Big Data Analytics Applications • 25
Early analytics systems were reporting systems that provided raw segmenta-tion data to the marketing team so that they could use the data to decide on marketing activities, such as campaigns. Automation in marketing and operations gave us the opportunity to close the loop—to use analytics to collect effective-ness data to revise and improve campaigns. We are seeing surges in campaign activity. Marketers are interested in micro-campaigns that are designed
specif-ically for a micro-segment or, in some cases, for specific customers. The
customer experience information gives us criteria for including a customer in the campaign.
If a marketing analyst were to see my location data, they would immediately conclude that I travel frequently, both domestically as well as internationally. They could establish that when I am not traveling, I am typically working from
home and occasionally at an office less than two miles from my house. They
could also see a number of my regular activities. At Northeastern University in Boston, network physicists discovered just how predictable people could be by studying the travel routines of 100,000 European mobile-phone users. After analyzing more than 16 million records of call dates, times, and locations, the researchers determined that, when compiled, people’s movements appeared to follow a mathematical pattern. The researchers stated that with enough informa-tion about past movements, they could forecast someone’s future whereabouts with 93.6 percent accuracy.17
How do we use location data to derive micro-segments? At the simplest level, if we take the past three months of location data across a set of people, we
can differentiate between globe trotters, people doing field jobs, “9 to 5ers” (i.e., people working desk jobs during regular office hours), and people working from
home. At the next level, we can start to infer frequent behaviors. By observing how many times I visit a coffee shop, the mall, or a golf course, for example, we can establish my hang outs using frequency rules (e.g., “more than four visits per month, each for a duration of an hour or longer” constitutes a hang out). A marketer may seek a customer to “opt-in” their location information and offer
location and context-specific promotions.
Next Best Action (NBA) recommends an activity based on the customer’s latest experience with the product. This could include an up-sell or cross-sell
based on current product ownership, usage level, and behavioral profile. An NBA
discounted trip to your favorite warm-weather golf vacation spot on a cold day.) NBA can also be revised based on feedback from customer reactions.
Let me illustrate how Big Data is changing our business processes. For a number of decades, television producers relied on a control sample of audience viewing habits to gauge the popularity of their television shows. This data was collected using extensive surveys in the early days of television programming and then using special devices placed on a sample of television sets by companies such as Nielsen. With the advancement in the cable set-top box (STB) and digital network supporting the cable and satellite industries, we can now collect channel
surfing data from all the STBs capable of providing this information. As a result, the size of data collected has grown considerably, providing us with finer insights
not previously available. This information is very valuable because it can be used
to correlate channel surfing with a number of micro-segmentation variables.
The grocery stores have been equally busy developing their understanding of customers. Most of them offer frequent shopper cards that can be used by the grocer to track purchase habits as well as used by the shoppers to redeem discounts and other useful campaigns. With identifying information collected from the customer, this shopper card can be correlated with a name and an address. So, if we have the retailer’s information from the frequent shopper card and the cable provider’s information about television viewing habits, we
could correlate the channel surfing data with retail purchases by the household
and insert appropriate commercials to run micro campaigns based on household purchases.
Retailers toyed with the idea of providing shopping gadgets to shoppers and eventually realized that creating a smartphone app to run on an existing device would be easier than engineering a new device. The shoppers may activate a mobile app as soon as they enter the retail store. The app starts to collect GPS-level accurate location information about the shopper and lets the shopper check in grocery items on the smartphone. At the checkout counter, the shopper connects the smartphone to the point-of-sale (PoS) device, and the grocery bill is automatically paid by the credit card associated with the app. As the person walks through the grocery store and checks in grocery items using a smartphone, a campaign management system starts downloading mobile coupons based on
customer profile, past grocery purchases, and currently active promotions.
Chapter 3: Big Data Analytics Applications • 27
purchase, or air commercials based on what a specific consumer is buying. It
requires our ability to connect retail and cable advertising data as well as an ecosystem where the two analytics systems (retail and cable) can collaborate.
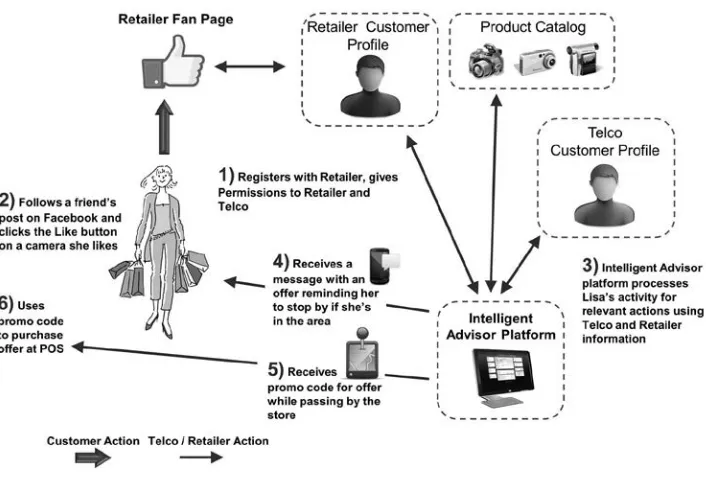
A triple-play CSP (providing cable, broadband, and wireless services) could use its customer database to correlate customer activities across these three screens. Many consumers are viewing media using Internet over their desktops or tablets. We can now start to correlate media viewing, location-based micro-segments, and customer purchase intentions as known through social media to
make retail offers. Figure 3.3 shows a scenario where consumer profiles from
CSP and retail segments are used for creating context- and micro-segment-based offers to consumers. The consumer registers on the retailer’s website, giving
permission to the retailer to use profile data. The retailer uses consumer context and location to tailor a specific promotion.
3.7 Online Advertising
Television and radio have used advertising as their funding model for decades. As online content distribution becomes popular, advertising has followed the content distribution with increasing volumes and acceptance in the marketplace. The
recently concluded Olympics in London provided a testament to the popularity of mobile and other online media distribution channels as compared with television. Almost half of the Internet video delivered during the Olympics went to mobile phones and tablets. That’s a watershed for portable TV. Nearly 28 million people visited NBCOlympics.com, eight percent higher as compared with the Beijing Olympics four years ago. Sixty four million video streams were served across all platforms, a 182 percent increase over Beijing. Nearly 6.4 million people used mobile devices.18
Online advertising is also becoming increasingly sophisticated. I discussed the supply chain for digital advertising with a number of specialized players in Section 2.3. The biggest focus is the advertisement bidding managed for a publisher, such as Google, by either a Supply Side Platform (SSP) or Advertising Exchange. Online advertising provides tremendous opportunity for advertising to a micro-segment and also for context-based advertising. How do we deliver these products, and how do they differ from traditional advertising?
The advertiser’s main goal is to reach the most receptive online audience in the right context, who will then engage with the displayed ad and eventually take
the desired action identified by the type of campaign.19 Big Data provides us with
an opportunity to collect myriads of behavioral information. This information can be collated and analyzed to build two sets of insights about the customers, both of which are very relevant to online advertising. First, the micro-segmentation information and associated purchase history described in Section 3.6 allows us to establish buyer patterns for each micro-segment. Second, we can use the context
of an online interaction to drive context-specific advertising. For example, for
someone searching and shopping for a product, a number of related products can be offered in the advertisements placed on the web page.
Chapter 3: Big Data Analytics Applications • 29
Let us consider an example to understand the flow of information and collab -oration between publisher, Ad Exchange, DSP, and advertiser to deliver online advertisements. If a user initiates a web search for food in a particular zip code on a search engine, the search engine will take the request, parse it, and start to deliver the search result. While the search results are being delivered, the search engine decides to place a couple of advertisements on the screen. The search engine seeks bids for those spots, which are accumulated via Ad Exchange and offered to a number of DSPs competing for the opportunities to place advertise-ments for their advertisers. In seeking the bid, the publisher may supply some contextual information that can be matched with any additional information known to the DSP about the user. The DSP decides whether to participate in this
specific bid and makes an offer to place an ad. The highest bidder is chosen, and
their advertisement is delivered to the user in response to the search. Typically, this entire process may take 80 milliseconds.
A Data Management Platform (DMP) may collect valuable statistics about the advertisement and the advertising process. The key performance indicators (KPIs) include the number of times a user clicked the advertisement, which provides a measure of success. If a user has received a single advertisement many times, it may cause saturation and reduce the probability that the user will click the advertisement.
As online advertising is integrated with online purchasing, the value of placing an advertisement in the right context may go up. If the placement of the ad results in the immediate purchase of the product, the advertiser is very likely to offer a higher price to the publisher. DSP and DMP success depends directly on their ability to track and match consumers based on their perceived
informa-tion need and their ability to find advertising opportunities related closely to an
online sale of associated goods or services.
3.8 Improved Risk Management
A credit-card company can use cell phone location data to differentiate an authentic user from a fraudulent one. As the credit card is used in a location, the credit-card transaction location can be matched with the cell phone location for the customer to reduce risk of fraudulent transactions.