Big-Data Analytics and Cloud Computing
Theory, Algorithms and Applications
Shao Ying Zhu • Lu Liu
Editors
Big-Data Analytics and Cloud Computing
Theory, Algorithms and Applications
123
Department of Computing and Mathematics University of Derby Derby, UK
ISBN 978-3-319-25311-4 ISBN 978-3-319-25313-8 (eBook) DOI 10.1007/978-3-319-25313-8
Library of Congress Control Number: 2015958882 Springer Cham Heidelberg New York Dordrecht London
© Springer International Publishing Switzerland 2015
This work is subject to copyright. All rights are reserved by the Publisher, whether the whole or part of the material is concerned, specifically the rights of translation, reprinting, reuse of illustrations, recitation, broadcasting, reproduction on microfilms or in any other physical way, and transmission or information storage and retrieval, electronic adaptation, computer software, or by similar or dissimilar methodology now known or hereafter developed.
The use of general descriptive names, registered names, trademarks, service marks, etc. in this publication does not imply, even in the absence of a specific statement, that such names are exempt from the relevant protective laws and regulations and therefore free for general use.
The publisher, the authors and the editors are safe to assume that the advice and information in this book are believed to be true and accurate at the date of publication. Neither the publisher nor the authors or the editors give a warranty, express or implied, with respect to the material contained herein or for any errors or omissions that may have been made.
Printed on acid-free paper
Springer International Publishing AG Switzerland is part of Springer Science+Business Media (www.
springer.com)
Among developments that have led to the domain of cloud computing, we may consider the following. Very often, the workplace is now distributed and potentially even global. Next, there is the ever-increasing use being made of background ‘big data’. When data is produced in real time and dynamically evolving, then a cloud platform is highly beneficial. Next comes the wide range of platforms used for access and use of data and information. In this picture, mobile and networked platforms are prominent. So too are the varied aspects of pervasive and ubiquitous computing and systems.
Cloud platforms are the foundations for our physical and virtual environments that are empowered increasingly by the Internet of Things. That is, the general progression that enables smarter cities and other related developments. Among these also are the smart workplace and the smart learning environment.
This book collects together many discussion and research topics relating to cloud services, technologies and deployments. Included are cloud service provision, inte- gration with advanced interactivity and cloud-based architectures for the provision of large-scale analytics. Sustainability plays a crucial role, especially in relation to data centres, data grids and other layers of middleware that can be central parts of our compute environment and data clouds. The following inspirational quotation was voiced by Christian Belady, General Manager, Data Center Services, Microsoft:
‘Data is really the next form of energy: : :I view data as just a more processed form of energy’.
The contributions in this book aim at keeping one fully abreast of these big data and closely related developments. Even more rewarding is to be actively engaged in such technological progress. It can well be the case that dividing lines effectively disappear in regard to user and supplier and producer and consumer, where the latter becomes the prosumer.
The reader can enjoy this book’s contents, and draw inspiration and benefit, in order to be part of these exciting developments.
Big Data Laboratory Professor Fionn Murtagh
University of Derby, UK August 2015
v
Overview and Goals
Data is being created around us at an increased rate, in a multitude of forms and types. Most of the advances in all the scientific disciplines that have occurred over the last decade have been based on the extraction, management and assessment of information to provide cutting-edge intelligence. This, in turn, has accelerated the need, as well as the production of large amounts of data, otherwise referred to as big data.
Due to the diverse nature of big data, there is a constant need to develop, test and apply theoretical concepts, techniques and tools, to successfully combine multidisciplinary approaches to address such a challenge. As such, theory is continuously evolving to provide the necessary tools to enable the extraction of relevant and accurate information, to facilitate a fuller management and assessment of big data.
As a consequence, the current academic, R&D and professional environments require an ability to access the latest algorithms and theoretical advance in big data science, to enable the utilisation of the most appropriate approaches to address challenges in this field.
Big-Data Analytics and Cloud Computing: Theory, Algorithms and Applications presents a series of leading edge articles that discuss and explore theoretical concepts, principles, tools, techniques and deployment models in the context of Big Data.
Key objectives for this book include:
• Capturing the state of the art in architectural approaches to the provision of cloud- based big data analytics functions
• Identifying potential research directions and technologies to facilitate the reali- sation of emerging business models through big data approaches
• Providing relevant theoretical frameworks and the latest empirical research findings
vii
• Part I refers to the theoretical aspects of big data, predictive analytics and cloud- based architectures.
• Part II discusses applications and implementations that utilise big data in cloud architectures.
Target Audiences
We have written this book to support a number of potential audiences.Enterprise architectsandbusiness analystswill both have a need to understand how big data can impact upon their work, by considering the potential benefits and constraints made possible by adopting architectures that can support the analysis of massive volumes of data.
Similarly,business leadersandIT infrastructure managerswill have a desire to appreciate where cloud computing can facilitate the opportunities afforded by big data analytics, both in terms of realising previously hidden insight and assisting critical decision-making with regard to infrastructure.
Those involved in system design and implementation asapplication developers will observe how the adoption of architectures that support cloud computing can positively affect the means by which customers are satisfied through the application of big data analytics.
Finally, as a collection of the latest theoretical, practical and evaluative work in the field of big data analytics, we anticipate that this book will be of direct interest toresearchersand alsouniversity instructorsfor adoption as a course textbook.
Suggested Uses
Big-Data Analytics and Cloud Computingcan be used as an introduction to the topic of big data within cloud environments, and as such the reader is advised to consult Part I for a thorough overview of the fundamental concepts and relevant theories.
Part II illustrates by way of application case studies, real-world implementations of scenarios that utilise big data to provide value.
Readers can use the book as a ‘primer’ if they have no prior knowledge and then consult individual chapters at will as a reference text. Alternatively, foruniversity instructors, we suggest the following programme of study for a twelve-week semester format:
• Week 1: Introduction
• Weeks 2–5: Part I
• Weeks 5–11: Part II
• Week 12: Assessment
Instructors are encouraged to make use of the various case studies within the book to provide the starting point for seminar or tutorial discussions and as a means of summatively assessing learners at the end of the course.
Derby, UK Marcello Trovati
Richard Hill Ashiq Anjum Shao Ying Zhu Lu Liu
The editors acknowledge the efforts of the authors of the individual chapters, without whose work, this book would not have been possible.
Big Data Laboratory Marcello Trovati
Department of Computing and Mathematics Richard Hill
University of Derby, UK Ashiq Anjum
August 2015 Shao Ying Zhu
Lu Liu
xi
Part I Theory
1 Data Quality Monitoring of Cloud Databases Based
on Data Quality SLAs. . . 3 Dimas C. Nascimento, Carlos Eduardo Pires,
and Demetrio Mestre
2 Role and Importance of Semantic Search in Big Data Governance . . 21 Kurt Englmeier
3 Multimedia Big Data: Content Analysis and Retrieval. . . 37 Jer Hayes
4 An Overview of Some Theoretical Topological Aspects
of Big Data. . . 53 Marcello Trovati
Part II Applications
5 Integrating Twitter Traffic Information with Kalman Filter Models for Public Transportation Vehicle Arrival
Time Prediction.. . . 67 Ahmad Faisal Abidin, Mario Kolberg, and Amir Hussain
6 Data Science and Big Data Analytics at Career Builder. . . 83 Faizan Javed and Ferosh Jacob
7 Extraction of Bayesian Networks from Large
Unstructured Datasets. . . 97 Marcello Trovati
8 Two Case Studies Based on Large Unstructured Sets. . . 111 Aaron Johnson, Paul Holmes, Lewis Craske, Marcello Trovati,
Nik Bessis, and Peter Larcombe
xiii
Ahmad Faisal Abidin Computing Science and Mathematics, University of Stirling, Stirling, Scotland, UK
Ashiq Anjum Department of Computing and Mathematics, University of Derby, Derby, UK
Omar Behadada Department of Biomedical Engineering, Faculty of Technology, Biomedical Engineering Laboratory, University of Tlemcen, Tlemcen, Algeria Nik Bessis Department of Computing and Mathematics, University of Derby, Derby, UK
Lewis Craske Department of Computing and Mathematics, University of Derby, Derby, UK
Dominic Davies-Tagg Department of Computing and Mathematics, University of Derby, Derby, UK
Kurt Englmeier Faculty of Computer Science, Schmalkalden University of Applied Science, Schmalkalden, Germany
Jer Hayes IBM Research, Dublin, Ireland
Richard Hill Department of Computing and Mathematics, University of Derby, Derby, UK
Paul Holmes Department of Computing and Mathematics, University of Derby, Derby, UK
Amir Hussain Computing Science and Mathematics, University of Stirling, Stirling, Scotland, UK
Ferosh Jacob Data Science R&D, CareerBuilder, Norcross, GA, USA Faizan Javed Data Science R&D, CareerBuilder, Norcross, GA, USA
xv
Dimas C. Nascimento Department of Computer Science, Federal University of Campina Grande, Campina Grande, PB, Brazil
Carlos Eduardo Pires Department of Computer Science, Federal University of Campina Grande, Campina Grande, PB, Brazil
Marcello Trovati Department of Computing and Mathematics, University of Derby, Derby, UK
Theory
data quality service level agreements, which aim to specify customers’ requirements regarding the process of data quality monitoring. In practice, factors such as the Big Data scale, lack of data structure, strict service level agreement requirements, and the velocity of the changes over the data imply many challenges for an effective accomplishment of this process. In this context, we present a high-level architecture of a cloud service, which employs cloud computing capabilities in order to tackle these challenges, as well as the technical and research problems that may be further explored to allow an effective deployment of the presented service.
1.1 Introduction and Summary
Data quality monitoring (DQM) is the process that evaluates a data set to determine if it meets the planning objectives of a project and thus provide data of the right type, quality, and quantity to support their intended use. DQM is built on a fundamental premise: data quality is meaningful only when it relates to the intended use of the data. For example, in order to achieve the full potential that is provided by an integrated view of the data integrated in a data warehouse, it is necessary to develop strategies to maintain acceptable levels of confidence over the data. Similarly, other levels of confidence must also be consolidated regarding legal aspects and industry standards. Thereby, establishing data quality standards and adopting a continuous monitoring strategy in order to guarantee that these standards are used will lead to an overall data quality improvement. In turn, this accomplishment will result in reduction of time spent on diagnosis and correction, increased speed of delivering information, and improvement of confidence in the decisions [1]. In this context,
D.C. Nascimento () • C.E. Pires • D. Mestre
Department of Computer Science, Federal University of Campina Grande, Rua Aprigio Veloso, 882, 58429-900 Campina Grande, PB, Brazil
e-mail:[email protected]
© Springer International Publishing Switzerland 2015
M. Trovati et al. (eds.),Big-Data Analytics and Cloud Computing, DOI 10.1007/978-3-319-25313-8_1
3
there is an evident need to incorporate data quality considerations into the whole data cycle, encompassing managerial/governance as well as technical aspects [2].
Regarding the Big Data initiative, data governance must ensure high data quality as a basis for its effective usage [3]. A Big Data user may focus on quality which means not having all the data available but having a (very) large quantity of high- quality data that can be used to draw precise and high-valued conclusions [4]. In fact, one of the focuses of Big Data systems should be on quality data storage rather than storing very large irrelevant data. Thereby, it is important to investigate questions such as deciding which portion of data is relevant, how much data would be enough for decision making, and whether the stored data is accurate (or not) to draw conclusions from its content [5]. All these questions are strongly tied to data quality concepts and dimensions.
In this sense, the process of DQM is challenged by many factors such as (i) the amount of processed data (Big Data era), (ii) the heterogeneity of data sources and structure, (iii) the computational complexity of the data quality algorithms, (iv) the amount of hardware infrastructure required to execute these algorithms, and (v) the velocity of changes (insertions, updates, and deletions) that affects the data stored in databases. Due to these challenges, business managers may prefer to outsource the overall process of data storage and continuous monitoring of data quality, due to either operational or financial reasons. Nowadays, hardware- and service-level outsourcing is usually done by using cloud computing technologies.
Cloud computing has recently emerged as a computing platform with reliability, ubiquity, and availability in focus [6] mainly by utilizing computing as an on- demand service [7] and simplifying the time-consuming processes of hardware provisioning, hardware purchasing, and software deployment. Another advantage is scalability in terms of computing resources. Service providers can scale up when the demand for service rises significantly. Similarly, they can scale down when the demand decreases. Cloud computing also enables service consumers to use services on a pay-as-you-go or a monthly subscription basis [6].
Regarding the data quality monitoring outsourcing contract, the rules and requirements that need to be met by the service provider are described in a data quality SLA (DQSLA), which is the most common way to specify contract parameters in the cloud computing context. In this scenario, this book chapter has the following main objectives:
• The DQSLA formalization: this formalism will allow the representation of unambiguous agreements between customers and data quality service providers.
• A data quality-aware service architecture: a high-level architectural design that depicts the main modules of a service to provide the process of continuous data quality monitoring, based on DQSLA inputs and suitable approaches for handling the Big Data scale.
• Open research problems: the discussion of a catalog of open research problems that may be further explored by database researchers and practitioners.
These objectives are further detailed and discussed in the following sections of this chapter.
For example, a record linkage task (which aims to identify duplicated records stored in the database) presents high computational complexity. When two database tables, A and B, are to be matched to identify possible duplicates, potentially each record from A needs to be compared with every record from B, resulting in a maximum number of (jAj jBj) comparisons between two records [8]. Therefore, the computational efforts of comparing records increase quadratically as databases get larger. Moreover, the data quality evaluation needs to be frequently re-executed when the data is updated over time.
1.2.1 Data Quality in the Context of Big Data
Nowadays, data is growing at a huge speed, making it difficult to handle such large amount of data (exabytes) [5]. Similar to what happens to traditional systems, classical algorithms are not designed to handle the Big Data scale and demands. Big Data imposes two initial classes of challenges: engineering, efficiently managing data at unimaginable scale, and semantics, finding and meaningfully combining information that is relevant to its intended usage [9]. In turn, when handling the semantics challenge, its accomplishment may be strongly influenced by the quality of the data, and thus data quality evaluation, together with efficient management of Big Data, becomes two essential concerns. For example, it is important to measure completeness and consistency, which are data quality dimensions, of Big Data data sets [9]. Clearly, effective Big Data processing involves a multidisciplinary approach toward its solution.
In order to accomplish a meaningful usage of Big Data, it is necessary to perform an effective usage of computation capacity and algorithms to integrate, filter, analyze, process, and identify patterns using Big Data data sets and, based on the results, draw useful conclusions and claims. This scenario of Big Data data sets claims a wise usage and employment of current technologies for an effective usage of this opportunity. The employment of suitable technologies and approaches toward Big Data will allow practitioners and researchers to ask crucial questions about the meaning of the data, evaluate how trustable is its content, and decide in which contexts to apply the discoveries, in other words, how to get the true value of Big Data.
In practice, the three main V’s (velocity, variety, volume) of a Big Data appli- cation impose many challenges for the tasks of data quality evaluation, monitoring, and correction. First, the Big Data scale may generate very high execution times for an evaluation of its quality when employing naive approaches. In turn, the variety of data types and formats that are present in Big Data applications demands new breakthroughs on the data quality algorithms. Lastly, the velocity of data updates is often high, quickly making previous data quality results obsolete [10]. In this context, Big Data’s success is inevitably linked to an intelligent management of data selection and usage as well as joint efforts toward clear rules regarding data quality [3]. To this end, tasks such as filtering, cleansing, pruning, conforming, matching, joining, and diagnosing should be applied at the earliest touch points possible [5].
Therefore, it becomes important to design new classes of systems and algorithms that are able to scale up to thousands or even millions of entities [11]. This can be accomplished by combining efficient approaches for executing data quality algorithms in a distributed manner [12,13] together with optimized techniques for executing data quality algorithms, such as indexing [14] and incremental approaches [10]. These approaches are further discussed and detailed throughout this chapter.
1.2.2 Cloud Computing
Cloud services are applications or services offered by means of cloud computing.
Therefore, by adopting cloud services, business managers are considering to take advantage of the economic benefits offered by maintaining parts of its IT resources and tasks by a cloud service provider [6]. Nowadays, nearly all large software companies, such as Google, Microsoft, and Oracle, are providing cloud services. Besides, cloud computing has revolutionized the standard model of service provisioning, allowing delivery over the Internet of virtualized services that can scale up and down in terms of processing power and storage. Cloud computing also provides strong storage, computation, and distributed capability to support Big Data processing. In order to achieve the full potential of Big Data, it is required to adopt both new data analysis algorithms and new approaches to handle the dramatic data growth and needs of massive scale analytics. As a result, one of the underlying advantages of deploying services on the cloud is the economy of scale. By using the cloud infrastructure, a service provider can offer better, cheaper, and more reliable services [6].
The high-level architecture of the cloud computing business model is shown in Fig.1.1. The architecture depicts four levels of the stack: client layer, service layer, platform layer, and infrastructure layer. Service providers deploy their services (Software as a Service level (SaaS)) on a cloud computing environment that can be used or consumed by customers or other applications on the client layer. The consumption of the available services is formalized by a service level agreement (SLA) that is arranged between the customer and the provider of the service. In
Fig. 1.1 High-level cloud computing stack
the SaaS level, the customers do not have control over the hardware- and software- level configurations of the consumed service. In practice, the interaction between the customers and the service is limited to the service interface and customers’
input parameters. The data quality-aware service architecture, further discussed in this book chapter, is an example of a SaaS that needs to meet predefined quality of service requirements (specified as data quality SLAs).
Alternatively, customers may also hire the second level of the stack (Platform as a Service (PaaS)), which is a development platform that facilitates the development of cloud services by the customers. This platform usually includes frameworks, devel- oping and testing tools, configuration management, and abstraction of hardware- level resources. Lastly, customers can hire hardware-level resources available in the Infrastructure as a Service (IaaS) cloud. Virtualization is extensively used in IaaS cloud in order to integrate/decompose physical resources in an ad hoc manner to meet growing or shrinking resource demand from cloud consumers [15]. Regardless of the level of the cloud stack that is consumed by the customers, the consumed resources (either physical or virtual) are usually delivered using a predefined pay- per-use model.
A cloud database is a database that is hosted on a cloud computing environment.
In practice, the access to a cloud database can be performed using a database management system (DBMS) that runs over a virtual machine or via a database service interface. In the latter case, usually named Database as a Service (DBaaS), the database installation, maintenance, and accessibility interface are provided by a database service provider. The adoption of DBaaS is an effective approach to cloud- based applications and services as part of the Software as a Service business model.
Among the main characteristics of a DBaaS, there are cloud portability, scalability, and high availability. These characteristics are provided by using cloud computing capabilities, such as hardware provisioning and service redundancy.
1.2.3 Data Quality Monitoring in the Cloud
A possible approach to perform data quality monitoring in the cloud is by adopting a data quality-aware service (DQaS) [16]. This service relies on data quality service level agreements (DQSLAs) established between service consumers and the DQaS provider.
In order to tackle strict DQSLA requirements and Big Data processing, a DQaS must use or combine the following approaches: (i) execute incremental data quality algorithms, (ii) use computational resources provisioning, or (iii) execute data quality algorithms in a distributed manner. The first approach has been addressed by the scientific community, mainly by using historical metadata to avoid reprocessing an entire data set D after subsequent changes (4D1,4D2, : : : ,4Dn) over D [10].
For doing so, metadata about the initial data set evaluation is stored, which is then used to avoid unnecessary comparisons and computations over the portion of D that is not related or will not be influenced by a specific4Dithat affected D.
The main goal of this chapter is to discuss the adoption of the approaches (ii) and (iii) on a DQaS architecture that relies on DQSLAs. In other words, we intend to explain how to take advantage of cloud computing capabilities in order to tackle customers’ DQSLA requirements and Big Data processing.
1.2.4 The Challenge of Specifying a DQSLA
In the context of cloud computing, a quite relevant metric is the level of satisfaction of cloud customers in terms of performance and quality of service (QoS) they get from cloud service providers. QoS refers to a set of qualities or characteristics of a service, such as availability, security, response time, throughput, latency, reliability, and reputation. Such qualities are of interest for service providers and service consumers alike [6]. The agreement between the customer and the service provider, known as the service level agreement (SLA), describes agreed service functionality, cost, and qualities [17].
In essence, an SLA is a legally binding contract that states the QoS guarantees that an execution environment, such as a cloud-based platform, has to provide its hosted applications with [18]. An SLA consists of a collection of contractual clauses between a service provider and a service customer that detail the nature, quality, and scope of the service to be provided and its authorized use [19]. Finally, an SLA may also specify the percentage of SLA violations that be tolerated, within a predefined time interval, before the service provider incurs a (e.g., economic) penalty [18].
Measuring conformance to defined service levels has long been part of network, server, and desktop management [1]. For example, it is usually clear when the network is too slow or if a server fails. However, the difference between hardware service level management and data quality service level management is in the per- ceived variability in specifying what is meant byacceptable levels of service[1] and
1.2.5 The Infrastructure Estimation Problem
One of the approaches that can be used by a DQaS to tackle DQSLA requirements and Big Data handling, by means of cloud computing, is to use infrastructure provisioning, i.e., an on-demand allocation of hardware provisioning.
In order to execute a data quality algorithm to evaluate database data, a DQaS must allocate a computational grid to execute the algorithm in a distributed manner.
In practice, the service’s resource requirements are fulfilled by the physical or vir- tual computational nodes (virtual machines) upon which the algorithms are executed [16]. The configuration class estimated by the service is a cluster composed by a pair
< Number of Nodes (VM’s), VM Configuration >. Let ND fN1, N2, : : :, Nngbe the amount of VM’s that can be allocated for an execution of a data quality algorithm and”D f”1,”2, : : : ,”kgthe available VM configurations. A configuration class (Cl) is a pair < Ni,”j > that represents the configuration of a grid composed by virtual machines. Then, ClD(N”)D fCl1, Cl2, : : : , Cln.kgrepresents the set of all possible configuration classes that can be chosen by the DQaS.
Intuitively, one of the critical parts of a DQSLA is the time restriction to execute a data quality task. This is particularly important since the data quality monitoring process may affect how fast users and systems may rely on the monitored data sets to use the data for their respective purposes. In this context, for the execution of a single data quality algorithm executione, we want to estimate a proper class Clc that is able to minimize the difference between the restriction time defined on the DQSLA that triggerede(Tres(e)) and the execution time ofe(ExecTime(e)), as stated in Table1.1.
If an underprovisioning policy is adopted, i.e., allocating a low configuration class for the execution of a data quality algorithm, it is highly probable that the
Table 1.1 The infrastructure
estimation problem Find Clc
Over (N”)D fCl1, Cl2, : : :, Cln.kg Subject to ExecTime(e)Tres(e)
DQSLA time restriction will not be met by the DQaS. On the other hand, in order to ensure that a customer DQSLA time restriction is not violated, a resource overprovision policy may be adopted, which is based on evaluating (either through application modeling or through application benchmarking) all possible resources that a data quality algorithm can require in the worst case and then statically allocating these resources to that particular execution. This policy can lead to a largely suboptimal utilization of the cloud environment resources. In fact, being based on a worst-case scenario, a number of allocated resources may remain unused at run time. This limitation can be overcome by developing provisioning algorithms, which can be integrated in the DQaS architecture in order to manage dynamically the cloud configuration classes for the data quality algorithms’ executions and honor the DQSLA time restrictions using a minimum amount of virtualized infrastructure.
This approach is further detailed in the following sections of this chapter.
1.3 Proposed Solutions
In this section, we discuss potential design solutions to the problems described throughout this book chapter, namely, (i) the DQSLA representation, (ii) the infrastructure provisioning problem, and (iii) the challenges that need to be tackled regarding the DQaS development.
1.3.1 Data Quality SLA Formalization
In order to allow an unambiguous and formal representation of a data quality SLA, in this section we formalize its structure, by enabling the involved parties to express their expectations regarding information such as the data quality dimensions, parameters of the data quality algorithms, the data sets to be analyzed, the overall efficiency of the process, and so on. We define a data quality SLA [16] as a 9-tuple:
DQSLAD<Rid; DQdim; Mrules; tsvalid; jDjthr; Tres; Rmethod; SLApenalties; Initexec>; whereW
1. Rid: is a unique resource identifier of the data set (or data sets involved) to be monitored
2. DQdim: is a data quality dimension [20], such as completeness, accuracy, duplication, volatility, and so on
3. Mrules: represents the details (parameters of the data algorithms) used to evaluate the monitored data set (referenced as Rid)
4. 4tsvalid: is the timestamp interval in which the DQSLA is valid
5. j4Djthr: is the amount of changes (insertion, update, or deletion) in the data set (Rid) that will trigger a new execution of a data quality algorithm by the service to evaluate the quality of the data set as specified by the Mrulesparameter
1.3.2 Examples of Data Quality SLAs
The process of data quality assessment is performed based on data quality dimen- sions to be evaluated. In turn, a data quality dimension needs to be further detailed by specifying specific parameters for data quality algorithms and thresholds that define the levels of acceptability for a specific aspect of the data. For this reason, some of the inputs of the DQSLA may be specified based on predefined Backus Normal Form (BNF) rules, for example:
[Rmethod] :DOnlinejHistorical
[DQdim] :DAccuracyjCompletenessjTimelinessjDuplicationj : : :
Using the above rules, we provide the following example of a DQSLA using the Duplication [21] dimension:
DQSLA_01 D < 011, Duplication, Deduprules, (2014-11-09 11:20, 2014-11-11 11:20), 5000, 15 min, Online, SLApenalties, true >
In practice, the DQSLA_01 SLA specifies that the data set (011) must be continuously monitored for duplication detection during the timestamp interval (2014-11-09 11:20, 2014-11-11 11:20). The evaluation must be performed accord- ing to the parameters specified by the Deduprules content and must not take more than 15 min to be executed. Besides the initial evaluation of the data set (InitexecDtrue), the data set (011) must be reevaluated after each 5000 changes on its content. Moreover, the results of the evaluation of the monitored data set should be continuously reported via a web interface (RmethodDOnline). Lastly, there is a penalty for the service provider (SLApenalties) if the evaluation process takes more time than 15 min.
In turn, the Deduprules component of the DQSLA may be further detailed according to the following BNF rules:
Deduprules D f[Detection_Method], [Similarity_Function], [Match_Rules], [DQ_Dim_Evaluation]g
[Detection_Method] :D Standard_Blocking j Graph_Clustering j Sorted_Neighborhood j : : :
[Similarity_Function] :D Jaccard j Jaro_Winkler j Edit_Distance j n-gram j : : :
[Match_Rules] :D ([Sim_Value] [™] [Thr_Value]
D> [Sim_Class]) j
([Sim_Value] [™] [Thr_Value]
D> [Sim_Class] AND [Match_Rules]) [™] :D > j < j j j ¤ j D
[Sim_Class] :D Match j Non_Match j Possible_Match [Dim_Evaluation] :D (jmatchesj / jresource_idj) [Sim_Value] :D [d] . [d]
[Thr_Value] :D [d] . [d]
[blocking_key] :D [attr_name] j substring([attr_name], [d], [d]) j [blocking_key] concat [blocking_key]
[attr_name] :D [letter][character]*
[character]:D [d] j [letter]
[letter] :Da..z j A..Z [d] :D 0..9
Regarding the Completeness [1] dimension, which evaluates the extent of data that is of sufficient breadth, depth, and scope for the task at hand [22], the following BNF rules can be used to specify a DQSLA:
Complrules D f[Value_Completeness], [Tuple_Completeness], [Attribute_Completeness], [Relation_Completeness]g [Value_Completeness] :D [™] [d].[d]
[Tuple_Completeness] :D [™] [d].[d]
[Attribute_Completeness] :D [™] [d].[d]
[Relation_Completeness] :D [™] [d].[d]
[™] :D > j < j j j ¤ j D [d] :D 0..9
Using the above rules, we provide the following example of a DQSLA using the Completeness dimension:
DQSLA_02D< 022, Completeness,f< 0.9, < 0.9, < 0.9, < 0.9g, (2014-11-09 11:20, 2014-11-11 11:20), 250, 5 min, Online, SLApenalties, true >
Similar to the DQSLA_01 semantics, the DQSLA_02 SLA specifies that the data set (022) must be continuously monitored for completeness evaluation during the timestamp interval (2014-11-09 11:20, 2014-11-11 11:20). The evaluation of the monitored data set, which cannot take more than 5 min to be executed, must be reported via a web interface (RmethodDOnline) every time any measure of the completeness dimension is below 90 %, as specified by the Mrulescontent. Besides the initial evaluation of the data set (InitexecDtrue), the data set (022) must be
The adoption of cloud computing for databases and data services introduces a variety of challenges, such as strict SLA requirements and Big Data processing.
To leverage elastic cloud resources, scalability has to be a fundamental approach of cloud services [16]. This is particularly true in a cloud computing context, in which a virtual infrastructure may be dynamically allocated by considering both the actual conditions of the computing environment and the customers’ QoS requirements that have to be met by the service.
In the DQaS context, the service should have the means to process the DQSLA inputs and estimate the right amount of resources that should be allocated to be able to honor the service commitments specified at the DQSLA. In practice, the following inputs may vary over time: (i) execution time of an data quality algorithm execution (e1), (ii) the time restriction associated to e1 (Tres(e)), (iii) the size of the data sets that need to be monitored, and (iv) the complexity of the data quality algorithms that need to be execute by the DQaS. Hence, the amount of resources needed to honor their customers’ DQSLAs may also vary notably over time. In order to tackle the infrastructure provisioning problem, we propose the adoption of provisioning algorithms on the DQaS architecture. In practice, these algorithms may use heuristics or machine learning techniques to adjust the infrastructure over subsequent executions or estimate the infrastructure adjustments based on a training data repository that is constantly updated as the DQaS is executed over time.
Another crucial aspect of a cloud service is its ability to maximize the efficiency on the usage of the available resources while minimizing the provider bill [18].
In other words, a cloud service provider has to meet the following two main requirements: (i) guarantee that the customers’ SLA requirements are met and (ii) optimize the resource utilization in meeting the customers’ requirements.
The DQaS architecture is shown in Fig. 1.2. Initially, the client of the data quality monitoring outsourcing contract signs a contract with the DQaS provider. In practice, the contract is composed by a set of DQSLA inputs. In step 1, a client, who initially owns one or more cloud databases, submits the inputs of a DQSLA using the service interface. In step 2, the received DQSLA is then validated by theSLA Validatormodule using an XML Schema (step 3). In step 4, if the DQSLA structure and content are properly validated by the selected XML Schema, the DQSLA is stored (step 6) as a set of inputs for a data quality algorithm [16].
Then (step 7), if the DQSLA parameter Initexec is set to true, theProvisioning Planner module gathers data from the data quality algorithm (derived from the DQSLA) inputs, from the cloud database metadata, and (optionally) from a training
Fig. 1.2 Data quality-aware service architecture (Adapted from Ref. [16])
data repository in order to estimate the ideal infrastructure to be used for the execution of a data quality algorithm. After that (step 8), an execution plan (which consists of a grid configuration) is created. The execution plan specification is used by both theBusiness Modelmodule (to further aggregate customers’ bills) and the Resource Configuratormodule (to allocate a grid of virtual machines and execute the data quality algorithm in a distributed manner) [16].
After the execution of the data quality algorithm is completed (step 11 and step 12), theExecution Summarizermodule aggregates the execution data in order to populate a historical execution data repository (step 13) and also sends the summarized execution data to theProvisioning Plannermodule (step 14) to update the training data used by the service (step 15). Another possible flow (displayed by dashed lines in the DQaS architecture) of tasks performed by the DQaS is triggered when the amount of changes in a data set being currently monitored exceeds the j4Djthr parameter value specified by the client at the DQSLA [16]. When this scenario occurs (which is detected by theOnline Metadata Monitoringmodule), the Provisioning Plannercreates a new execution plan to evaluate the modified data set.
DQSLAs include client id, timestamp of the last triggered execution, and client bill regarding a specific DQSLA. To allow such queries, additional metadata must be associated to the stored DQSLAs. In this context, we identify as development challenges the following activities: (i) the development of a XML-based repository to store and retrieve DQSLAs and (ii) the identification and representation of additional metadata that need to be associated to the DQSLA general structure in order to facilitate the process of querying and retrieval of DQSLAs.
Online Metadata Monitoring For the implementation of this module, it is nec- essary to investigate and develop efficient algorithms to calculate the amount of changes that affect cloud databases as the database management system (DBMS) processes incoming transactions. Moreover, this module implementation must take into account many challenges, such as: (i) the heterogeneity of the DBMSs, (ii) the amount of processed data, and (iii) the different types of database logical schemas.
XML Schemas and DQSLA Validator In the section “Examples of Data Quality SLAs,” we provided an example of the Mrulesinputs by using specific BNF rules for defining parameters regarding both the Duplication and Completeness data quality dimensions. In order to specify further Mrules for other data quality dimensions, it is necessary to perform a survey of the state of the art regarding the catalog of data quality dimensions and create specific BNF rules regarding the parameters related to these dimensions in a DQSLA. In this context, it is also necessary to specify and develop XML Schemas that will be used by the DQaS for validating both the structure and content of customers’ input DQSLAs. Finally, it is required to develop a DQSLA Validator that is able to select dynamically an XML Schema from the repository, according to the DQdimvalue of an input customer DQSLA, and validate both the content and the structure of the input DQSLA. Using this approach, the XML Schema repository may be updated and extended over time without affecting the DQSLA Validator module.
Historical Execution Data As the DQaS executes over time, it is important to maintain a historical record of the executions of data quality algorithms. First, the output of such algorithms consists of aggregated measures concerning the quality of the monitored databases and thus may be interesting for real-time and historical analysis. Second, the results of the data quality algorithm executions, such as execution time and costs, should be easily queried for customers’ analytical
analysis. In this sense, data warehousing techniques may be used in order to model a multidimensional database that can be used to store subject-oriented, temporal, and nonvolatile data generated by the execution of data quality algorithms over time.
Penalty Model In the DQaS context, it is necessary to adopt a penalty model to calculate the amount of penalty that is inflicted to the DQaS for the cases in which the service does not meet the time restriction, specified in the DQSLA, for the execution of a data quality algorithm. For doing so, regarding a data quality algorithm executione1triggered by a DQSLA that defines a time restriction equal to Tres(e1), the DQaS penalty model must take into account (i) the difference between the execution time ofe1 and Tres(e); (ii) the predefined DQaS penalty parameters, such as the fixed penalty and the penalty rate; and (iii) the penalty function that is used to apply the penalty rate. For example, let’ be the fixed penalty and “ the penalty rate. Using a linear penalty function, one can calculate the total penalty cost as follows:’C“(ExecTime(e)Tres(e)). The related literature discusses many different approaches [23] for a penalty model. Thereby, these approaches need to be investigated and evaluated in order to conclude which penalty model is more suitable for the DQaS context. Alternatively, one can also propose and evaluate novel penalty models that are designed specifically for a DQaS.
Cost Model As stated earlier in this book chapter, one of the main goals of a service provider in the cloud computing context is to minimize the service costs (and, in turn, customers’ bill) by meeting customers’ requirements (predefined QoS) using the minimum amount of hardware infrastructure. In this context, in order to measure hardware-level infrastructure costs, it is necessary to design mathematical cost models that need to take into account the following requirements: (i) evaluation of the infrastructure costs for the execution of data quality algorithms using a cluster of virtual machines, (ii) evaluation of infrastructure costs related to the cloud maintenance, (iii) penalty costs, and (iv) aggregation of the different types of costs in order to calculate the DQaS total cost.
Charging and Profit Models The key assumption for the deployment of a DQaS is its capability of providing a cloud service whose total cost (that is aggregated from hardware, maintenance, and penalty costs) is inferior to the aggregated customer’s bill. For doing so, it is necessary to develop and evaluate charging estimation algorithms, in theBusiness Model Pricingmodule of the DQaS architecture, which are able to provide a good estimation for a customer’s bill, given (i) the customer DQSLA inputs, (ii) the estimated maintenance and infrastructure costs required to meet the expected QoS, (iii) the expected penalties over time, and (iv) the desired profit margin for the DQaS. Regarding the business model perspective of the DQaS, the charging and the profit models are particularly crucial for the service, since low- quality charging estimations may lead to losses (i.e., a charged bill that is inferior than the service total cost) or lack of competitiveness (i.e., a charged bill that is much superior than the service total cost) for the service.
Provisioning Algorithms In order to tackle the infrastructure estimation prob- lem, the DQaS architecture uses a module (Provisioning Planner) that enables
by a customer DQSLA and (ii) adjust the virtual machine infrastructure after subsequent executions of data quality algorithms triggered by the same customer DQSLA. In summary, it is expected that, for each data quality algorithm execution e, theProvisioning Plannershould allocate a virtual machine cluster that is able to approximate ExecTime(e)Tres(e). To this end, the provisioning algorithms may use or combine consolidated artificial intelligence techniques, such as heuristics and machine learning. The former technique may be used to adjust the allocated infrastructure over subsequent executions, whereas the latter may be used to provide an initial virtual infrastructure estimation for the first execution triggered by a customer DQSLA. The machine learning approach needs to use a training data repository, which is initially filled by data provided by executions of data quality algorithms in the cloud and is constantly updated as the DQaS executes over time. Thereby, the more the DQaS executes over time, the better are the virtual infrastructure estimations provided by theProvisioning Planner. Using the described training data repository, the machine learning provisioning algorithms may perform the following tasks: (i) use predefined measures to calculate the similarity between the inputs of a given execution triggered by a DQSLA and the records of the training data repository, (ii) order the records according the calculated similarities, and (iii) select the virtual machine infrastructure based on the computed similarities and a classification model.
Efficient Techniques for Data Quality Algorithms Another approach that can be used by the DQaS in order to minimize infrastructure costs (and, in turn, decrease customers’ bill as well as improve service competitiveness), specially for handling Big Data, is the adoption of efficient techniques for the data quality algorithms. This general guideline encompasses many different approaches, such as efficient distributed execution, the usage of indexing techniques, and the adoption of incremental data quality algorithms. For example, regarding the deduplication task [8], the following guidelines may be used:
• Efficient distributed execution: the DQaS must use consolidated approaches [12, 13,25,26] for the distributed execution of data quality algorithms, such as the MapReduce [27] paradigm. Besides, the service must also adopt strategies for tackling specific problems related to distributed executions, such as load unbal- ancing [8]. This problem is experienced when unbalanced tasks are distributed among the executing nodes, since the overall execution time of a data quality
algorithm will be bounded by the execution time of the last node that completes its task. In practice, this problem may happen due to data skewness or ineffective task allocations.
• Indexing techniques: the performance bottleneck in a deduplication system is usually the expensive detailed comparison of field (attribute) values between records [28], making the naive approach of comparing all pairs of records not feasible when the databases are large [8]. Moreover, the vast majority of comparisons will be between records that are not matches (i.e., true duplicated).
Thereby, a good approach to reduce the amount of required comparisons is the adoption of an indexing technique calledblocking[14]. This technique consists in dividing the database records into nonoverlapping blocks, which are generated based on the values of ablocking keyof each record, such that only the records that belong to the same block need to be compared among each other. Thus, it is important to adopt such indexing techniques to optimize the execution of the data quality algorithms in the DQaS context. The DQaS should also aid the customers to estimate parameters related to the indexing techniques, such as the blocking key of a data set and appropriate thresholds for deduplication algorithms.
• Incremental deduplication: in the Big Data era, the velocity of data updates is often high, quickly making previous linkage results obsolete [10]. This challenge calls for an incremental strategy for reprocessing the previous deduplication results when data updates arrive. In this sense, it is necessary to explore the related literature in order to incorporate such incremental techniques as part of the DQaS optimization approaches.
Evaluation of the DQaS in the Cloud Before being tested in a real-world scenario, the overall functioning of the presented DQaS architecture must be validated in a real cloud computing environment. These initial tests are crucial to validate the effectiveness of some of the key modules of the presented architecture, such as the Provisioning Plannerand theBusiness Model Pricing. The service evaluation may be initially carried out through simulation. Mathematical models and simulation environments may be developed to simulate the execution of the data quality algorithms in a cloud computing infrastructure. Such models or environments must take into account a number of factors, such as: (i) the computational complexity of the data quality algorithms, (ii) the influence of the data set size over the execution time of the algorithms, (iii) the influence of the virtual infrastructure processing capacity over the processed tasks, and (iv) the influence of external factors, such as network delays, data reading, and the load balancing problem. The results of the simulation exercise are important to provide initial insights about the effectiveness of different provisioning algorithms and opportunities for optimizations on the service, such as choosing tunable parameters for the Business Model Pricing module. After initial evaluations through simulation, further efforts are required to validate the DQaS architecture modules in a real cloud computing environment.
Ideally, these experiments must evaluate the total cost to provide this service using real workloads, i.e., composed by real data sets and data updates, and the ability of the service to perform effective adjustments of the allocated virtual infrastructure
1.5 Conclusions
In this book chapter, we explain the formalized notion of a data quality SLA that can be used to describe expectations and obligations of the both parts (customers andservice provider) involved in a data quality monitoring outsourcing contract.
We then discussed a number of challenges that encompass the development of a data quality-aware service, mainly those related to the definition of QoS in the data quality context and the dynamic allocation of virtual infrastructure to tackle: (i) customer’s QoS demands and fluctuations and (ii) Big Data processing. In order to tackle the described problems, we have discussed a high-level DQaS architecture.
Its main goal is to meet the customer’s requirements, specified as DQSLA inputs, by minimizing infrastructure costs and penalties over time.
Due to the cloud nature of the DQaS architecture, we have shown that both the deployment of such service and the development of its main modules encompass many research and technical challenges. Database practitioners, professionals, and researchers may further tackle these challenges by using existing techniques and technologies or by proposing and evaluating new approaches. Finally, the proposed evaluation of the DQaS, using a real cloud computing scenario, is expected to provide encouraging results. If so, the service may be further explored commercially as a real-world business model.
References
1. Loshin D (2010) The practitioner’s guide to data quality improvement. Elsevier, Burlington 2. Sadiq S (ed) (2013) Handbook of data quality. Springer, New York
3. Buhl HU, Röglinger M, Moser DK, Heidemann J (2013) Big data: a fashionable topic with(out) sustainable relevance for research and practice? Bus Inf Syst Eng 5(2):65–69
4. Kaisler S, Armour F, Espinosa JA, Money W (2013) Big data: issues and challenges moving forward. In: Proceedings of the 46th Hawaii international conference on system sciences (HICSS), pp 995–1004
5. Katal A, Wazid M, Goudar RH (2013) Big data: issues, challenges, tools and good practices.
In: Proceedings of the 6th international conference on contemporary computing, pp 404–409 6. Badidi E (2013) A cloud service broker for SLA-based SaaS provisioning. In: Proceedings of
the international conference on information society, pp 61–66
7. Schnjakin M, Alnemr R, Meinel C (2010) Contract-based cloud architecture. In: Proceedings of the second international workshop on cloud data management, pp 33–40
8. Christen P (2012) A survey of indexing techniques for scalable record linkage and deduplica- tion. IEEE Trans Knowl Data Eng 24(9):1537–1555
9. Bizer C, Boncz P, Brodie ML, Erling O (2012) The meaningful use of big data: four perspectives – four challenges. ACM SIGMOD Record 40(4):56–60
10. Gruenheid A, Dong XL, Srivastava D (2014) Incremental record linkage. Proc VLDB Endowment 7(9):697–708
11. Ioannou E, Rassadko N, Velegrakis Y (2013) On generating benchmark data for entity matching. J Data Semantics 2(1):37–56
12. Hsueh SC, Lin MY, Chiu YC (2014) A load-balanced mapreduce algorithm for blocking-based entity-resolution with multiple keys. In: Proceedings of the 12th Australasian symposium on parallel and distributed computing, pp 3–9
13. Mestre DG, Pires CE, Nascimento DC (2015) Adaptive sorted neighborhood blocking for entity matching with mapReduce. In: Proceedings of the 30th ACM/SIGAPP symposium on applied computing, pp 981–987
14. Baxter R, Christen P, Churches T (2003) A comparison of fast blocking methods for record linkage. ACM SIGKDD 3:25–27
15. Dillon T, Wu C, Chang E (2010) Cloud computing: issues and challenges. In: Proceedings of the 24th IEEE international conference on advanced information networking and applications, pp 27–33
16. Nascimento DC, Pires CE, Mestre D (2015) A data quality-aware cloud service based on metaheuristic and machine learning provisioning algorithms. In: Proceedings of the 30th ACM/SIGAPP symposium on applied computing, pp 1696–1703
17. Dan A, Davis D, Kearney R, Keller A, King R, Kuebler D, Youssef A (2004) Web services on demand: WSLA-driven automated management. IBM Syst J 43(1):136–158
18. Ferretti S, Ghini V, Panzieri F, Pellegrini M, Turrini E (2010) Qos–aware clouds. In:
Proceedings of the IEEE 3rd international conference on cloud computing, pp 321–328 19. Skene J, Lamanna DD, Emmerich W (2004) Precise service level agreements. In: Proceedings
of the 26th international conference on software engineering, pp 179–188
20. Batini C, Cappiello C, Francalanci C, Maurino A (2009) Methodologies for data quality assessment and improvement. ACM Comput Surv 41(3):1–52. doi:10.1145/1541880.1541883, ISSN: 0360–0300
21. Sidi F, Shariat PH, Affendey LS, Jabar MA, Ibrahim H, Mustapha A (2012) Data quality:
a survey of data quality dimensions. In: Proceedings of the international conference on information retrieval and knowledge management, pp 300–304
22. Wang RY, Strong DM (1996) Beyond accuracy: what data quality means to data consumers. J Manag Inf Syst 12(4):5–33
23. Rana OF, Warnier M, Quillinan TB, Brazier F, Cojocarasu D (2008) Managing violations in service level agreements. In: Grid middleware and services. Springer, pp 349–358.
http://link.springer.com/chapter/10.1007/978-0-387-78446-5_23
24. Reynolds MB, Hopkinson KM, Oxley ME, Mullins BE (2011) Provisioning norm: an asym- metric quality measure for SaaS resource allocation. In: Proceedings of the IEEE international conference on services computing, pp 112–119
25. Kolb L, Thor A, Rahm E (2013) Load balancing for mapreduce-based entity resolution. In:
Proceedings of the IEEE 28th international conference on data engineering, pp 618–629 26. Mestre DG, Pires CE (2013) Improving load balancing for mapreduce-based entity matching.
In: IEEE symposium on computers and communications, pp 618–624
27. Dean J, Ghemawat S (2008) MapReduce: simplified data processing on large clusters.
Commun ACM 51(1):107–113
28. Christen P, Goiser K (2007) Quality and complexity measures for data linkage and deduplica- tion. In: Quality measures in data mining. Springer, Berlin/Heidelberg
deluge of variety according into something meaningful to us, we can expect new insights and thus benefit from Big Data. This chapter demonstrates that text analysis is essential for Big Data governance. However, it must reach beyond keyword analysis. We need a design of semantic search for Big Data. This design has to include the individual nature of discovery and a strong focus on the information consumer. In short, it has to address self-directed information discovery. There are too many information discovery requests that cannot be addressed by mainstream Big Data technologies. Many requests often address less spectacular questions on a global scale but essentially important ones for individual information consumers.
We present an open discovery language (ODL) that can completely be controlled by information consumers. ODL is a Big Data technology that embraces the agile design of discovery from the information consumer’s perspective. We want users to experiment with discovery and to adapt it to their individual needs.
2.1 Introduction
Big Data promise to funnel masses of data into our information ecosystems where they let flourish a yet unseen variety of information, providing us with insights yet undreamed of. However, we have to organize and arrange this deluge of variety into something meaningful for those that expect new insights when consuming this new variety of information.
Following the actual discussion, we have to address some essential issues if we want to reap the benefits from Big Data. They result from better customer relationships, improved market insights, and better responsiveness in health care, just to name a few. To get there, we have to revamp our information strategy; we
K. Englmeier ()
Faculty of Computer Science, Schmalkalden University of Applied Science, Blechhammer 4-9, 98574 Schmalkalden, Germany
e-mail:[email protected]
© Springer International Publishing Switzerland 2015
M. Trovati et al. (eds.),Big-Data Analytics and Cloud Computing, DOI 10.1007/978-3-319-25313-8_2
21
require a data-driven mind-set; quite likely we need new personnel, a chief data officer, and, yes, Hadoop, MapReduce, and many more analytics tools. Only a powerful mix of all these ingredients prevents us from being drowned by the Big Data avalanche.
However, powerful analysis machines help us to write only half of our Big Data success stories, at most. The real challenge in Big Data is the discovery of the right data in masses of unstructured data. More than our analysis capabilities Big Data challenges our data discovery capabilities. With the vast majority of Big Data being text data, information discovery in texts gained a new momentum in Big Data research.
This chapter demonstrates that text analysis is essential for Big Data governance.
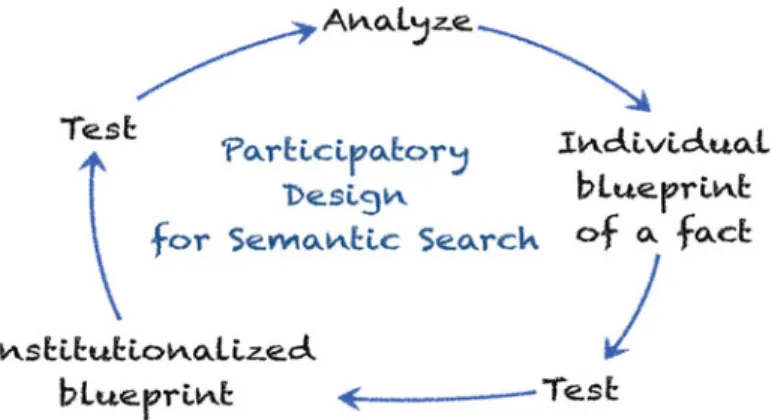
However, it must reach beyond keyword analysis. We need a design of semantic search for Big Data. This design has to include the individual nature of discovery and a strong focus on the information consumer. Hence, information demand depends on the interests of the consumers. The core element of the design is a common vocabulary that abstractly outlines the information ecosystem the respec- tive community of information consumers is dealing with. The common vocabulary enables self-service discovery by supporting semantic search that is completely controlled by the consumer. They compose blueprints of their information requests that are finally machine processable to perform automatic discovery. This article proposes a machine-processable language the information consumers can apply to manage their self-service discovery.
2.2 Big Data: Promises and Challenges
The idea behind Big Data analytics is to drill in mountains of data with powerful and sophisticated tools in hopes of unearthingnew insights. However, is capitalizing on Big Data just a matter of better machines? Can we effectively tackle the Big Data issue with better database performance, more statistical tools, enhanced data mining (DM) methods, and the like? Of course, Big Data means more data, including input from sensors. The cell phone produces position data. Location-aware browsers and apps log when and where you state a query or use certain features. Smart watches monitor your heart rate and your pulse, among other things. These examples demonstrate that there are in fact new interesting data to digest for analytic tools. It is probably the advent of these sensor data that makes us believe that capitalizing on Big Data is tantamount to enhanced and enriched number of crunching capabilities.
Besides some new types of data, there is not so much new in Big Data analysis.
DM and information retrieval (IR) models and methods are applied to a new variety of data. DM and IR can produce, in fact, interesting and valuable information. It is certainly reasonable to apply well-established and acknowledged methods from artificial intelligence (AI). The recurring theme in Big Data is correlation. The correlation of the phone’s position data with the use of special keywords revealing that we might suffer a flu or the like can indicate where and how fast a disease
any further the broad variety of causes as long as correlations indicate new and spectacular insights. A further example is the prognosis of the spread of a flu epidemic based on tweets combined with their authors’ position data. Here, Big Data analysis pretended to detect velocity and directions of the spread by identifying flu- related keywords in tweets that were linked with the location where the users posted these tweets. Later, the results of this analysis were shown to be somewhat far from reality [7]. In the first place, the two examples demonstrate thethreats of Big Data if we trust too much in the authority of the analytic tools and neglect a thorough analysis of the causes that produced the phenomena appearing in the correlations.
This may lead to severely false conclusions when we take the produced phenomena as facts too fast. The two examples also demonstrate that a close involvement of humans is indispensable if we want a sustainable success in Big Data that reaches beyond making some money based on hype.
Big Data stories tell about new insights that result from the application of analytic algorithms on data available in databases or made available in databases by tools like MapReduce. Data analysis, in particular high-volume analysis, depends on suitable abstract data descriptions, this means, on machine-processable data schemata. The correct identification of the nature of data is essential for successful analytics. A database schema clearly indicates this nature, and it clearly marks sales figures, zip codes, locations, and the like as such. For decades, we shovel these data from all kind of applications (e-commerce, CRM, etc.) into our databases. These applications make sure we get all these data in SQL compatible format. Today, we have, in addition, Big Data tools like Hadoop that help us to extract some SQL incompatible data, mainly from sensor data, and convert them into digestible bites for our databases. This in turn means even the most sophisticated analytic tool does not help much if we cannot feed it with suitably formatted data. There are no insights without suitably structured data.
2.3 Participatory Design for Big Data
Big Data analysis resembles much that we already know from AI since decades, in particular from DM and IR. Correlations in data may stand for relationships between facts pointing to a phenomenon. If I’m using keywords related to a certain
disease, I’m suffering from this disease and require appropriate treatment. We see immediately that the observed phenomenon is first of all an assumption about both the person and the illness. And these assumptions can be wrong. I may look up this information for somebody else, for instance. The combination of keywords may also stand for a completely different phenomenon.
The foundation of these assumptions is the analysis models. However, the verification of these models is barely part of model design. Usually, these models emerge from statistical methods, from factor or time series analysis, or are based on hidden Markov models, to name the most prominent areas. As long as they detect a critical mass of correlations, the problem of false positives does not gain sufficient momentum.
“We need to avoid the temptation of following a data-driven approach instead of a problem-driven one” [5]. Information consumers can usually sketch their information demand that summarizes the data they need to solve their information problem. They have a deep understanding of the foundations of their domain.
Thus, we need a stronger involvement of humans in the value chain of Big Data analysis. Sustainable success in Big Data, however, requires more than just controlling the results produced by Big Data analytics. The integration of more competence, in particular domain competence, means a more active role of the human actor in all stages of the value chain. This kind of user engagement goes beyond user requirement analysis, participatory design, and acceptance testing during the development of Big Data analytic systems. It means a more active role of the information consumers enabled by self-service features. This kind of self- service IT may point to user-friendly versions of analytic tools, enabling information consumers to conduct their own analytics. This smooth integration of domain and tool knowledge completes the picture of self-service discovery that meanwhile is also demanded by the industry [12]. There is no doubt that without proper technological and methodological support, the benefits of Big Data are out of reach.
Design for Big Data, however, requires an engagement of information consumers.
When their needs drive design, Big Data will provide the insights they require.
It is too often the case that technology as required and described by the users is not quite well understood by designers. There are several ways of human-centered design to overcome this lack of mutual understanding. There is user-centered design where users are employed to test and verify the usability of the system.Participatory design[11] makes available this form of user engagement; it understands users as part of the design team.
An organization’s information ecosystem usually hosts databases, content man- agement systems, analytic tools, master data management systems, and the like that produce the flavor of information specific to this organization. Furthermore, there are communication tools, CRM and BPM systems, that feed the ecosystem with data, too. When we talk about information systems, we mainly mean systems and the data they manage. The users see these systems as different data ch
![Fig. 1.2 Data quality-aware service architecture (Adapted from Ref. [16])](https://thumb-ap.123doks.com/thumbv2/123dok/11806539.0/30.659.83.574.92.566/fig-data-quality-aware-service-architecture-adapted-ref.webp)