Borko Furht · Flavio Villanustre
Big Data
Technologies
and
Big Data Technologies
and Applications
Borko Furht
Department of Computer and Electrical Engineering and Computer Science Florida Atlantic University
Boca Raton, FL USA
Flavio Villanustre LexisNexis Risk Solutions Alpharetta, GA
USA
ISBN 978-3-319-44548-9 ISBN 978-3-319-44550-2 (eBook) DOI 10.1007/978-3-319-44550-2
Library of Congress Control Number: 2016948809
©Springer International Publishing Switzerland 2016
This work is subject to copyright. All rights are reserved by the Publisher, whether the whole or part of the material is concerned, specifically the rights of translation, reprinting, reuse of illustrations, recitation, broadcasting, reproduction on microfilms or in any other physical way, and transmission or information storage and retrieval, electronic adaptation, computer software, or by similar or dissimilar methodology now known or hereafter developed.
The use of general descriptive names, registered names, trademarks, service marks, etc. in this publication does not imply, even in the absence of a specific statement, that such names are exempt from the relevant protective laws and regulations and therefore free for general use.
The publisher, the authors and the editors are safe to assume that the advice and information in this book are believed to be true and accurate at the date of publication. Neither the publisher nor the authors or the editors give a warranty, express or implied, with respect to the material contained herein or for any errors or omissions that may have been made.
Printed on acid-free paper
This Springer imprint is published by Springer Nature The registered company is Springer International Publishing AG
The scope of this book includes leading edge in big data systems, architectures, and applications. Big data computing refers to capturing, managing, analyzing, and understanding the data at volumes and rates that push the frontiers of current technologies. The challenge of big data computing is to provide the hardware architectures and related software systems and techniques which are capable of transforming ultra large data into valuable knowledge. Big data and data-intensive computing demand a fundamentally different set of principles than mainstream computing. Big data applications typically are well suited for large-scale parallelism over the data and also require extremely high degree of fault tolerance, reliability, and availability. In addition, most big data applications require relatively fast response. The objective of this book is to introduce the basic concepts of big data computing and then to describe the total solution to big data problems developed by LexisNexis Risk Solutions.
This book comprises of three parts, which consists of 15 chapters. Part I onBig Data Technologies includes the chapters dealing with introduction to big data concepts and techniques, big data analytics and relating platforms, and visualization techniques and deep learning techniques for big data. Part II on LexisNexis Risk Solution to Big Datafocuses on specific technologies and techniques developed at LexisNexis to solve critical problems that use big data analytics. It covers the open source high performance computing cluster (HPCC Systems®) platform and its architecture, as well as, parallel data languages ECL and KEL, developed to effectively solve big data problems. Part III on Big Data Applications describes various data-intensive applications solved on HPCC Systems. It includes applica-tions such as cyber security, social network analytics, including insurance fraud, fraud in prescription drugs, and fraud in Medicaid, and others. Other HPCC Systems applications described include Ebola spread modeling using big data analytics and unsupervised learning and image classification.
With the dramatic growth of data-intensive computing and systems and big data analytics, this book can be the definitive resource for persons working in thisfield as researchers, scientists, programmers, engineers, and users. This book is intended for a wide variety of people including academicians, designers, developers,
educators, engineers, practitioners, and researchers and graduate students. This book can also be beneficial for business managers, entrepreneurs, and investors.
The main features of this book can be summarized as follows:
1. This book describes and evaluates the current state of the art in thefield of big data and data-intensive computing.
2. This book focuses on LexisNexis’platform and its solutions to big data. 3. This book describes the real-life solutions to big data analytics.
Boca Raton, FL, USA Borko Furht
Alpharetta, GA, USA Flavio Villanustre 2016
We would like to thank a number of contributors to this book. The LexisNexis contributors include David Bayliss, Gavin Halliday, Anthony M. Middleton, Edin Muharemagic, Jesse Shaw, Bob Foreman, Arjuna Chala, and Flavio Villanustre. The Florida Atlantic University contributors include Ankur Agarwal, Taghi Khoshgoftaar, DingDing Wang, Maryam M. Najafabadi, Abhishek Jain, Karl Weiss, Naeem Seliva, Randal Wald, and Borko Furht. The other contributors include I. Itauma, M.S. Aslan, and X.W Chen from Wayne State University; Chun-Wei Tsai, Chin-Feng Lai, Han-Chieh Chao, and Athanasios V. Vasilakos from Lulea University of Technology in Sweden; and Akaterina Olshannikova, Aleksandr Ometov, Yevgeni Koucheryavy, and Thomas Olsson from Tampere University of Technology in Finland.
Without their expertise and effort, this book would never come to fruition. Springer editors and staffs also deserve our sincere recognition for their support throughout the project.
Contents
Part I Big Data Technologies
1 Introduction to Big Data. . . 3
Borko Furht and Flavio Villanustre Concept of Big Data . . . 3
Big Data Workflow . . . 4
Big Data Technologies . . . 5
Big Data Layered Architecture . . . 5
Big Data Software . . . 6
Splunk . . . 6
LexisNexis’High-Performance Computer Cluster (HPCC). . . . 6
Big Data Analytics Techniques . . . 7
Clustering Algorithms for Big Data . . . 8
Big Data Growth . . . 9
Big Data Industries. . . 9
Challenges and Opportunities with Big Data . . . 10
References. . . 11
2 Big Data Analytics . . . 13
Chun-Wei Tsai, Chin-Feng Lai, Han-Chieh Chao and Athanasios V. Vasilakos Introduction . . . 14
Data Analytics . . . 16
Data Input . . . 17
Data Analysis . . . 17
Output the Result . . . 19
Summary. . . 22
Big Data Analytics . . . 24
Big Data Input . . . 25
Big Data Analysis Frameworks and Platforms . . . 26
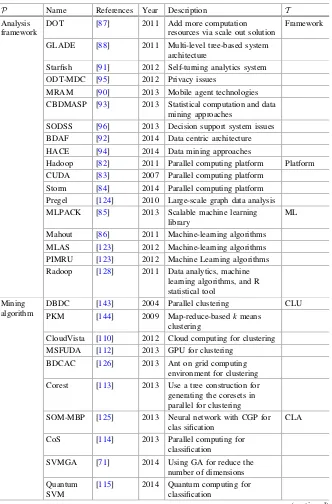
Researches in Frameworks and Platforms . . . 27
Comparison Between the Frameworks/Platforms of Big Data . . . 30
Big Data Analysis Algorithms . . . 31
Mining Algorithms for Specific Problem . . . 31
Machine Learning for Big Data Mining. . . 33
Output the Result of Big Data Analysis. . . 36
Summary of Process of Big Data Analytics . . . 37
The Open Issues. . . 40
Platform and Framework Perspective . . . 40
Input and Output Ratio of Platform . . . 40
Communication Between Systems . . . 40
Bottlenecks on Data Analytics System . . . 41
Security Issues . . . 41
Data Mining Perspective . . . 42
Data Mining Algorithm for Map-Reduce Solution . . . 42
Noise, Outliers, Incomplete and Inconsistent Data . . . 42
Bottlenecks on Data Mining Algorithm . . . 43
Privacy Issues . . . 43
Conclusions . . . 44
References. . . 45
3 Transfer Learning Techniques. . . 53
Karl Weiss, Taghi M. Khoshgoftaar and DingDing Wang Introduction . . . 53
Definitions of Transfer Learning. . . 55
Homogeneous Transfer Learning . . . 59
Instance-Based Transfer Learning . . . 60
Asymmetric Feature-Based Transfer Learning . . . 61
Symmetric Feature-Based Transfer Learning . . . 64
Parameter-Based Transfer Learning. . . 68
Relational-Based Transfer Learning . . . 70
Hybrid-Based (Instance and Parameter) Transfer Learning . . . 71
Discussion of Homogeneous Transfer Learning . . . 72
Heterogeneous Transfer Learning . . . 73
Symmetric Feature-Based Transfer Learning . . . 74
Asymmetric Feature-Based Transfer Learning . . . 79
Improvements to Heterogeneous Solutions. . . 82
Experiment Results. . . 83
Discussion of Heterogeneous Solutions . . . 83
Negative Transfer . . . 85
Transfer Learning Applications . . . 88
Conclusion and Discussion . . . 90
Appendix . . . 92
4 Visualizing Big Data. . . 101
Ekaterina Olshannikova, Aleksandr Ometov, Yevgeni Koucheryavy and Thomas Olsson Introduction . . . 101
Big Data: An Overview . . . 103
Big Data Processing Methods . . . 104
Big Data Challenges . . . 107
Visualization Methods. . . 109
Integration with Augmented and Virtual Reality . . . 119
Future Research Agenda and Data Visualization Challenges . . . 121
Conclusion . . . 123
References. . . 124
5 Deep Learning Techniques in Big Data Analytics. . . 133
Maryam M. Najafabadi, Flavio Villanustre, Taghi M. Khoshgoftaar, Naeem Seliya, Randall Wald and Edin Muharemagc Introduction . . . 133
Deep Learning in Data Mining and Machine Learning . . . 136
Big Data Analytics . . . 138
Applications of Deep Learning in Big Data Analytics . . . 140
Semantic Indexing . . . 141
Discriminative Tasks and Semantic Tagging . . . 144
Deep Learning Challenges in Big Data Analytics . . . 147
Incremental Learning for Non-stationary Data . . . 147
High-Dimensional Data. . . 148
Large-Scale Models . . . 149
Future Work on Deep Learning in Big Data Analytics . . . 150
Conclusion . . . 152
References. . . 153
Part II LexisNexis Risk Solution to Big Data 6 The HPCC/ECL Platform for Big Data. . . 159
Anthony M. Middleton, David Alan Bayliss, Gavin Halliday, Arjuna Chala and Borko Furht Introduction . . . 159
Data-Intensive Computing Applications. . . 160
Data-Parallelism . . . 161
The“Big Data”Problem . . . . 161
Data-Intensive Computing Platforms . . . 162
Cluster Configurations . . . 162
Common Platform Characteristics. . . 163
HPCC Platform . . . 164
HPCC System Architecture . . . 164
HPCC Thor System Cluster . . . 167
HPCC Roxie System Cluster . . . 169
ECL Programming Language . . . 170
ECL Features and Capabilities . . . 171
ECL Compilation, Optimization, and Execution . . . 173
ECL Development Tools and User Interfaces. . . 177
ECL Advantages and Key Benefits. . . 177
HPCC High Reliability and High Availability Features . . . 179
Conclusion . . . 180
References. . . 182
7 Scalable Automated Linking Technology for Big Data Computing. . . 185
Anthony M. Middleton, David Bayliss and Bob Foreman Introduction . . . 185
SALT—Basic Concepts . . . . 186
SALT Process . . . 187
Specification File Language. . . 188
SALT—Applications . . . . 195
Data Profiling . . . 196
Data Hygiene. . . 199
Data Source Consistency Checking. . . 201
Delta File Comparison . . . 202
Data Ingest . . . 202
Record Linkage—Process . . . . 205
Record Matching Field Weight Computation . . . 206
Generating Specificities. . . 208
Internal Linking . . . 209
External Linking . . . 213
Base File Searching . . . 218
Remote Linking . . . 219
Attribute Files . . . 220
Summary and Conclusions . . . 220
References. . . 222
8 Aggregated Data Analysis in HPCC Systems . . . 225
David Bayliss Introduction . . . 225
The RDBMS Paradigm . . . 226
The Reality of SQL . . . 227
Normalizing an Abnormal World . . . 228
A Data Centric Approach . . . 230
Data Analysis . . . 232
Case Study: Fuzzy Matching . . . 233
Case Study: Non-obvious Relationship Discovery. . . 234
9 Models for Big Data. . . 237
David Bayliss Structures Data. . . 237
Text (and HTML) . . . 241
Semi-structures Data . . . 242
Bridging the Gap—The Key-Value Pair . . . . 243
XML—Structured Text . . . . 244
RDF . . . 246
Data Model Summary . . . 247
Data Abstraction—An Alternative Approach . . . . 247
Structured Data . . . 248
Text . . . 249
Semi-structured Data. . . 249
Key-Value Pairs . . . 250
XML . . . 251
RDF . . . 252
Model Flexibility in Practice . . . 253
Conclusion . . . 255
10 Data Intensive Supercomputing Solutions. . . 257
Anthony M. Middleton Introduction . . . 257
Data-Intensive Computing Applications. . . 259
Data-Parallelism . . . 260
The“Data Gap”. . . . 260
Characteristics of Data-Intensive Computing Systems . . . 261
Processing Approach . . . 262
Common Characteristics . . . 263
Grid Computing . . . 264
Data-Intensive System Architectures . . . 265
Google MapReduce . . . 265
Hadoop . . . 269
LexisNexis HPCC . . . 273
Programming Language ECL . . . 279
Hadoop Versus HPCC Comparison . . . 282
Terabyte Sort Benchmark . . . 283
Pig Versus ECL . . . 285
Architecture Comparison . . . 287
Conclusion . . . 303
References. . . 305
11 Graph Processing with Massive Datasets: A Kel Primer. . . 307
David Bayliss and Flavio Villanustre Introduction . . . 307
Motivation. . . 308
Background . . . 309
The Open Source HPCC Systems Platform Architecture . . . 309
KEL—Knowledge Engineering Language for Graph Problems. . . . 309
KEL—A Primer . . . . 310
Proposed Solution . . . 313
Data Primitives with Graph Primitive Extensions . . . 313
Generated Code and Graph Libraries . . . 315
KEL Compiler . . . 316
KEL Language—Principles . . . . 316
KEL Language—Syntax . . . . 318
KEL—The Summary . . . . 323
KEL Present and Future . . . 328
References. . . 328
Part III Big Data Applications 12 HPCC Systems for Cyber Security Analytics . . . 331
Flavio Villanustre and Mauricio Renzi The Advanced Persistent Threat . . . 332
LexisNexis HPPS Systems for Deep Forensic Analysis . . . 335
Pre-computed Analytics for Cyber Security . . . 335
The Benefits of Pre-computed Analytics . . . 337
Deep Forensics Analysis . . . 338
Conclusion . . . 339
13 Social Network Analytics: Hidden and Complex Fraud Schemes. . . 341
Flavio Villanustre and Borko Furht Introduction . . . 341
Case Study: Insurance Fraud . . . 341
Case Study: Fraud in Prescription Drugs . . . 341
Case Study: Fraud in Medicaid . . . 342
Case Study: Network Traffic Analysis. . . 343
Case Study: Property Transaction Risk . . . 346
14 Modeling Ebola Spread and Using HPCC/KEL System . . . 347
Jesse Shaw, Flavio Villanustre, Borko Furht, Ankur Agarwal and Abhishek Jain Introduction . . . 347
Survey of Ebola Modeling Techniques . . . 349
Basic Reproduction Number (R0) . . . 349
Case Fatality Rate (CFR) . . . 350
SIR Model . . . 351
Improved SIR (ISIR) Model . . . 352
SIS Model. . . 353
Agent-Based Model . . . 355
A Contact Tracing Model . . . 357
Spatiotemporal Spread of 2014 Outbreak of Ebola Virus Disease . . . 360
Quarantine Model . . . 361
Global Epidemic and Mobility Model . . . 362
Other Critical Issues in Ebola Study . . . 364
Delays in Outbreak Detection . . . 364
Lack of Public Health Infrastructure . . . 365
Health Worker Infections . . . 366
Misinformation Propagation in Social Media . . . 367
Risk Score Approach in Modeling and Predicting Ebola Spread . . . 368
Beyond Compartmental Modeling . . . 368
Physical and Social Graphs . . . 369
Graph Knowledge Extraction . . . 369
Graph Propagation . . . 370
Mobile Applications Related to Ebola Virus Disease. . . 373
ITU Ebola—Info—Sharing . . . . 373
Ebola Prevention App. . . 373
Ebola Guidelines . . . 373
About Ebola . . . 374
Stop Ebola WHO Official . . . 374
HealthMap . . . 374
#ISurvivedEbola. . . 374
Ebola Report Center . . . 374
What is Ebola . . . 375
Ebola . . . 375
Stop Ebola . . . 375
Virus Tracker . . . 375
Ebola Virus News Alert . . . 376
Sierra Leone Ebola Trends . . . 376
The Virus Ebola. . . 376
MSF Guidance. . . 376
Novarum Reader . . . 376
Work Done by Government. . . 378
Innovative Mobile Application for Ebola Spread . . . 378
Registering a New User . . . 379
Login the Application . . . 380
Basic Information. . . 380
Geofencing . . . 380
Web Service Through ECL . . . 382
Conclusion . . . 383
References. . . 384
15 Unsupervised Learning and Image Classification
in High Performance Computing Cluster. . . 387
I. Itauma, M.S. Aslan, X.W. Chen and Flavio Villanustre Introduction . . . 387
Background and Advantages of HPCC SystemsR. . . 388
Contributions . . . 389
Methods . . . 390
Image Reading in HPCC Systems Platform . . . 390
Feature Learning . . . 391
Feature Extraction . . . 393
Classification . . . 393
Experiments and Results . . . 393
Discussion. . . 398
Conclusion . . . 398
About the Authors
Borko Furht is a professor in the Department of Electrical and Computer Engineering and Computer Science at Florida Atlantic University (FAU) in Boca Raton, Florida. He is also the director of the NSF Industry/University Cooperative Research Center for Advanced Knowledge Enablement. Before joining FAU, he was a vice president of research and a senior director of development at Modcomp (Ft. Lauderdale), a computer company of Daimler Benz, Germany; a professor at University of Miami in Coral Gables, Florida; and a senior researcher in the Institute Boris Kidric-Vinca, Yugoslavia. Professor Furht received his Ph.D. degree in electrical and computer engineering from the University of Belgrade. His current research is in multimedia systems, multimedia big data and its applications, 3-D video and image systems, wireless multimedia, and Internet and cloud computing. He is presently the Principal Investigator and Co-PI of several projects sponsored by NSF and various high-tech companies. He is the author of numerous books and articles in the areas of multimedia, data-intensive applications, computer architecture, real-time computing, and operating systems. He is a founder and an editor-in-chief of two journals: Journal of Big Data and Journal of Multimedia Tools and Applications. He has received several technical and pub-lishing awards and has been a consultant for many high-tech companies including IBM, Hewlett-Packard, Adobe, Xerox, General Electric, JPL, NASA, Honeywell, and RCA. He has also served as a consultant to various colleges and universities. He has given many invited talks, keynote lectures, seminars, and tutorials. He served on the board of directors of several high-tech companies.
Dr. Flavio Villanustre leads HPCC Systems® and is also VP, Technology for LexisNexis Risk Solutions®. In this position, he is responsible for information and physical security, overall platform strategy, and new product development. He is also involved in a number of projects involving Big Data integration, analytics, and
Introduction to Big Data
Borko Furht and Flavio Villanustre
Concept of Big Data
In this chapter we present the basic terms and concepts in Big Data computing. Big data is a large and complex collection of data sets, which is difficult to process using on-hand database management tools and traditional data processing applications. Big Data topics include the following activities:
• Capture • Storage • Search • Sharing • Transfer • Analysis • Visualization
Big Data can be also defined using three Vs: Volume, Velocity, and Variety.
Volume refers to size of the data from Terabytes (TB) to Petabytes (PB), and
related big data structures including records, transactions, files, and tables. Data volumes are expected to grow 50 times by 2020.
Velocityrefers to ways of transferring big data including batch, near time, real
time, and streams. Velocity also includes time and latency characteristics of data handling. The data can be analyzed, processed, stored, and managed in a fast rate, or with a lag time between events.
Variety of big data refers to different formats of data including structured,
unstructured, semi-structured data, and the combination of these. The data format can be in the forms of documents, emails, text messages, audio, images, video, graphics data, and others.
In addition to these three main characteristics of big data, there are two addi-tional features: Value, and Veracity [1]. Value refers to benefits/value obtained by the user from the big data. Veracity refers to the quality of big data.
©Springer International Publishing Switzerland 2016
B. Furht and F. Villanustre,Big Data Technologies and Applications, DOI 10.1007/978-3-319-44550-2_1
Sources of big data can be classified to: (1) various transactions, (2) enterprise data, (3) public data, (4) social media, and (5) sensor data. Table1.1illustrates the difference between traditional data and big data.
Big Data Work
fl
ow
Big data workflow consists of the following steps, as illustrated in Fig.1.1. These steps are defined as:
Collection—Structured, unstructured and semi-structured data from multiple
sources
Ingestion—loading vast amounts of data onto a single data store
Discovery and Cleansing—understanding format and content; clean up and
formatting
Integration—linking, entity extraction, entity resolution, indexing and data fusion
Analysis—Intelligence, statistics, predictive and text analytics, machine learning
Delivery—querying, visualization, real time delivery on enterprise-class
availability
Table 1.1 Comparison between traditional and big data (adopted from [2])
Traditional data Big data
Volume In GBs TBs and PBs
Data generation rate Per hour; per day More rapid
Data structure Structured Semi-structured or Unstructured Data source Centralized Fully distributed
Data integration Easy Difficult
Data store RDBMS HDFS, NoSQL
Data access Interactive Batch or near real-time
Fig. 1.1 Big data workflow
Big Data Technologies
Big Data technologies is a new generation of technologies and architectures designed to economically extract value from very large volumes of a wide variety of data by enabling high-velocity capture, discovery, and analysis. Big Data technologies include:
• Massively Parallel Processing (MPP) • Data mining tools and techniques • Distributedfile systems and databases • Cloud computing platforms
• Scalable storage systems
Big Data Layered Architecture
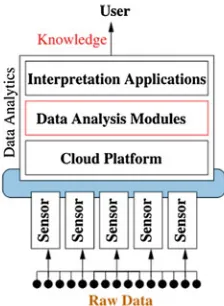
As proposed in [2], the big data system can be represented using a layered archi-tecture, as shown in Fig.1.2. The big data layered architecture consists of three levels: (1) infrastructure layer, (2) computing layer, and (3) application layer.
The infrastructure layer consists of a pool of computing and storage resources including cloud computer infrastructure. They must meet the big data demand in terms of maximizing system utilization and storage requirements.
The computing layer is a middleware layer and includes various big data tools for data integration, data management, and the programming model.
The application layer provides interfaces by the programming models to implement various data analysis functions including statistical analyses, clustering, classification, data mining, and others and build various big data applications.
Big Data Software
Hadoop (Apache Foundation)
Hadoop is open source software framework for storage and large scale data pro-cessing on clusters computers. It is used for propro-cessing, storing and analyzing large amount of distributed unstructured data Hadoop consists of two components: HDFS, distributive file system, and Map Reduce, which is programming frame-work. In Map Reduce programming component large task is divided into two phases: Map and Reduce, as shown in Fig.1.3. The Map phase divides the large task into smaller pieces and dispatches each small piece onto one active node in the cluster. The Reduce phase collects the results from the Map phase and processes the results to get thefinal result. More details can be found in [3].
Splunk
Captures, indexes and correlates real-time data in a searchable repository from which it can generate graphs, reports, alerts, dashboards and visualizations.
LexisNexis
’
High-Performance Computer Cluster (HPCC)
HPCC system and software are developed by LexisNexis Risk Solutions. A software architecture, shown in Fig.1.4, implemented on computing clusters
Map Map Map Map
Storage
Synchronization: Aggregate intermediate results
Reduce Reduce Reduce
Final Results
Fig. 1.3 MapReduce framework
provides data parallel processing for applications with Big Data. Includes a data-centric programming language for parallel data processing—ECL. The part II of the book is focused on details of the HPCC system and Part III describes various HPCC applications.
Big Data Analytics Techniques
We classify big data analytics in the followingfive categories [4]:
• Text analytics • Audio analytics • Video analytics • Social media analytics • Predictive analytics.
Text analytics or text miningrefers to the process of analyzing unstructured
text to extract relevant information. Text analytics techniques use statistical anal-ysis, computational linguistics, and machine learning. Typical applications include extracting textual information from social network feeds, emails, blogs, online forums, survey responses, and news.
Audio analytics or speech analytic techniquesare used to analyze and extract
information from unstructured audio data. Typical applications of audio analytics are customer call centers and healthcare companies.
Video analytics or video content analysisdeals with analyzing and extracting
meaningful information from video streams. Video analytics can be used in various video surveillance applications.
Social media analyticsincludes the analysis of structured and unstructured data
from various social media sources including Facebook, Linkedin, Twitter, YouTube, Instagram, Wikipedia, and others.
Predictive analytics includes techniques for predicting future outcomes based on past and current data. The popular predictive analytic techniques include NNs, SVMs, decision trees, linear and logistic regression, association rules, and scorecards.
More details about big data analytics techniques can be found in [2,4] as well as in the chapter in this book on“Big Data Analytics.”
Clustering Algorithms for Big Data
Clustering algorithms are developed to analyze large volume of data with the main objective to categorize data into clusters based on the specific metrics. An excellent survey of clustering algorithms for big data is presented in [5]. The authors pro-posed the categorization of the clustering algorithms into the following five categories:
• Partitioning-based algorithms • Hierarchical-based algorithms • Density-based algorithms • Grid-based algorithms, and • Model-based clustering algorithms.
The clustering algorithms were evaluated for big data applications with respect to three Vs defied earlier and the results of evaluation are given in [5] and the authors proposed the candidate clustering algorithms for big data that meet the criteria relating to three V.
In the case of clustering algorithms, Volume refers to the ability of a clustering algorithm to deal with a large amount of data. Variety refers to the ability of a clustering algorithm to handle different types of data, and Velocity refers to the speed of a clustering algorithm on big data. In [5] the authors selected the following five clustering algorithms as the most appropriate for big data:
• Fuzzy-CMeans (FCM) clustering algorithm • The BIRCH clustering algorithm
• The DENCLUE clustering algorithm
• Optimal Grid (OPTIGRID) clustering algorithm, and • Expectation-Maximization (EM) clustering algorithm.
Authors also performed experimental evaluation of these algorithms on real data [5].
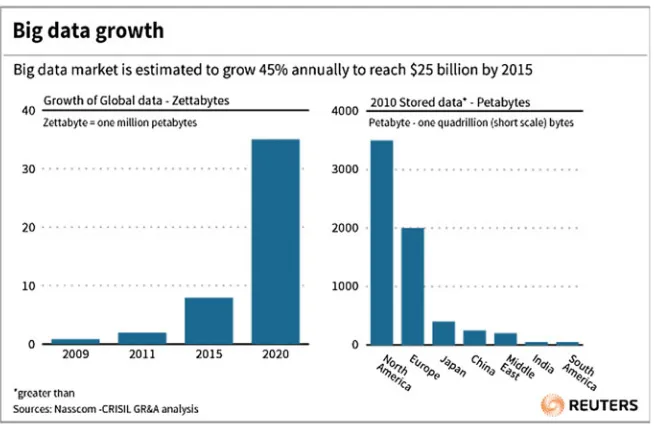
Big Data Growth
Figure1.5shows the forecast in big data growth by Reuter (2012) that today there are less than 10 zettabytes of data. They estimate that by 2020 there will be more than 30 Zettabyte of data, with the big data market growth of 45 % annually.
Big Data Industries
Media and entertainment applications include digital recording, production, and media delivery. Also, it includes collection of large amounts of rich content and user viewing behaviors.
Healthcare applications include electronic medical records and images, public health monitoring programs, and long-term epidemiological research programs.
Life science applications include low-cost gene sequencing that generates tens of terabytes of information that must be analyzed for genetic variations.
Video surveillance applications include big data analysis received from cameras and recording systems.
Applications in transportation, logistics, retails, utilities and telecommunications include sensor data generated from GPS transceivers, RFID tag readers, smart
meters, and cell phones. Data is analyzed and used to optimize operations and drive operational business intelligence.
Challenges and Opportunities with Big Data
In 2012, a group of prominent researchers from leading US universities including UC Santa Barbara, UC Berkeley, MIT, Cornell University, University of Michigan, Columbia University, Stanford University and a few others, as well as researchers from leading companies including Microsoft, HP, Google, IBM, and Yahoo!, created a white paper on this topic [6]. Here we present some conclusions from this paper.
One of the conclusions is that Big Data has the potential to revolutionize research; however it has also potential to revolutionize education. The prediction is that big database of every student’s academic performance can be created and this data can be then used to design the most effective approaches to education, starting from reading, writing, and math, to advanced college-level courses [6].
The analysis of big data consists of various phases as shown in Fig.1.6, and each phase introduces challenges, which are discussed in detail in [6]. Here we summarize the main challenges.
In the Data Acquisition and Recording phase the main challenge is to select data filters, which will extract the useful data. Another challenge is to automatically generate the right metadata to describe what data is recorded and measured.
In the Information Extraction and Clustering phase the main challenge is to convert the original data in a structured form, which is suitable for analysis.
Fig. 1.6 The big data analysis pipeline [6]
Methods for querying and mining Big Data are fundamentally different from traditional statistical analysis on small data samples. The characteristics of Big Data is that it is often noisy, dynamic, heterogeneous, inter-related, and untrustworthy. These is another challenge.
The interpretation of the obtained results from big data analysis is another challenge. Usually, the interpretation involves examining all the assumptions made and retracting the analysis.
References
1. Sharma S, Mangat V. Technology and trends to handle big data: a survey. In: 2015fifth international conference on advanced computing and communication technologies. p. 266–71.
2. Hu H, Wen Y, Chua T-S, Li X. Toward scalable systems for big data analytics: a technology tutorial. IEEE Access. 2014;2(14):652–87.
3. Menon SP, Hegde NP. A survey of tools and applications in big data. In: IEEE 9th international conference on intelligence systems and control; 2015. p. 1–7.
4. Vashisht P, Gupta V. Big data analytics: a survey. In: 2015 international conference on green computing and internet of things; 2015.
5. Fahad A, et al. A survey of clustering algorithms for big data: taxonomy and empirical analysis. IEEE Trans Emerg Top Comput. 2014;2(3):267–79.
6. Challenges and opportunities with big data. White paper; 2012.
Chapter 2
Big Data Analytics
Chun-Wei Tsai, Chin-Feng Lai, Han-Chieh Chao and Athanasios V. Vasilakos
Abbreviations
PCA Principal components analysis 3Vs Volume, velocity, and variety IDC International Data Corporation KDD Knowledge discovery in databases SVM Support vector machine
SSE Sum of squared errors
GLADE Generalized linear aggregates distributed engine BDAF Big data architecture framework
CBDMASP Cloud-based big data mining and analyzing services platform SODSS Service-oriented decision support system
HPCC High performance computing cluster system BI&I Business intelligence and analytics
DBMS Database management system MSF Multiple speciesflocking GA Genetic algorithm SOM Self-organizing map MBP Multiple back-propagation YCSB Yahoo cloud serving benchmark HPC High performance computing EEG Electroencephalography
This chapter has been adopted from the Journal of Big Data, Borko Furht and Taghi Khoshgoftaar, Editors-in-Chief. Springer, Vol. 2, No. 21, October 2015.
©Springer International Publishing Switzerland 2016
B. Furht and F. Villanustre,Big Data Technologies and Applications, DOI 10.1007/978-3-319-44550-2_2
Introduction
As the information technology spreads fast, most of the data were born digital as well as exchanged on internet today. According to the estimation of Lyman and Varian [1], the new data stored in digital media devices have already been more than 92 % in 2002, while the size of these new data was also more than five exabytes. In fact, the problems of analyzing the large scale data were not suddenly occurred but have been there for several years because the creation of data is usually much easier thanfinding useful things from the data. Even though computer systems today are much faster than those in the 1930s, the large scale data is a strain to analyze by the computers we have today.
In response to the problems of analyzing large-scale data, quite a few efficient methods [2], such as sampling, data condensation, density-based approaches, grid-based approaches, divide and conquer, incremental learning, and distributed computing, have been presented. Of course, these methods are constantly used to improve the performance of the operators of data analytics process.1The results of these methods illustrate that with the efficient methods at hand, we may be able to analyze the large-scale data in a reasonable time. The dimensional reduction method (e.g., principal components analysis; PCA [3]) is a typical example that is aimed at reducing the input data volume to accelerate the process of data analytics. Another reduction method that reduces the data computations of data clustering is sampling [4], which can also be used to speed up the computation time of data analytics.
Although the advances of computer systems and internet technologies have witnessed the development of computing hardware following the Moore’s law for several decades, the problems of handling the large-scale data still exist when we are entering the age of big data. That is why Fisher et al. [5] pointed out that big data means that the data is unable to be handled and processed by most current information systems or methods because data in the big data era will not only become too big to be loaded into a single machine, it also implies that most traditional data mining methods or data analytics developed for a centralized data analysis process may not be able to be applied directly to big data. In addition to the issues of data size, Laney [6] presented a well-known definition (also called 3Vs) to explain what is the“big”data: volume, velocity, and variety. The definition of 3Vs implies that the data size is large, the data will be created rapidly, and the data will be existed in multiple types and captured from different sources, respectively. Later studies [7,8] pointed out that the definition of 3Vs is insufficient to explain the big data we face now. Thus, veracity, validity, value, variability, venue, vocabulary, and vagueness were added to make some complement explanation of big data [8].
1In this chapter, by the data analytics, we mean the whole KDD process, while by the data
The report of IDC [9] indicates that the marketing of big data is about $16.1 billion in 2014. Another report of IDC [10] forecasts that it will grow up to $32.4 billion by 2017. The reports of [11] and [12] further pointed out that the marketing of big data will be $46.34 billion and $114 billion by 2018, respectively. As shown in Fig.2.1, even though the marketing values of big data in these researches and technology reports [9–15] are different, these forecasts usually indicate that the
scope of big data will be grown rapidly in the forthcoming future.
In addition to marketing, from the results of disease control and prevention [16], business intelligence [17], and smart city [18], we can easily understand that big data is of vital importance everywhere. A numerous researches are therefore focusing on developing effective technologies to analyze the big data. To discuss in deep the big data analytics, this paper gives not only a systematic description of traditional large-scale data analytics but also a detailed discussion about the dif-ferences between data and big data analytics framework for the data scientists or researchers to focus on the big data analytics.
Moreover, although several data analytics and frameworks have been presented in recent years, with their pros and cons being discussed in different studies, a complete discussion from the perspective of data mining and knowledge discovery in databases still is needed. As a result, this paper is aimed at providing a brief review for the researchers on the data mining and distributed computing domains to have a basic idea to use or develop data analytics for big data.
Figure2.2shows the roadmap of this paper, and the remainder of the paper is organized as follows.“Data analytics”begins with a brief introduction to the data analytics, and then “Big data analytics” will turn to the discussion of big data analytics as well as stateof-the-art data analytics algorithms and frameworks. The open issues are discussed in“The open issues” while the conclusions and future trends are drawn in“Conclusions”.
Fig. 2.1 Expected trend of the marketing of big data between 2012 and 2018. Note thatyellow,red, andblueof differentcolored box
represent the order of appearance of reference in this paper for particular year
Data Analytics
To make the whole process of knowledge discovery in databases (KDD) more clear, Fayyad and his colleagues summarized the KDD process by a few operations in [19], which are selection, preprocessing, transformation, data mining, and interpretation/evaluation. As shown in Fig.2.3, with these operators at hand we will be able to build a complete data analytics system to gather datafirst and thenfind information from the data and display the knowledge to the user. According to our observation, the number of research articles and technical reports that focus on data mining is typically more than the number focusing on other operators, but it does not mean that the other operators of KDD are unimportant. The other operators also play the vital roles in KDD process because they will strongly impact thefinal result of KDD. To make the discussions on the main operators of KDD process more concise, the following sections will focus on those depicted in Fig.2.3, which were simplified to three parts (input, data analytics, and output) and seven operators (gathering, selection, preprocessing, transformation, data mining, evaluation, and interpretation).
Fig. 2.2 Roadmap of this paper
Data Input
As shown in Fig.2.3, the gathering, selection, preprocessing, and transformation operators are in the input part. The selection operator usually plays the role of knowing which kind of data was required for data analysis and select the relevant information from the gathered data or databases; thus, these gathered data from different data resources will need to be integrated to the target data. The prepro-cessing operator plays a different role in dealing with the input data which is aimed at detecting, cleaning, andfiltering the unnecessary, inconsistent, and incomplete data to make them the useful data. After the selection and preprocessing operators, the characteristics of the secondary data still may be in a number of different data formats; therefore, the KDD process needs to transform them into a data-mining-capable format which is performed by the transformation operator. The methods for reducing the complexity and downsizing the data scale to make the data useful for data analysis part are usually employed in the transformation, such as dimensional reduction, sampling, coding, or transformation.
The data extraction, data cleaning, data integration, data transformation, and data reduction operators can be regarded as the preprocessing processes of data analysis [20] which attempts to extract useful data from the raw data (also called the primary data) and refine them so that they can be used by the following data analyses. If the data are a duplicate copy, incomplete, inconsistent, noisy, or outliers, then these operators have to clean them up. If the data are too complex or too large to be handled, these operators will also try to reduce them. If the raw data have errors or omissions, the roles of these operators are to identify them and make them con-sistent. It can be expected that these operators may affect the analytics result of KDD, be it positive or negative. In summary, the systematic solutions are usually to reduce the complexity of data to accelerate the computation time of KDD and to improve the accuracy of the analytics result.
Data Analysis
Since the data analysis (as shown in Fig.2.3) in KDD is responsible forfinding the hidden patterns/rules/information from the data, most researchers in this field use the term data mining to describe how they refine the“ground”(i.e., raw data) into “gold nugget”(i.e., information or knowledge). The data mining methods [20] are not limited to data problem specific methods. In fact, other technologies (e.g., statistical or machine learning technologies) have also been used to analyze the data for many years. In the early stages of data analysis, the statistical methods were used for analyzing the data to help us understand the situation we are facing, such as public opinion poll or TV programme rating. Like the statistical analysis, the problem specific methods for data mining also attempted to understand the meaning from the collected data.
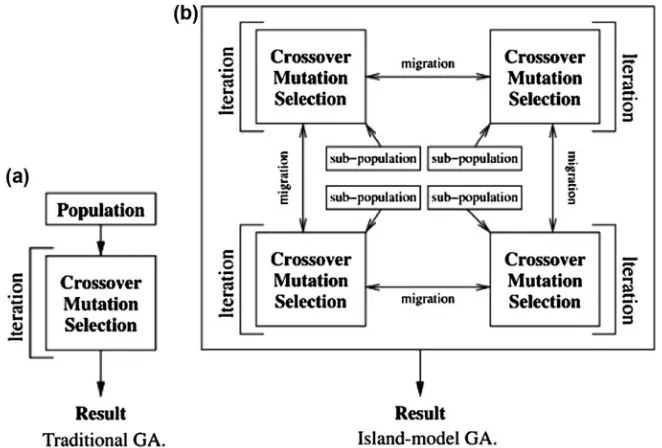
After the data mining problem was presented, some of the domain specific algorithms are also developed. An example is the apriori algorithm [21] which is one of the useful algorithms designed for the association rules problem. Although most definitions of data mining problems are simple, the computation costs are quite high. To speed up the response time of a data mining operator, machine learning [22], metaheuristic algorithms [23], and distributed computing [24] were used alone or combined with the traditional data mining algorithms to provide more efficient ways for solving the data mining problem. One of the well-known com-binations can be found in [25], Krishna and Murty attempted to combine genetic algorithm and k-means to get better clustering result than k-means alone does. As Fig.2.4 shows, most data mining algorithms contain the initialization, data input and output, data scan, rules construction, and rules update operators [26]. In Fig.2.4, D represents the raw data, d the data from the scan operator, r the rules, o the predefined measurement, and v the candidate rules. The scan, construct, and update operators will be performed repeatedly until the termination criterion is met. The timing to employ the scan operator depends on the design of the data mining algorithm; thus, it can be considered as an optional operator. Most of the data algorithms can be described by Fig.2.4in which it also shows that the represen-tative algorithms—clustering, classification, association rules, and sequential pat-terns—will apply these operators tofind the hidden information from the raw data. Thus, modifying these operators will be one of the possible ways for enhancing the performance of the data analysis.
Clustering is one of the well-known data mining problems because it can be used to understand the “new” input data. The basic idea of this problem [27] is to separate a set of unlabeled input data2to k different groups, e.g., such as k-means [28]. Classification [20] is the opposite of clustering because it relies on a set of labeled input data to construct a set of classifiers (i.e., groups) which will then be used to classify the unlabeled input data to the groups to which they belong. To solve the classification problem, the decision tree-based algorithm [29], naïve
Bayesian classification [30], and support vector machine (SVM) [31] are widely used in recent years.
Fig. 2.4 Data mining algorithm
2In this chapter, by an unlabeled input data, we mean that it is unknown to which group the input
Unlike clustering and classification that attempt to classify the input data to k groups, association rules and sequential patterns are focused on finding out the “relationships”between the input data. The basic idea of association rules [21] is find all the co-occurrence relationships between the input data. For the association rules problem, the apriori algorithm [21] is one of the most popular methods. Nevertheless, because it is computationally very expensive, later studies [32] have attempted to use different approaches to reducing the cost of the apriori algorithm, such as applying the genetic algorithm to this problem [33]. In addition to con-sidering the relationships between the input data, if we also consider the sequence or time series of the input data, then it will be referred to as the sequential pattern mining problem [34]. Several apriori-like algorithms were presented for solving it, such as generalized sequential pattern [34] and sequential pattern discovery using equivalence classes [35].
Output the Result
Evaluation and interpretation are two vital operators of the output. Evaluation typically plays the role of measuring the results. It can also be one of the operators for the data mining algorithm, such as the sum of squared errors which was used by the selection operator of the genetic algorithm for the clustering problem [25].
To solve the data mining problems that attempt to classify the input data, two of the major goals are: (1) cohesion—the distance between each data and the centroid (mean) of its cluster should be as small as possible, and (2) coupling—the distance between data which belong to different clusters should be as large as possible. In most studies of data clustering or classification problems, the sum of squared errors (SSE), which was used to measure the cohesion of the data mining results, can be defined as
SSE¼X
k
i¼1 Xni
j¼1
Dðxij ciÞ; ð2:1Þ
ci¼
1 ni
Xni
j¼1
xij; ð2:2Þ
where k is the number of clusters which is typically given by the user; nithe number of data in the ith cluster; xijthe jth datum in the ith cluster; ci is the mean of the ith cluster; andn¼Pk
i¼1niis the number of data. The most commonly used distance
measure for the data mining problem is the Euclidean distance, which is defined as
Dðpi;pjÞ ¼
X
d
l¼1 pil;pjl
2
!1=2
; ð2:3Þ
where pi and pj are the positions of two different data. For solving different data mining problems, the distance measurement D(pi, pj) can be the Manhattan dis-tance, the Minkowski disdis-tance, or even the cosine similarity [36] between two different documents.
Accuracy (ACC) is another well-known measurement [37] which is defined as
ACC¼Number of cases correctly classified
Total number of test cases : ð2:4Þ
To evaluate the classification results, precision (p), recall (r), and F-measure can be used to measure how many data that do not belong to group A are incorrectly classified into group A; and how many data that belong to group A are not classified into group A. A simple confusion matrix of a classifier [37] as given in Table2.1 can be used to cover all the situations of the classification results. In Table2.1, TP and TN indicate the numbers of positive examples and negative examples that are correctly classified, respectively; FN and FP indicate the numbers of positive examples and negative examples that are incorrectly classified, respectively. With the confusion matrix at hand, it is much easier to describe the meaning of precision (p), which is defined as
p¼ TP
TPþFP; ð2:5Þ
and the meaning of recall (r), which is defined as
r¼ TP
TPþFN: ð2:6Þ
The F-measure can then be computed as
F¼ 2pr
pþr: ð2:7Þ
In addition to the above-mentioned measurements for evaluating the data mining results, the computation cost and response time are another two well-known measurements. When two different mining algorithms canfind the same or similar
Table 2.1 Confusion matrix
of a classifier [37] Classified positive Classified negative Actual positive TP FN
results, of course, how fast they can get the final mining results will become the most important research topic.
After something (e.g., classification rules) is found by data mining methods, the two essential research topics are: (1) the work to navigate and explore the meaning of the results from the data analysis to further support the user to do the applicable decision can be regarded as the interpretation operator [38], which in most cases, gives useful interface to display the information [39] and (2) a meaningful sum-marization of the mining results [40] can be made to make it easier for the user to understand the information from the data analysis. The data summarization is generally expected to be one of the simple ways to provide a concise piece of information to the user because human has trouble of understanding vast amounts of complicated information. A simple data summarization can be found in the clustering search engine, when a query “oasis” is sent to Carrot2 (http://search. carrot2.org/stable/search), it will return some keywords to represent each group of the clustering results for web links to help us recognize which category needed by the user, as shown in the left side of Fig.2.5.
A useful graphical user interface is another way to provide the meaningful information to an user. As explained by Shneiderman in [39], we need“overview first, zoom andfilter, then retrieve the details on demand”. The useful graphical user interface [38,41] also makes it easier for the user to comprehend the meaning of the results when the number of dimensions is higher than three. How to display the results of data mining will affect the user’s perspective to make the decision. For instance, data mining can help usfind“type A influenza”at a particular region, but without the time series andflu virus infected information of patients, the govern-ment could not recognize what situation (pandemic or controlled) we are facing now so as to make appropriate responses to that. For this reason, a better solution to
Fig. 2.5 Screenshot of the result of clustering search engine
merge the information from different sources and mining algorithm results will be useful to let the user make the right decision.
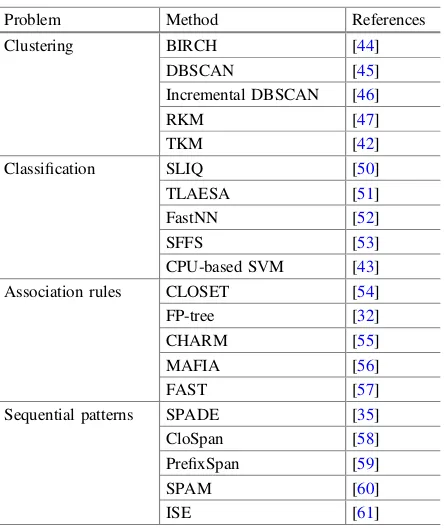
Summary
Since the problems of handling and analyzing large-scale and complex input data always exist in data analytics, several efficient analysis methods were presented to accelerate the computation time or to reduce the memory cost for the KDD process, as shown in Table2.2. The study of [42] shows that the basic mathematical con-cepts (i.e., triangle inequality) can be used to reduce the computation cost of a clustering algorithm. Another study [43] shows that the new technologies (i.e., distributed computing by GPU) can also be used to reduce the computation time of data analysis method. In addition to the well-known improved methods for these analysis methods (e.g., triangle inequality or distributed computing), a large pro-portion of studies designed their efficient methods based on the characteristics of mining algorithms or problem itself, which can be found in [32,44, 45], and so forth. This kind of improved methods typically was designed for solving the drawback of the mining algorithms or using different ways to solve the mining problem. These situations can be found in most association rules and sequential
Table 2.2 Efficient data analytics methods for data mining
Problem Method References Clustering BIRCH [44]
DBSCAN [45] Incremental DBSCAN [46]
RKM [47]
TKM [42]
Classification SLIQ [50] TLAESA [51] FastNN [52]
SFFS [53]
CPU-based SVM [43] Association rules CLOSET [54] FP-tree [32]
CHARM [55]
MAFIA [56]
FAST [57]
Sequential patterns SPADE [35] CloSpan [58] PrefixSpan [59]
SPAM [60]
patterns problems because the original assumption of these problems is for the analysis of large-scale dataset. Since the earlier frequent pattern algorithm (e.g., apriori algorithm) needs to scan the whole dataset many times which is computa-tionally very expensive. How to reduce the number of times the whole dataset is scanned so as to save the computation cost is one of the most important things in all the frequent pattern studies. The similar situation also exists in data clustering and classification studies because the design concept of earlier algorithms, such as mining the patterns on-the-fly [46], mining partial patterns at different stages [47], and reducing the number of times the whole dataset is scanned [32], are therefore presented to enhance the performance of these mining algorithms. Since some of the data mining problems are NP-hard [48] or the solution space is very large, several recent studies [23,49] have attempted to use metaheuristic algorithm as the mining algorithm to get the approximate solution within a reasonable time.
Abundant research results of data analysis [20,27,62] show possible solutions for dealing with the dilemmas of data mining algorithms. It means that the open issues of data analysis from the literature [2,63] usually can help us easilyfind the possible solutions. For instance, the clustering result is extremely sensitive to the initial means, which can be mitigated by using multiple sets of initial means [64]. According to our observation, most data analysis methods have limitations for big data, that can be described as follows:
• Unscalability and centralization Most data analysis methods are not for large-scale and complex dataset. The traditional data analysis methods cannot be scaled up because their design does not take into account large or complex datasets. The design of traditional data analysis methods typically assumed they will be performed in a single machine, with all the data in memory for the data analysis process. For this reason, the performance of traditional data analytics will be limited in solving the volume problem of big data.
• Non-dynamic Most traditional data analysis methods cannot be dynamically adjusted for different situations, meaning that they do not analyze the input data on-the-fly. For example, the classifiers are usually fixed which cannot be automatically changed. The incremental learning [65] is a promising research trend because it can dynamically adjust the the classifiers on the training process with limited resources. As a result, the performance of traditional data analytics may not be useful to the problem of velocity problem of big data.
• Uniform data structure Most of the data mining problems assume that the format of the input data will be the same. Therefore, the traditional data mining algorithms may not be able to deal with the problem that the formats of different input data may be different and some of the data may be incomplete. How to make the input data from different sources the same format will be a possible solution to the variety problem of big data.
Because the traditional data analysis methods are not designed for large-scale and complex data, they are almost impossible to be capable of analyzing the big data. Redesigning and changing the way the data analysis methods are designed are
two critical trends for big data analysis. Several important concepts in the design of the big data analysis method will be given in the following sections.
Big Data Analytics
Nowadays, the data that need to be analyzed are not just large, but they are com-posed of various data types, and even including streaming data [66]. Since big data has the unique features of “massive, high dimensional, heterogeneous, complex, unstructured, incomplete, noisy, and erroneous,”which may change the statistical and data analysis approaches [67]. Although it seems that big data makes it possible for us to collect more data tofind more useful information, the truth is that more data do not necessarily mean more useful information. It may contain more ambiguous or abnormal data. For instance, a user may have multiple accounts, or an account may be used by multiple users, which may degrade the accuracy of the mining results [68]. Therefore, several new issues for data analytics come up, such as privacy, security, storage, fault tolerance, and quality of data [69].
The big data may be created by handheld device, social network, internet of things, multimedia, and many other new applications that all have the character-istics of volume, velocity, and variety. As a result, the whole data analytics has to be re-examined from the following perspectives:
• From the volume perspective, the deluge of input data is the veryfirst thing that we need to face because it may paralyze the data analytics. Different from traditional data analytics, for the wireless sensor network data analysis, Baraniuk [70] pointed out that the bottleneck of big data analytics will be shifted from sensor to processing, communications, storage of sensing data, as shown in Fig. 2.6. This is because sensors can gather much more data, but when uploading such large data to upper layer system, it may create bottlenecks everywhere.
• In addition, from the velocity perspective, real-time or streaming data bring up the problem of large quantity of data coming into the data analytics within a short duration but the device and system may not be able to handle these input data. This situation is similar to that of the networkflow analysis for which we typically cannot mirror and analyze everything we can gather.
• From the variety perspective, because the incoming data may use different types or have incomplete data, how to handle them also bring up another issue for the input operators of data analytics.
Big Data Input
The problem of handling a vast quantity of data that the system is unable to process is not a brand-new research issue; in fact, it appeared in several early approaches [2, 21,71], e.g., marketing analysis, networkflow monitor, gene expression analysis, weather forecast, and even astronomy analysis. This problem still exists in big data analytics today; thus, preprocessing is an important task to make the computer, platform, and analysis algorithm be able to handle the input data. The traditional data preprocessing methods [72] (e.g., compression, sampling, feature selection, and so on) are expected to be able to operate effectively in the big data age. However, a portion of the studies still focus on how to reduce the complexity of the input data because even the most advanced computer technology cannot efficiently process the whole input data by using a single machine in most cases. By using domain knowledge to design the preprocessing operator is a possible solution for the big data. In [73], Ham and Lee used the domain knowledge, B-tree, divide-and-conquer tofilter the unrelated log information for the mobile web log analysis. A later study [74] considered that the computation cost of preprocessing will be quite high for massive logs, sensor, or marketing data analysis. Thus, Dawelbeit and McCrindle employed the bin packing partitioning method to divide the input data between the computing processors to handle this high computations of preprocessing on cloud system. The cloud system is employed to preprocess the raw data and then output the refined data (e.g., data with uniform format) to make it easier for the data analysis method or system to preform the further analysis work. Sampling and compression are two representative data reduction methods for big data analytics because reducing the size of data makes the data analytics compu-tationally less expensive, thus faster, especially for the data coming to the system
Fig. 2.6 The comparison between traditional data analysis and big data analysis on wireless sensor network
rapidly. In addition to making the sampling data represent the original data effec-tively [75], how many instances need to be selected for data mining method is another research issue [76] because it will affect the performance of the sampling method in most cases.
To avoid the application-level slow-down caused by the compression process, in [77], Jun et al. attempted to use the FPGA to accelerate the compression process. The I/O performance optimization is another issue for the compression method. For this reason, Zou et al. [78] employed the tentative selection and predictive dynamic selection and switched the appropriate compression method from two different strategies to improve the performance of the compression process. To make it possible for the compression method to efficiently compress the data, a promising solution is to apply the clustering method to the input data to divide them into several different groups and then compress these input data according to the clus-tering information. The compression method described in [79] is one of this kind of solutions, itfirst clusters the input data and then compresses these input data via the clustering results while the study [80] also used clustering method to improve the performance of the compression process.
In summary, in addition to handling the large and fast data input, the research issues of heterogeneous data sources, incomplete data, and noisy data may also affect the performance of the data analysis. The input operators will have a stronger impact on the data analytics at the big data age than it has in the past. As a result, the design of big data analytics needs to consider how to make these tasks (e.g., data clean, data sampling, data compression) work well.
Big Data Analysis Frameworks and Platforms
Various solutions have been presented for the big data analytics which can be divided [81] into (1) Processing/Compute: Hadoop [82], Nvidia CUDA [83], or Twitter Storm [84], (2) Storage: Titan or HDFS, and (3) Analytics: MLPACK [85] or Mahout [86]. Although there exist commercial products for data analysis [82–
85], most of the studies on the traditional data analysis are focused on the design and development of efficient and/or effective“ways”tofind the useful things from the data. But when we enter the age of big data, most of the current computer systems will not be able to handle the whole dataset all at once; thus, how to design a good data analytics framework or platform3and how to design analysis methods are both important things for the data analysis process. In this section, we will start with a brief introduction to data analysis frameworks and platforms, followed by a comparison of them.
3In this paper, the analysis framework refers to the whole system, from raw data gathering, data
Researches in Frameworks and Platforms
To date, we can easilyfind tools and platforms presented by well-known organi-zations. The cloud computing technologies are widely used on these platforms and frameworks to satisfy the large demands of computing power and storage. As shown in Fig.2.7, most of the works on KDD for big data can be moved to cloud system to speed up the response time or to increase the memory space. With the advance of these works, handling and analyzing big data within a reasonable time has become not so far away. Since the foundation functions to handle and manage the big data were developed gradually; thus, the data scientists nowadays do not have to take care of everything, from the raw data gathering to data analysis, by themselves if they use the existing platforms or technologies to handle and manage the data. The data scientists nowadays can pay more attention tofinding out the useful information from the data even thought this task is typically like looking for a needle in a haystack. That is why several recent studies tried to present efficient and effective framework to analyze the big data, especially onfind out the useful things.
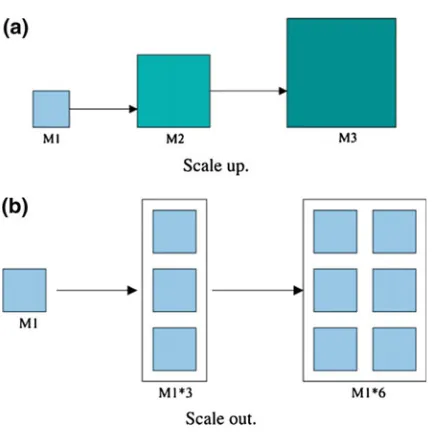
Performance-oriented From the perspective of platform performance, Huai [87] pointed out that most of the traditional parallel processing models improve the performance of the system by using a new larger computer system to replace the old computer system, which is usually referred to as“scale up”, as shown in Fig.2.8a. But for the big data analytics, most researches improve the performance of the system by adding more milar computer systems to make it possible for a system to handle all the tasks that cannot be loaded or computed in a single computer system (called “scale out”), as shown in Fig.2.8b where M1, M2, and M3 represent computer systems that have different computing power, respectively. For the scale up based solution, the computing power of the three systems is in the order of
Fig. 2.7 The basic idea of big data analytics on cloud system
M3 > M2 > M1; but for the scale out based system, all we have to do is to keep adding more similar computer systems to to a system to increase its ability. To build a scalable and fault-tolerant manager for big data analysis, Huai et al. [87] presented a matrix model which consists of three matrices for data set (D), concurrent data processing operations (O), and data transformations (T), called DOT. The big data is divided into n subsets each of which is processed by a computer node (worker) in such a way that all the subsets are processed concurrently, and then the results from these n computer nodes are collected and transformed to a computer node. By using this framework, the whole data analysis framework is composed of several DOT blocks. The system performance can be easily enhanced by adding more DOT blocks to the system.
Another efficient big data analytics was presented in [88], called generalized linear aggregates distributed engine (GLADE). The GLADE is a multi-level tree-based data analytics system which consists of two types of computer nodes that are a coordinator workers. The simulation results [89] show that the GLADE can provide a better performance than Hadoop in terms of the execution time. Because Hadoop requires large memory and storage for data replication and it is a single master,4Essa et al. [90] presented a mobile agent based framework to solve these two problems, called the map reduce agent mobility (MRAM). The main reason is that each mobile agent can send its code and data to any other machine; therefore, the whole system will not be down if the master failed. Compared to Hadoop, the
Fig. 2.8 The comparisons between scale up and scale out
4The whole system may be down when the master machine crashed for a system that has only one