!
" #
$ % % !
$ # " "
&
' % $ ( ) ' $ * # ) $ %
+ " " # ( ) ' $ * # +
+ , # ( ) ' $ * # $ ' " " "
#+
-+ , # $ ' " & $ +
#
! ! "
# $ %& '
! ./ 0. , 10 1 0 2 " %
“I hereby declare that I have read this project report and in my opinion this project report is sufficient in terms of scope and quality for the award of the degree of
Master of Science (Construction Management)”
Signature : ………
Name of Supervisor : Ir. Dr. Rosli bin Mohamad Zin
PROJECT RISK FACTORS : CASE STUDY OF MINISTRY OF EDUCATION
PROJECTS
ANIDA SUHARTI @ AMI RONIDA BINTI BASIRON
A project report submitted in partial fulfillment of the requirements for the award
of the degree of Master of Science (Construction Management)
Faculty of Civil Engineering
Universiti Teknologi Malaysia
“I declare that this project report entitled ‘Project Risk Factors : Case Study of Ministry of Education Projects’ is the result of my own research except as cited in the references. The report has not been accepted for any degree and is not concurrently submitted in candidature of any other degree”.
Signature : ………... Author’s Name : Anida Suharti @ Ami Ronida binti Basiron
ACKNOWLEDGEMENT
Praise to the Almighty Allah the God of the Universe that with His blessing I managed to complete this master project successfully. First and foremost, I would like to convey my sincere thanks and gratitude to my supervisor; Ir. Dr. Rosli bin Mohamad Zin for his kind assistance and advice, beneficial criticisms and observations throughout this master project. His professional guidance has enabled this master project to be written and submitted as a partial requirement for the Masters of Construction Management programme.
I would also like to thank the respondents of this study for help in improving my questionnaire survey form for their precious comments and ideas that have provided me with very useful background data and information.
ABSTRACT
ABSTRAK
TABLE OF CONTENTS
CHAPTER TITLE PAGE
DECLARATION ii
DEDICATION iii
ACKNOWLEDGEMENTS iv
ABSTRACT v
ABSTRAK vi
TABLE OF CONTENTS vii
LIST OF TABLES xi
LIST OF FIGURES xii
LIST OF SYMBOLS xiii
1 INTRODUCTION
1.1 Introduction 1
1.2 Background of the Study 3
1.3 Problem Statement 4
1.4 Aim and Objective 5
1.5 Scope 6
2 RISK IN BUILDING PROJECT
2.1 Introduction 8
2.2 Overview of the Ministry of Education (MOE) Projects 8
2.3 Current Practices of Risk Management in 13
Public Works Department (PWD)
2.4 The Nature of Risk 16
2.5 Risk Management and Project Life Cycle 17
2.6 Risk Identification and Classification 19
2.6.1 Business Risk 22
2.6.2 Pure Risk 22
2.6.3 Speculative Risk 22
2.6.4 Financial Risk 23
2.7 Risk Identification in Projects Belonging to MOE 23 2.7.1 Establishment of Risk Factors and Classification 24
2.7.1.1 Technical Risk 25
2.8.1 Qualitative Analysis 36
2.8.2 Quantitative Analysis 36
2.8.3 Likelihood and Impact 37
2.9 Risk Evaluation 39
2.10 Risk Control 40
2.10.2 Reduction in the Likelihood 42
2.10.3 Reduction in the Impact 43
2.10.4 Transfer 43
2.10.5 Acceptance or Retention 43
2.11 Risk Monitoring 44
2.12 Risk Factors in Building Construction Projects 45
2.12 Summary 45
3 METHODOLOGY
3.1 Introduction 46
3.2 Objective Identification 46
3.3 Literature review 47
3.4 Data Collection 47
3.5 Discussion with Experts 48
3.6 Questionnaire Survey 48
3.6.1 Section A : Demography 49
3.6.2 Section B : Identification of Level of Risk 49 3.6.3 Section C : Develop and Implement Risk Control 50
3.7 Questionnaire Distribution 50
3.8 Data Analysis 51
3.8.1 Level of Risk Analysis 51
3.8.2 Risk Treatment Analysis 53
3.9 Summary 54
4 ANALYSIS AND DISCUSSION
4.1 Introduction 55
4.2.1 Company Profile 56 4.2.1.1 Classification of Company 57 4.2.1.2 CIDB (Construction Industry Development Board) 57
Classification Grade
4.2.1.3 Number of Years in Business 58
4.2.2 Respondent Profile 59
4.2.3 Project Details 60
4.2.4 General Knowledge about Risk 61
4.3 Detail Analysis 64
4.3.1 Risks Factors in Building Projects Belonging to MOE 64
4.3.2 Level of Risk for Each Risk Factor 65
4.3.3 Risk Treatment for Each Risk Factor 75
4.4 Summary 76
5 CONCLUSIONS AND RECOMMENDATIONS
5.1 Introduction 77
5.2 Conclusion 77
5.2.1 To Establish Risk Factors in Building Projects Belonging 78 to Ministry of Education (MOE)
5.2.2 To Identify the level of Risk for Each Risk Factor from the 78 Contractors Perspective
5.2.3 To Identify Risk Treatment for Each Risk Factor from 78 Contractors Perspective
5.3 Recommendations 79
REFERENCES 81
LIST OF TABLES
TABLE NO. TITLE PAGE
2.1 Federal government allocation and expenditure by 10 sector (RM million)
2.2 Development expenditure and allocation for education 11 and training
2.3 Education programme list under the PWD 12
2.4 Risk factors under the technical risk classification 26
2.5 Construction design cause risk factors 28
2.6 Physical risk factors 29
2.7 Financial risk factors 30
2.8 Personal risk factors 31
2.9 Safety-accident risk factors 33
2.10 Political and regulation risk factors 34
2.11 Contractual risk factors 34
2.12 Environmental regulations cause risk factors 35
2.13 Risk matrix 38
3.1 Matrix for the calculation of the risk significance index 53
4.1 Risk classification 65
4.2 The level of risk for each risk factor 68
LIST OF FIGURES
FIGURE NO. TITLE PAGE
1.1 Research methodology flow chart 7
2.1 PWD risk management framework 15
2.2 Risk management process 19
2.3 Technical risk classification 25
4.1 Questionnaire distribution and responses 56
4.2 Classification of company 57
4.3 CIDB classification of grade 58
4.4 Number of years in business 59
4.5 Type of contract 60
4.6 Type of project 61
4.7 Risk existence 62
4.8 Risk knowledge 62
4.9 Risk important 63
LIST OF SYMBOLS
r - significance score
j - respondent
i - ordinal number of risk
k - ordinal number of classification of risk α - likelihood occurrence of risk
β - impact of risk
R - significance index score
n - total numbers of valid feedback questionnaire µ - weighting given to each risk control by respondent µ1 - frequency of “avoid risk” response
µ2 - frequency of “reduce likelihood” response µ3 - frequency of “reduce impact” response µ4 - frequency of “risk transfer” response
LIST OF APPENDICES
APPENDIX TITLE PAGE
A Risk factor list 84
CHAPTER 1
INTRODUCTION
1.1 Introduction
The construction industry has a bad reputation in coping risk which is depending on the degree of project difficulty. Risk analysis is either ignored or done by simply adding contingencies in a contract. As a result many projects fail to meet the expected deadlines, cost targets and quality standards thus loss to both contractors and clients.
Risk will exist and should be assessed and reduced to acceptable levels. There are different types of risk at different stages of project development. Typical risk areas include client changes due to business predictions or user requirements, subcontractor default, technical failure, labour shortages, inclement weather, critical task sequences, tight deadlines, resource limitations, complex co-ordination requirements and unfamiliar tasks. Peter (2005) added that external political, economic, social, technology issues can also affect current projects which are not covered under insurance.
Construction of a building project implies considerable risks. Risk assessment during the construction period is an important tool for the construction management giving part of the basis for mitigation actions against delays in production. Application of risk management techniques can significantly improve the investment performance of construction projects (Flanagan and Norman, 1993). According to Godfrey (1996), systematic risk management will helps to:
a) identify, assess, and rank risks, making the risk explicit; b) focus on the major risks of the project;
c) make informed decision on the provision for adversity; d) minimize potential damage should the worst happen; e) control the uncertain aspects of construction projects;
f) clarify and formalize the company’s role and the roles of others in the risk management process;
g) identify the opportunities to enhance project performance.
gain from investment in project while not exposing themselves to unacceptable levels of risk.
1.2 Background of the Study
A variety of study in risk management has been studied and introduced in literature review. The purpose of developing risk management technique is to add value to project delivery. Thus there has been an increase in research aimed at investigating risk in construction industry.
Majid and McCaffer (1998) identified the factor of shortage of material, poor quality of material, poor procurement of material, late delivery of material, and unreliable suppliers that contribute to causes of delays. Chan and Kumaraswamy (1996) revealed that factors shortage of material and poor procurement of material as a critical risk factors.
five aspects while the rest risks can significantly influence at least one aspect of project objective.
1.3 Problem Statement
Construction industry will be risky for a large number of reasons. Differences categories of project risk and level of risk found on construction projects. Project risk if not well managed has significant effect on completion cost and time of construction project. Risk can be minimize, avoid or transfer when their factors are identified. Knowing the risk factor in a construction project would help avoiding the same in future.
In PWD most of MOE projects, are awarded on a competitive basis using the traditional approach. MOE projects were prepared based on a lump sump contract with JKR 203 Condition of Contract. This is because, preparation the document tender is a very time consuming job.
At the moment, PWD has no specific methodology to deal with risk in construction projects. Construction risk of government projects under the PWD generally has not been well researched. In particular, risk in construction is poorly understood and very little researches have been directed towards the need in PWD. As a result, unnecessary delays turn to a profitable project to be financially undertaking and client has become dissatisfied with the performance and level of service they are receiving. These risks can be substantially mitigated if they are properly identified and addressed accordingly. The lack of risk management in PWD is the motives of this study particularly in projects belonging to MOE, since the MOE received the biggest budget allocation in the Ninth Malaysia Plan (9MP).
1.4 Aim and Objective
The aim of this study is to investigate risks factors in building construction projects belonging to MOE. In order to achieve this aim, three objectives have been outlined:
a) To establish risks factor in building projects belong to MOE.
b) To identify the level of risk for each risk factor from the contractors perspective.
c) To identify risk control or treatment for each risk factor from the contractors
1.5 Scope
The study focused on MOE projects in Johor. The respondents to the questionnaire survey were contractors that are registered under the class E, D, C and B.
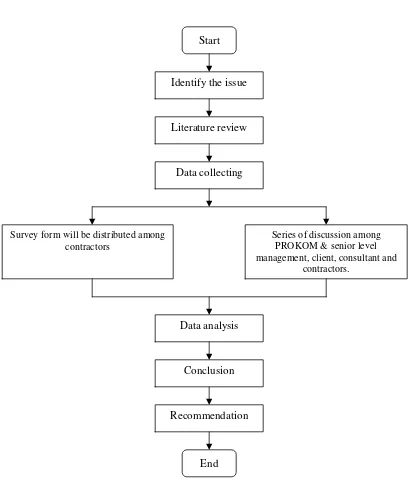
1.6 Methodology
The main research methodology was through questionnaire survey and series of discussion. The literature review was carried out to provide the background information of
risk factors particularly in MOE projects. From the literature review, the issues relevance
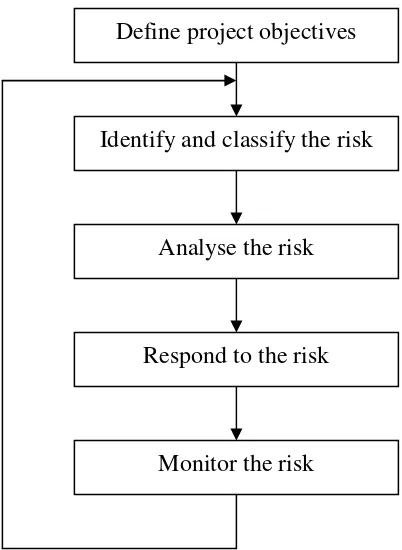
for this study were highlighted and identified. Figure 1.1 depicted the research methodology
Figure 1.1: Research methodology flow chart
Start
Literature review Identify the issue
Data collecting
Survey form will be distributed among contractors
Series of discussion among PROKOM & senior level management, client, consultant and
contractors.
Data analysis
Conclusion
Recommendation
CHAPTER 2
RISK IN BUILDING PROJECT
2.1 Introduction
This chapter covers the overview of MOE projects and follows by the review of studies carried out by previous researchers in determining the risk factors and level of risks in building projects. The last part of this chapter will focus on the risk treatment for all possible factors according to the established categories based on the previous study and adopted to suit the MOE projects.
2.2 Overview of the Ministry of Education (MOE) Projects
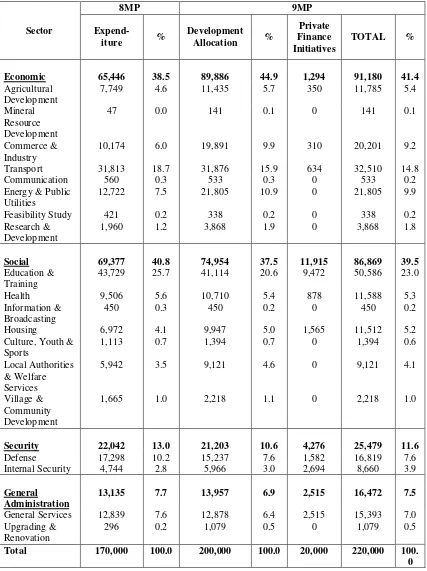
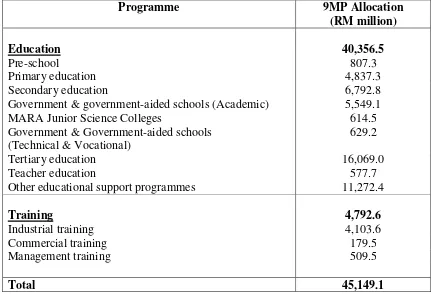
Malaysia from the Eight Malaysia Plan (Table 2.1). Out of the total allocation, 44.9 percent has been distributed to development projects under the economic sector where the sub-sectors education and training received the biggest percentage of the allocation, at 20.6 percent. In line with the greater focus on human capital development, a total of RM45.1 billion will be allocated during the 9MP period to implement the various education and training programme, as shown in Table 2.2.
For Education Programme, RM 23.198 billion is allocated for 17,179 projects development. New projects development are 16,735 with RM 20,704 billion and continue 8MP projects are in development of Government Aided School (Islamic Religious School, Chinese Medium School and Tamil Medium School), computer laboratory, additional / replacement of buildings programme, replacement of building block & upgrading programme and other school projects.
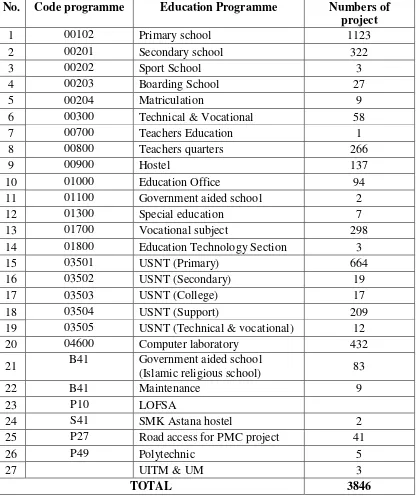
To ensure that entire programme is on its track, MOE has appointed Public Works Department (PWD) as the sole contractor for government projects with a ceiling of RM 17.087 billion. According to MOE, the PWD uses minimum cost and standardized designs that fit their criteria. The other projects, on the other hand are done under privatization programmes (private finance initiatives). This approach is to facilitate the economic growth of the nation, relieve the financial and administration burden of the Government, reduce the Government's presence in the economy, decrease both the level and scope of public spending and to allow market forces to govern economic activities and improve efficiency and productivity in line with the National Development Policy. Table 2.3 is an education programme list under the PWD.
Table 2.1: Federal government development allocation and expenditure by sector (RM million) (Source: Economic Planning Unit (EPU))
Table 2.2 : Development expenditure and allocation for education and training (Source: Economic Planning Unit (EPU))
Programme 9MP Allocation
(RM million)
Education 40,356.5
Pre-school 807.3
Primary education 4,837.3
Secondary education 6,792.8
Government & government-aided schools (Academic) 5,549.1
MARA Junior Science Colleges 614.5
Government & Government-aided schools (Technical & Vocational)
629.2
Tertiary education 16,069.0
Teacher education 577.7
Other educational support programmes 11,272.4
Training 4,792.6
Industrial training 4,103.6
Commercial training 179.5
Management training 509.5
Table 2.3 : Education programme list under the PWD (source: Cawangan Pendidikan dan Pengajian Tinggi, JKR Malaysia)
No. Code programme Education Programme Numbers of
project
6 00300 Technical & Vocational 58
7 00700 Teachers Education 1
13 01700 Vocational subject 298
14 01800 Education Technology Section 3
15 03501 USNT (Primary) 664
16 03502 USNT (Secondary) 19
17 03503 USNT (College) 17
18 03504 USNT (Support) 209
19 03505 USNT (Technical & vocational) 12
20 04600 Computer laboratory 432
21 B41 Government aided school
(Islamic religious school) 83
2.3 Current Practice of Risk Management in Public Works Department (PWD)
Although the PWD was burdened by too many projects under the 9MP, ninth hundred and fifth teen (915) MOE projects were awarded to the successful contractors throughout Malaysia also handled by the PWD (Project Information System; SKALA, 2008). A variety of unexpected events occurred during the process of building procurement until project implementation and many of them can create financial and time losses to the MOE as a client or other interested parties. Such events are commonly called risks. For example, when too many projects are being implemented at one time, the demand for the construction material will be increased and this may cause a contractor to make substandard quality of work on site to ensure they gain their expected profit from a completed project which called as risk event. Cost and time overruns in many construction projects are attributable to various risk events, where uncertainties were uncontrollable, or not appropriately accommodated during planning of the project (Baloi and Price, 2002).
The adoption of risk management technique in PWD is vital to improve their reputation as a technical body to the Government. These will help the Department to enhance its services with better value for money and timely completion of projects. The identification of risk factors in projects belong to MOE is critical to the success of future project implementation and improves efficiency of the construction industry during practice.
profile projects and still under promotion within the department. For other projects, risk workshops can be costly and consume plenty of time. For that reason, the department has expressed the need to document typical project risks to assist the project managers in developing the risk management plan for any typical project.
The purpose of having the guideline is to provide guidance to PWD project teams and project stakeholders on the application of the standard project risk management process in PWD. The guideline is applicable to all PWD projects, programs, plans and activities. The guideline also provides information and advice useful to project teams and those concerned with project governance, but do not provide a detailed definition of all the actions to be taken or of the detailed risk management organisation for a project or program. These will vary according to the circumstances.
Figure 2.1 : PWD risk management framework (Source: Risk Management Facilitation Guidelines Jabatan Kerja Raya)
On top of that, the non physical projects which have risk management that are currently adopted are:
a) Coaching & mentoring program.
b) To enhance the performance of project through milestone set in SKALA. c) To prevent the highlighted issued in Auditor General Report 2006.
d) Project implementation enhancement through report card system and SKALA.
Strategic – Portfolio level Risk Management layer Risks to the achievement of PWD strategy to become the Center of Excellence Infrastructure Development
Program-level
Risk Management layer Risks to the achievement of PWD objectives
In support of the PWD strategy.
2.4 The Nature of Risk
Risk can be defined in different ways.The Oxford Advanced Learner’s Dictionary, 1995 defines risk as the “chance of failure or the possibility of meeting danger or of suffering harm or loss”. A broad definition of risk is the occurrence of an event that has consequences for, or impacts on project (Ralph and Irwin, 1997). Frame (2003) considered risk from two points of view. First, risk is tied to prospect of injury or loss. Second, risk can be defined as a reflection of information available to make good decisions.
Boothroyd and Emmet (1998) described risk as a consideration in the process of a construction project whose variation results in uncertainty in the final cost, duration and quality of the project. Atkinson (2005) used hazard and risk term in elaborating its definition in risk management. According to Atkinson, hazard is a particular event which has the potential if it occurs of an adverse effect. Risk is the probability of a defined hazard and the magnitude of the consequences. As it applies to building construction project, risks generally can be defined as the possible occurrence of an uncertain event or outcome which will cause significant consequences such as extra cost or delayed completion. b) What will it finally cost (cost risk)?
Thus, the typical risks in a construction project include:
a) cost overruns – failure to keep final cost within the budgeted cost
b) time overruns – failure to keep within the time stipulated for design, construction and handover
c) poor quality – failure to meet the required technical standards in relation to quality, functionality, safety and environment control.
These typical risks indicate the consequences caused by uncertainties, which are commonly referred as risk effects. Risk effects are the result of possible occurrences called risk factors or risk causes.
2.5 Risk management and Project Life Cycle
Today, risk management is a critical factor to successful project management, as projects tend to be more complex and competition increasingly tougher (Baloi and Price, 2002). It is also recognised as a vital integrated project management tool that cuts across the entire project, addressing and interrelating cost, schedule, and performance risks. The goal is to make everyone involved in a project aware that risk should be a consideration in the design, development, and implementation of a system.
the remaining uncertainties diminish. This is critical and the project should not proceed until that understanding and agreement is reached. Not all risks can be foreseen and problems that initially seem unlikely may in fact occur, so experience plays a key role in the identification of project-specific risks. This is a critical function that the project manager must perform. If it is done too late then it may be too late to correct any new problems identified. The answer will depend on the classification and type of project.
The rapidly changing context and its influence on the way projects develop have made risk management process an ever more important challenge. According to Maytorena, et al. (1998), numerous best practices standard such as A Guide to the Project Management Body of Knowledge (PMBoK), Project Risk Analysis and Management Guide, RAMP: Risk Analysis and Management for Project guide and Joint Australian / New Zealand Standard, AS/NZ 4360:2004, Risk Management as well as specialist tools and techniques have been developed focusing on a more effective risk management process.
Figure 2.2: Risk management process (source: Maytorena, (2001))
2.6 Risk Identification and Classification
Risk identification involves the identification and documentation of all the risks that may impact on the project during its life cycle that can be realistically predicted at the time. The identification of each source of risk and the components allows the risk item to be separated from others (Mills, 2001). Risk identification usually is done initially by involving key stakeholders, including steering committee members.
One way of doing the risk identification may be through brainstorming sessions that identify and clarify the main risks, which may prevent the project achieving its
Define project objectives
Identify and classify the risk
Analyse the risk
Respond to the risk
stated outcomes or benefits. It is important to define clearly the scope of the project at this stage so that the identification of risks can remain focused on what potentially threatens the delivery of outputs (level of resourcing, time, cost and quality) and the realization of outcomes or benefits by the client.
Risks can be classified in various ways. Risks can be categorized, in terms of type (i.e. corporate risks, business risks, project risks and system risks). These categories can be broken down into other categories, including economic, environmental, financial, human, information and physical security, natural hazards, occupational health and safety (OH&S), public liability and etc. Establishing categories can assist in ensuring all relevant risks are identified. Another way of establishing categories is to take each of the key elements of project management and identify which risks may impinge on the application of each key element.
Frame (2003) categorizes risks in terms of their type; pure (for insurable) risk, business risk, project risk, operational risk, technical risk, political risk. These risk categories are not mutually exclusive. Thus, technical risks can also be pure risks as well, and operational risk may contribute substantially to project risk.
Burke (2003) classifies risk as to the degree of uncertainty, connecting it to the worth the pain for the greater gain.
Tah and Carr, 2000 classified risk in terms of their sources, i.e. risks retained by contractors, clients and consultants. Tah and Carr also used a Hierarchical Risk Breakdown Structure (HRBS) to classify risks according to their origin and location of their impact in the project. The HRBS is suited for project risk assessment, but does not have a mechanism for assigning qualitative effects of the risk identified by the HRBS. A risk scoring mechanism will also have to be implemented to determine the possible effect of the risk.
2.6.1 Business Risk
Business risk is associated with capital expenditure, possible income, operating expenses and property value. Business risk indicates the probability that the expected level of investment return will not be achieved.
2.6.2 Pure Risk
Pure risk also referred to as static risk, non-market risk, or unsystematic risk. Pure risk indicates a potential outcome that has no potential gain. It is related to physical and technical causes and subsequent losses occur at random, and are beyond the control of decision-maker. It is also focuses exclusively on the occurrence of bad things. For example, an accident on site is a pure risk, that would bring loss and damage if it is happens.
2.6.3 Speculative Risk
could cause variations in project development cost, operating cost, or the value of built property, thus changing the rate of investment return.
2.6.4 Financial risk
It relates to the loss of financial capital. Financial risk increases whenever the amount of debt or related charges increases. If the client sponsors the project from retained earnings, the financial exposure to risk may threaten the existence of his or her business if the project fails.
2.7 Risk Identification in Projects Belonging to MOE
The risk factors and sub-factors were identified in building projects through brainstorming and series of discussions among contractors, client, PROKOM and senior level management in PWD which have greater experiences in managing projects. Besides, the contractor ideas were also being used to generate ideas by using questionnaire survey form.
put forward all ideas about potential risk. The aim of this technique is to list a large number of potential risks across a wide range.
The major advantages of brainstorming are that groups can generate more ideas and information than individuals can, and that group involvement can increase commitment, motivation and satisfaction. However, there are barriers to the successful application of this technique. The difficulties with brainstorming include the selection of the appropriate experts and their number, bringing these experts together frequently enough to be of use to a dynamic project lifecycle.
Individual participants fear looking foolish, there may be problems arising from having people of varying seniority working together; for example juniors may be unwilling to put forward ideas for fear of damaging their prospects, while senior personnel may be equally reluctant to make wild suggestions that could damage their image or credibility. While questionnaire survey among contractors will give broad ideas that depending on the contractor classes and contract value.
2.7.1 Establishment of Risk Factors and Classification
2.7.1.1 Technical Risk
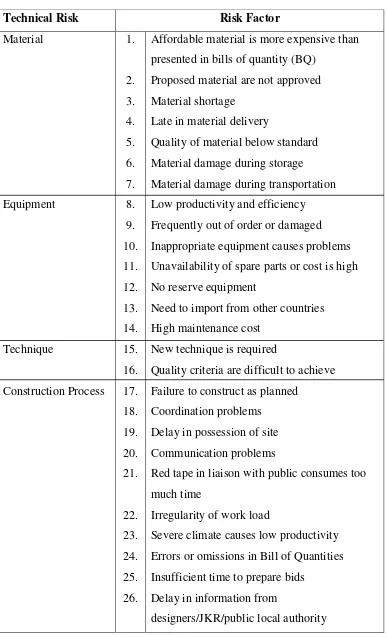
Delays are a major factor. Whatever the reason, delays almost invariably increase budget costs. Many events may have contributed to the delay, some which could have been foreseen and others which could not. Figure 2 and Table 2.4 illustrates thirty seven risk factors under technical classification. These risk factors were generated based on : a) an extensive literature review from the work of Akintola and Malcom (1997), Nabil and Saied (2000), Baloi and Price (2002), Creedy (2005), Prasanta (2001), Tang et al. (2007) and b) discussion with the experts who participated in the survey.
Figure 2.3 : Technical risk classification
Technical risk classification Material
Equipment Technique
Construction process Construction
site
Table 2.4 : Risk factor under the technical risk classification
Technical Risk Risk Factor
Material
Affordable material is more expensive than presented in bills of quantity (BQ)
Proposed material are not approved Material shortage
Late in material delivery
Quality of material below standard Material damage during storage Material damage during transportation Low productivity and efficiency Frequently out of order or damaged Inappropriate equipment causes problems Unavailability of spare parts or cost is high No reserve equipment
Need to import from other countries High maintenance cost
New technique is required
Quality criteria are difficult to achieve Failure to construct as planned
Coordination problems Delay in possession of site Communication problems
Red tape in liaison with public consumes too much time
Irregularity of work load
Severe climate causes low productivity Errors or omissions in Bill of Quantities Insufficient time to prepare bids
Delay in information from
Construction site
Project is threatened by hooligans No site investigation or boring log Inadequate site investigation
Errors in information of site investigation Unforeseen problems
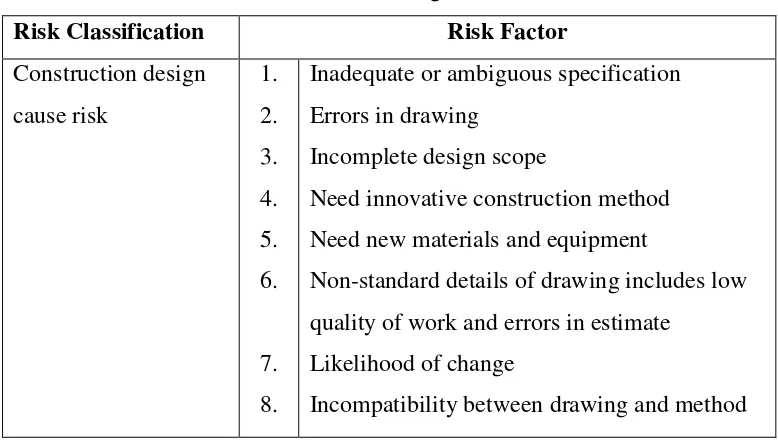
2.7.1.2 Construction Design Causes Risk
Table 2.5 : Construction design cause risk factors
Risk Classification Risk Factor
Construction design Need new materials and equipment
Non-standard details of drawing includes low quality of work and errors in estimate
Likelihood of change
Incompatibility between drawing and method
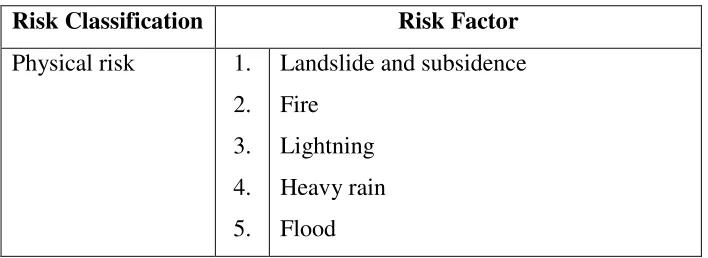
2.7.1.3 Physical Risk
Table 2.6 : Physical risk factors
Risk Classification Risk Factor
Physical risk 1. 2. 3. 4. 5.
Landslide and subsidence Fire
Lightning Heavy rain Flood
2.7.1.4 Financial Risk
Table 2.7 : Financial risk factors
Risk Classification Risk Factor
Financial risk 1.
Payment risk of completed work Slow payment by clients due to dispute Retention is not returned
Liquidated damage for delay Adequate payment for variations
Financial problems due to errors in estimating Loss due to default of contractor, subcontractor, supplier or client
Inflation
Exchange rate fluctuation
Local and national taxes are high
Bid and construction bond are fairly called Insufficient insurance
Labour cost is higher than predicted Material cost is higher than predicted
2.7.1.5 Personal Risk
a lack of planning and coordination;
poor communication between members of the project team;
failure to identify problems and institute necessary design and programming changes;
a lack of control over time and cost inputs.
The other factors that can contribute to personal risk are as shown in Table 2.8. These risk factors were generated based on: a) an extensive literature review from the work of Smith (2003), Perry and Hayes (1985), Baker and Reid (2005) and b) discussion with the experts.
Table 2.8 : Personal risk factors
Personal risk Risk Factors
Technician and labour 1. Frequent job change by skilled labour 2. Lack of skilled labour
3. Strikes and labour disciplines 4. Low productivity
5. Poor workmanship 6. Brawls and fighting
7. Use of illegal foreign labour 8. Gambling on site
9. Absenteeism
10. Unable to understand drawings 11. Communication problems
Subcontractor 12. Lack of funds to proceed with work (insolvency) 13. Lack of required technical skill
14. Unable to finish work on time 15. Low productivity
Personal risk Risk Factors
17. Subcontractor unable to afford adequate labour 18. Subcontractor takes jobs in several projects 19. Subcontractor abandons projects
Staff, foreman 20. Incompetence and lack of responsibility 21. Absenteeism
22. Brawls
23. Lack of experienced staff and foremen Engineer 24. Incompetence and lack of responsibility
25. Absenteeism 26. Brawls
27. Lack of experienced staff and foremen Consultant / JKR 28. Does not understand his role or duty
29. Poor construction method
30. Delays in materials and shop drawings approval 31. Communication and coordination problems 32. Dishonesty
33. Unaccountability of work
Client 34. Interference
35. Change orders
36. Client lacks managerial capability
37. Quality expected beyond standard and specs
2.7.1.6 Safety-Accident Risk
were low or no safety education / training, inadequate safety programs, lack of fire and electrical prevention procedures, lack of poor crisis preparedness (emergency plans) and
lack of upper management awareness are all within the list raised by the Chinese
respondents, while most risk factors faced by the Australians are related to site conditions
and environments (rather than people). Tang et al. (2007) defined that safety factor was
placed at third important project risks in his case study on Three Gorgeous Project in China.
Based on this previous literature review, there are five risk factors that were identified in building projects as shown in Table 2.9.
Table 2.9 : Safety-accident risk factors
Risk Classification Risk Factor
Safety-accident risk 1. Machine is not checked before operating There is no fence or protection net There is no fire protection system on site
2.7.1.7 Political and Regulation Risk
Table 2.10 : Political and regulation risk factors
Risk Classification Risk Factor
Political and regulation risk 1. 2.
War, revolution and civil disorder Requirement to use local labour Customs and import restrictions Unstable politics
Embargo
Long procedure for approval and permits Cost for corrupt government officials
2.7.1.8 Contractual Risk
Gosh and Jintanapakanont (2004) concluded that delay in solving contractual issues, delay in solving dispute, delay payment on contract and extras and change order were main factors that contributed under this risk. Theother risk factors under study are shown in Table 2.11.
Table 2.11 : Contractual risk factors
Risk Classification Risk Factor
Contractual risk 1.
Ambiguous clauses that have several meanings Work conditions differ from contract
Misinterpretation
2.7.1.9 Environmental Regulations Cause Risk
The risk factors under environmental regulations cause risk are shown in Table 2.12.
Table 2.12 : Environmental regulations cause risk factors
Risk Classification Risk Factor
Environmental regulations cause risk
1. 2. 3. 4.
Construction process causes pollution Waste treatment required by law Preserving historical finds
Local environment regulations obstruct construction process
2.8 Risk Analysis
2.8.1 Qualitative Analysis
Qualitative analysis uses words to describe the magnitude of potential impacts and the likelihood those impacts will occur. These scales can be adapted or adjusted to suit the circumstances and different descriptions may be used for different risks. Qualitative analysis may be used for the following reasons:
a) as an initial screening activity to identify risks which require more detailed analysis;
b) where this kind of analysis is appropriate for decisions; or
c) where the numerical data or resources is inadequate for a quantitative analysis.
Qualitative analysis should be informed by factual information and data when or if available. It is also more holistic and provides a systematic evaluation of a range factors and their interaction. Tools such as decision trees, heuristic analysis and fishbone diagrams provide a logical framework.
2.8.2 Quantitative Analysis
and completeness of the numerical values and the validity of the models used. Impacts may be determined by modeling the outcomes of an event or set of events or by the extrapolation from experimental studies or past data. Impacts may be expressed in terms of monetary, technical or human impact criteria.
2.8.3 Likelihood and Impact
One widely used method of prioritizing risks is through the use of risk scoring matrices that quantify the likelihood and consequence of occurrence. The scoring methodology can be tailored to fit the needs, complexity, or experience base of a project.
According to Visser and Joubert (2008)likelihood is classified as:
a) rare, b) unlikely, c) possible, d) likely or e) almost certain
The impact is classified as:
This classification will result in the development of a priority listing for evaluation and action that can be used to separating the acceptable risks from the unacceptable ones.
exposure. An example of a high risk to the project might be unexpected legislative changes.
The resulting rating of risk help the steering committee and project team to focus on treating the most important risks once analyzed, evaluated and prioritized. That is not as to say that risks may not re-emerge after treatment and that is why it is stressed that risk management is an iterative process throughout the life of the project.
There are more sophisticated tools available to assist with risk analysis and many include extensive numeric scales and algorithms. For very large and / or more complex projects, it is wise to investigate the use of these tools, although the approach above is a starting point and is easily explained to non-specialists. The approach above is just a suggested starting point.
2.9 Risk Evaluation
a) benefits are delayed or reduced b) timeframes are extended c) costs are advanced or increased
d) output quality (fitness-for-purpose) is reduced
Once this evaluation has been undertaken decisions then can be made. For example, a risk is acceptable in terms of extended timeframes, if the project is not tied strictly to set deadlines, but is not acceptable if it reduces the planned benefits or affects output quality. On the other hand, a project has fixed deadlines, then the decision might be made that the level of risk is acceptable in terms of reducing the quality of the outputs, with a view to enhancing quality after the initial deadline has been achieved. Once priorities are agreed, mitigation strategies must be developed and implemented for all unacceptable risks.
2.10 Risk Control
The intent of this step is to develop a strategy for managing the risks of the project. Choosing any form of treatment may in itself expose the project to additional risks associated with it. Care must be taken to ensure that the treatment strategy does not expose the project to greater risk than the original risk it was designed to treat.
iterative until the most effective treatment strategy or strategies are developed. The methods of managing risk are treatment; avoidance, reduction in the likelihood, reduction in the impact, transfer and acceptance or retention.
Risk mitigation or treatment actions should be cost efficient and effective in that they help reduce the risk exposure of the project. Conscious decisions need to be made regarding the wearing or transferring of certain risks as opposed to the costs of mitigation. For example; for serious risks, an extremely effective risk mitigation strategy could be justified in terms of its cost.
A portfolio of cost-effective risk mitigation actions forms part of the risk register for large and / or complex projects. Mitigation strategies to reduce the likelihood and impact of risks should be built into the budget and activities of the project and should be measured, comparing cost and benefits.
2.10.1 Avoidance
Risk avoidance involves avoiding the activity that exposes the project to the risk. For example, if the risk is associated with securing internal resources for the project team, then choosing to utilize the services of a contractor would avoid that risk. However, choosing to use a contractor in it brings risk to the project which would clearly need to be understood and assessed.
2.10.2 Reduction in the Likelihood
The reduction in the likelihood is a method of risk control where the project or its environment is changed to reduce the probability of a risk occurring. It can be one or a combination of this action:-
Undertaking additional investigation to better understand the existing conditions (geotechnical / survey)
Surveillance (inspectors) Applying internal controls
2.10.3 Reduction in the Impact
The reduction of risk impact can be done through some form of tactical response, such as preventative maintenance or individual design elements considerations. It is also can be formed of contingency planning, such as financial contingency, time contingency or disaster recovery plan.
2.10.4 Transfer
The use of insurance, where it is applicable, may be an appropriate method of risk transfer. Another method is to transfer the risk through some form of contractual obligation. It must be remembered however, that no one will willingly accept a risk without some form of compensation for doing so. Whilst it is obvious that insurance carries a cost, the transference of a risk through contractual obligations will also inevitably increase the cost of the contract.
2.10.5 Acceptance or Retention
must include sufficient contingency (time and money) to cover the eventuality. It may be possible for a risk to have a number potential treatments equally suitable but varying in cost. The selection of a final treatment must be made on a “value” basis. The cost of managing a risk should be commensurate with the benefits gained.
2.11 Risk Monitoring
Risk monitoring systematically tracks and evaluates the performance of risk-handling actions. It is part of the project management function and responsibility and should not become a separate discipline. Essentially, it compares predicted results of planned actions with the results actually achieved to determine status and the need for any change in risk handling actions. To ensure that significant risks are effectively monitored, risk-handling actions should be reflected in project planning and scheduling.
Identifying these risk handling actions and events in the context of Work Breakdown Structure (WBS) elements establishes a linkage between them and specific work packages, making it easier to determine the impact of actions on cost, schedule, and performance. The functioning of the project team is crucial to effective risk monitoring. They are the front line for obtaining indications that risk-handling efforts are achieving the desired effects and are responsible for monitoring and reporting the effectiveness of the handling actions for the risks assigned.
process is iterative throughout the life of the project. Regular reporting, at agreed intervals, of risk status must be conducted by the Project Manager and must be required by the Project Committee.
2.12 Risk Factors in Building Construction Projects
There were hundred and twenty four risk factors established under different categories of risks. These risk factors were established from literature review and discussion among the experts. Appendix A shows the risk factor list established under this study.
2.13 Summary
CHAPTER 3
METHODOLOGY
3.1 Introduction
The research methodology will explain how the objectives of this study are achieved. This study was carried out based on literature review, series of discussions and questionnaire survey. Data collection from the questionnaire survey was analyzed using the descriptive statistics and average index and this was followed by some discussions, conclusions and recommendation.
3.2 Objective Identification
identify the best methodology to be adopted. Two major sections consisting of questionnaire survey and interviews has been selected as a research methodology.
The literature review was carried out to provide the background information for the risk factors in building construction projects. From the literature review, the issues for this study will be highlighted and identified.
3.3 Literature Review
In achieving the objectives of this study, the information regarding the importance of adopting risk management, the current practice of risk management and risk management process especially in PWD were obtained from various sources such as series of discussions, books, journal articles, conference, internet and others. This information was used to develop the questionnaire survey in order to collect data from the targeted respondents.
3.4 Data Collection
Responses from questionnaires were then compiled and analyzed. Data collected from different questions were gathered to answer different objectives. Analysis was done by using the descriptive statistics.
3.5 Discussion with Experts
Discussion sessions were made through face to face conversation, telephone conversation interviews and electronic interview sessions via email and internet services. The respondents were from the PROKOM and other senior level management, consultants, contractors and client (MOE). The questions were designed to get the overview of risk management in PWD and establishment of risk factor in building projects belonging to MOE.
3.6 Questionnaire Survey
3.6.1 Section A: Demographic
Section A solicited demographic about the company profile, respondents profile, project details and general knowledge about risk.
3.6.2 Section B: Identification of Level of Risk
This section was to obtain the information on factors that contribute to the risks in building construction projects from the perspective of contractors. There were nine categories with hundred and twenty six factors of risks constructed into structured questions. Respondents were asked to review and indicate the likelihood of these risks as rare, unlikely, possible, likely or almost certain and the level of impact on each risk that would result in risk rating as low, medium, high or extreme based on risk matrix. The impact scale represents the following rating:
3.6.3 Section C: Develop and Implement Risk control
This section was design to focus on identifying, assessing and implementing measures to control risks. The respondents were asked to tick the risk treatments based on the scale below :
[1] Avoid risk = by not proceeding with the aspect that may suffer the risk event.
[2] Reduce likelihood = where the project or its environment is changed to reduce the probability of a risk occurring.
[3] Reduce impact = where action is taken to minimise the impact of a risk if it occurs. Treatment includes contingency planning that should address significant risk areas where preventive action is either unavailable or the cost of prevention is prohibitive.
[4] Risk transfer = where the responsibility for a risk is transferred to another party such as a supplier or insurer.
[5] Acceptance & retention = risks that are currently acceptable and do not require treatment, but will be kept under review.
3.7 Questionnaire Distribution
3.8 Data Analysis
The survey feedbacks were processed using the Microsoft Excel and SPSS V.16. It was divided into two groups of data, the level of risk and risk treatment for each risk factor which had been analyzed separately using descriptive statistics i.e. frequency and average index analysis.
3.8.1 Level of Risk Analysis
The risk matrix is used in this study as it provides a structured way to identify, prioritise and manage the level of risks. The first phase of analysis is to calculate the likelihood and impact that the risk will take place which is called risk significant index. In the second phase, the level of risk is determined by using the 5x5 matrix scales used by the Australian/New Zealand Standard, AS/NZS 4360 and need to be converted into numerical scale (Table 3.1). The third phase is to prioritize the risk based on the second phase assessment.
The risk significant index developed by Shen (2001) was used in this study. With respect to the impact of risk, the significant score for each risk assessed by each respondent is calculated using Equation (1).
k ij ij k
ij
where; valid feedback questionnaire, assessed by respondent j
ij significance index score and used to rank among all risks.
k
Table 3.1: Matrix for the calculation of the risk significance index RISK IMPACT, β
LIKELIHOOD, α
Questionnaire choice
Insignificant Minor Moderate Major Severe Questionnaire choice
3.8.2 Risk Treatment Analysis
The average index method was used to analyse the risk treatment that suitable to the objective of this study. The data are stimulated using Microsoft Excel for instance in average index calculation through Equation (3).
Average index = ×
µ = weighting given to each risk control by respondent (1 to 5)
n = frequency of the respondents
N = total number of respondents
1
µ = frequency of “avoid risk” response 2
µ = frequency of “reduce likelihood” response 3
µ = frequency of “reduce impact” response 4
µ = frequency of “risk transfer” response 5
µ = frequency of “acceptance and retention” response
3.9 Summary
CHAPTER IV
ANALYSIS AND DISCUSSION
4.1 Introduction
The chapter presents the data analysis and finding of the study. Data were analyzed using the previous method as discussed in Chapter III.
4.2 Early Analysis
high number of unanswered questions. This was resulted in an effective return rate of 48% (Figure 4.1).
Questionnaire Distribution
48%
50%
2%
returned questionnaire unreturned questionnaire unanswered questionnaire
Figure 4.1: Questionnaire distribution and responses
4.2.1 Company Profile
4.2.1.1 Classification of Company
The classification of contractor’s company feedback comprise of 3 from B, 10 from C, 8 from D and 7 from E (Figure 4.2).
Classification of Company (PKK)
3
10
8 7
B C D E
Figure 4.2: Classification of company
4.2.1.2 CIDB (Construction Industry Development Board) Classification Grade
CIDB classification grade
2
2
9
1 14
G7 G6 G5 G4 G3
Figure 4.3: CIDB classification of grade
4.2.1.3 Number of Years in Business
Number of Years in Business
25%
50% 7%
4%
14%
0 - 5 6 - 10 11 - 15 16 - 20 > 20
Figure 4.4 : Number of years in business
4.2.2 Respondent Profile
4.2.3 Project Details
Figure 4.5 and Figure 4.6 show the type of contract and project that the respondent involved in. 22 respondents involved in traditional type of contract and the rest is 3 (turnkey), 1 (design and build and 2 (others). Out of the total number of projects, 15 were teachers quarters project, 11 were additional school building projects and 2 were others. This show that most of the projects undertaken by the PWD were based on traditional contract and contractors have to indicate the risk factor in the questionnaire survey form based on the type of contract awarded.
22
Traditional Design & Build Turnkey Others
Type of Contract
Figure 4.5 : Type of contract
11
Figure 4.6 : Type of project
4.2.4 General Knowledge about Risk
Figure 4.7 : Risk existence
Figure 4.9 : Risk important
Figure 4.10 : Risk identification
Risk identification
4.3 Detail Analysis
The objective of conducting the detail analysis is to establish the risk factors in building projects which identified from the literature review, ranking the level of risk according to their risk significance score and identify the risk mitigation based on frequency analysis method. The obtained data were arranged and analyzed using the descriptive statistics which is relevant to the objectives of the study. The results are presented as below.
4.3.1 Risks Factors in Building Projects Belonging to MOE
Table 4.1 : Risk classification
- Technician and labour - Subcontractor
5 Construction design cause 6 Political and regulation
7 Financial
8 Contractual
9 Environmental regulations cause
4.3.2 Level of Risk for Each Risk Factor
From the study, the writer concentrated on the top 10 risk factors that have the most important influenced on the project delivery. Among the 124 risk factors, the highest mean of 2.54 was the material factor which under the technical risk classification. Affordable material is more expensive than presented in bills of quantity (BQ) was found to have significant impact on the project particularly in construction stage that can be realistically predicted at the time. This happened due to the material price escalation when the unprecedented oil crisis was hit hardly all over the nation. As a result many contractors could not complete their contracts on time. Invariably, most materials would increase in price due to inflation and other reasons.
Another risk factor that affected to the project performance was heavy rain under the physical risk classification which is ranked second with 2.34 mean. This problem was due to the projects awarded at end of 2007 whereby heavy rain occurred during the monsoon season and most of the contractors were given extension of time under that reason.
For sub contractors especially nominated sub-contractors (for electrical and mechanical works) the opportunity of many projects launched by the government had made them eager to have many contracts at a particular time. They tend to grab many projects because of limited nominated subcontractors throughout Malaysia. This has caused delayed to the project and certain works were not properly done by the workers. As a result repetitive works have to be done and these have negatively impact to the main contractor’s physical progress.
Table 4.2 : The level of risk for each risk factor
Rank Risk classification Risk factor Mean Std. Deviation
1 Technical risk - material Affordable material is more expensive than
presented in bills of quantity (BQ) 2.5357 1.19264
2 Physical risk Heavy rain 2.3357 1.54061
3 Financial risk Material cost is higher than predicted 2.1500 1.29572
4 Personal risk - subcontractor Sub contractor takes jobs in several projects 2.1214 1.24881
5 Financial risk Retention is not returned 2.0714 1.82997
6 Technical risk - material Late in material delivery 1.9714 1.30153
7 Personal risk - subcontractor Lack of funds to proceed with work 1.9286 1.13948
8 Personal risk – technician and labour Lack of skilled labour 1.9143 0.94818
9 Personal risk - subcontractor Subcontractor unable to afford adequate labour 1.8714 1.53209
10 Personal risk - subcontractor Unable to finish work on time 1.8643 1.12882
11 Financial risk Adequate payment for variations 1.8500 1.44081
12 Technical risk - material Material shortage 1.8286 1.54125
13 Personal risk – technician and labour Frequent job change by skilled labour 1.7929 1.17440
14 Technical risk – ground condition Unforeseen problems 1.7786 1.69473
15 Financial risk Payment risk of completed work 1.7643 1.09687
16 Technical risk - material Quality of material below standard 1.7571 1.83251
17 Financial risk Financial problems due to errors in estimating 1.7429 1.35193
18 Financial risk Slow payment by clients due to dispute 1.7214 1.22606 6
Rank Risk classification Risk factor Mean Std. Deviation
19 Construction design causes risk Errors in drawing 1.6714 1.45471
20 Personal risk – technician and labour Poor workmanship 1.6500 1.21914
21 Technical risk – construction process Severe climate causes low productivity 1.6429 1.19549
22 Personal risk - subcontractor Problems in coordination 1.6286 1.44501
23 Personal risk - subcontractor Low productivity 1.5357 1.04994
24 Personal risk – technician and labour Low productivity 1.5000 1.08798
25 Technical risk – construction process Red tape in liaison with public services consumes
too much time 1.5000 1.10822
26 Personal risk - subcontractor Lack of required technical skill 1.4929 1.04489
27 Technical risk – construction process Delay on information from designers / JKR / public
local authority 1.4786 1.22243
28 Technical risk – construction process Coordination problems 1.4571 1.09254
29 Technical risk – construction process Delay in possession of site 1.4571 1.14421 30 Technical risk – construction site Construction site is adjacent 1.4500 1.08815
31 Financial risk Inflation 1.4357 1.23415
32 Political and regulation risk Cost for corrupt government officials 1.4286 1.33413 33 Construction design causes risk Non-standard details of drawing includes low qualiy
of work and error in estimate 1.4143 1.29835
34 Personal risk – technician and labour Unable to understand drawings 1.4143 1.05259
35 Personal risk – technician and labour Communication problems 1.4071 1.13853
Rank Risk classification Risk factor Mean Std. Deviation
37 Personal risk – technician and labour Strikes and labour disciplines 1.4000 1.14310
38 Physical risk Lightning 1.3929 1.14760
39 Technical risk - technique New technique is required 1.3786 1.47607
40 Financial risk Exchange rate fluctuation 1.3786 1.21879
41 Construction design causes risk Likelihood of change 1.3571 1.16537
42 Personal risk – engineer Lack of experienced staff and foreman 1.3429 1.12725
43 Technical risk - equipment Low productivity and efficiency 1.3357 1.26263
44 Personal risk – staff, foremen Incompetence and lack of responsibility 1.3357 1.06952 45 Construction design causes risk Incompatibility between drawing and method 1.3286 1.14337 46 Technical risk – ground condition Errors in information of site investigation 1.3214 1.20412
47 Technical risk – construction site Access problems 1.3214 1.37527
48 Technical risk – equipment Inappropriate equipment causes problems 1.3143 1.20299
39 Political and regulation risk Customs and import restrictions 1.3071 1.33941
50 Safety-accident risk There is no fire protection system on site 1.3071 1.15788
51 Technical risk – equipment High maintenance cost 1.3000 1.08662
52 Technical risk – material Proposed materials are not approved 1.2929 1.04489
53 Technical risk – construction process Insufficient time to prepare bids 1.2929 1.25961
54 Political and regulation risk Embargo 1.2857 1.26775
55 Personal risk – subcontractor Subcontractor abandons projects 1.2857 1.39250
56 Technical risk – construction process Failure to construct as planned 1.2786 1.32703 7
Rank Risk classification Risk factor Mean Std. Deviation
57 Contractual risk Unfair or unreasonable stipulation 1.2714 1.07388
58 Personal risk – client Change orders 1.2643 1.01843
59 Personal risk – staff, foremen Absenteeism 1.2571 1.11137
60 Financial risk Labour cost is higher than predicted 1.2536 1.19085
61 Financial risk Loss due to default of contractor, subcontractor,
supplier or client 1.2500 1.13219
62 Technical risk – equipment Unavailability of spare parts or cost is high 1.2500 1.13219
63 Technical risk – equipment Frequently out of order or damaged 1.2429 1.15259
64 Political and regulation risk Long procedure for approval and permits 1.2286 1.02374 65 Personal risk – technician and labour Use of illegal foreign labour 1.2286 0.81779
66 Physical risk Flood 1.2214 1.21270
67 Technical risk – construction process Communication problems 1.2214 1.16662
68 Technical risk – construction site Work hours are limited 1.2071 1.26781
69 Construction design cause risk Need innovative construction method 1.2000 1.13660
70 Technical risk – ground condition Inadequate site investigation 1.2000 1.22202
71 Physical risk landslide 1.1929 1.41890
72 Technical risk – construction process Irregularity of work load 1.1857 1.02982
73 Personal risk – client Quality expected beyond standard and specs 1.1857 1.18250
74 Contractual risk Ambiguous clauses that have several meanings 1.1714 0.97785
75 Personal risk – consultant / JKR Delays in materials and shop drawings approval 1.1714 1.28664
7