VOL. 7, NO. 2, pp. 146 – 150, April 2017 Submitted January 2017; Revised February 2017; Accepted March 2017
Species and Abundance of Sea Urchins (Diadematidae)
on Different Environmental Pressure Conditions
Pratama Diffi Samuel 1
*, Dewa Gede Raka Wiadnya 2
, Bagyo Yanuwiadi 1
1
Department of Post Graduate Program, Study Program of Environmental Resources Management and Development, Brawijaya University, Malang, Indonesia
2 Faculty of Fisheries and Marine Sciences, Brawijaya University, Malang, Indonesia
ABSTRACT
Genetic diversity of sea urchin are very high; there are no two organisms of the same species that are exactly alike. Dense aggregation of sea urchin is responsible for the destruction of marine algae communities on coral reef ecosystem. The purpose of this study is to identify the species and abundance of sea urchins at different environ -mental conditions, to analyze the influence of water conditions on the abundance of sea urchins and to analyze the role of sea urchin as water quality and abiotic environmental conditions bio-indicators. Data collection proce-dures carried out in three stage that are: assessment of the status of coral reefs, sea urchins sampling and analysis of data. Data condition of coral reefs is drawn using methods kick frequency. Urchin abundance data retrieval is done by timed swims or snorkeling and species of sea urchins seen through genetic approach, by DNA sequenc ing. Identify the types of sea urchins in this study conducted with the gene fragment sequences Cytochrome Oxi -dase subunit I (COI). Stages isolation of DNA-based procedures uses Gsync DNA Extraction Kit from Geneaid. The species that identify in this study is Diadema setosum. Location with high environmental pressures has a low quality of coral reef ecosystems and has a great abundance of sea urchins. This proves that the water environmen -tal conditions greatly affect the abundance/density of sea urchins. In locations with relatively low environmen-tal stress or a sheltered environment the abundance of sea urchins is low.
Keywords: Diadema, coral reef, genetic, abundance, environment
Sea Urchins are marine invertebrates that are classi-fied in the phylum Echinoderms, functional in ecology, and having significant economic value [1]. The organ-ism in this Echinoidea class has a variety of large species and abundant, as well as be determinants of abundance and to scatter herbs seas in shallow sea wa-ters [2].
Genetic diversity of sea urchins is very high. This diversity it is evidenced from the data provided by De-oxyribo Nucleic Acid mitochondrial (mtDNA) or nu-clear DNA (nDNA) analysis among families or species of sea urchins. Based on such diversity as there are no two organisms of the same species are exactly alike,
be-cause each species has its genetic material [3].
Dense aggregation of sea urchins is responsible for the destruction of marine algae communities and the destruction of seagrass communities in some coastal ar-eas in the tropics and subtropics [4]. During the feed-ing activity, some sea urchins grind calcium carbonate in large proportions in addition to growing algae att-ttached to the reef, so it has a major role in the carbon
cycle of organic and inorganic in coral reef ecosystems [5].
The relationship between the abundance of sea urchins with coral reef ecosystems that are less healthy need for further study to determine a correlation if one exists [6]. Sea urchin are one of the key species for
JTLS | J. Trop. Life. Science 146 Volume 7 | Number 1 | January| 2017
INTRODUCTION
*Corresponding author: Pratama Diffi Samuel
Department of Post Graduate Program, Study Program of Environmental Resources Management and Development, Brawijaya University
Jalan Veteran, Malang, Indonesia 65145 E-mail: [email protected]
How to cite:
coral reef communities. This is because the sea urchin is one of the animals controlling populations of mi-croalgae. The existence of sea urchins in an ecosystem can not be separated from the influence of abiotic envi-ronmental factors on these waters [7]. The purpose of this study is to identify the type and abundance of sea urchins living at different aquatic conditions and envi-ronments, to analyze the influence of water conditions on the abundance of sea urchins and to analyze the role of sea urchins as bio-indicators on aquatic environ-ments.
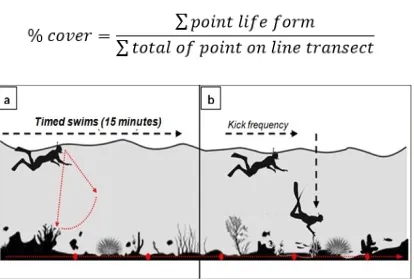
Field data capture (ground check) is performed as one of the input data in interpreting the extent of the environmental pressures affect the diversity and abun-dance of sea urchins. Data collection procedure carried out in three stages, that: assessment of status (monitor-ing) of coral reefs, sea urchins sampling and analysis of data. Data condition of coral reefs is drawn using methods Kick frequency with swimming or snorkeling over the reef flats. Kick frequency is a modification of the method of data collection coral reefs by Point In-tercept Transect (PIT), where researchers note types (lifeform) reef every 3-4 times pedaling legs. Coral growth form (lifeform) in this study include live coral, dead coral, the shape of the substrate, algae and other substrates.
Urchin abundance data retrieval is done by survey cruising (timed swims or snorkeling) at each study site. Timed swims or snorkeling on the coral reef and swim along parallel to the shoreline for 15 minutes, with a standard swimming speed (approximately 20 meters per minute). Then note the number of individuals urchins are found along the distance. Illustration of sea urchin data collection is in Figure 1.
Formulation for calculated the percentage of live coral cover, using the following calculation [8]:
Figure 1. Timed swims and kick frequency
Abundance is the number of individuals in a particular area. Abundance calculated by the formula:
Type or variety of sea urchins is seen through ge-netic approach, by techniques of DNA analysis. DNA analysis is done through a phase sample extraction, PCR, sequencing, BLAST (Basic Local Alignment Search Tool) and phylogenetic analysis.
Gen Cytochrome Oxidase subunit I (COI) is a mi-tochondrial protein-coding DNA that has been widely used as a means of identification of animal species. In this study, the primers used are: [9]
COI531F:
5’-ATGATTTCTCATGTAATTGC3’; COI874R:
5’-AGTACAACGTCTATAGATGA-3’
The study was conducted at three different loca-tions in which environmental pressure varies. Criteria location are (1) a protected area or a low-pressure en-vironment, (2) areas with environmental pressures moderate and (3) areas of high environmental pressure. Regions with low pressure have been sheltered in this study is the Pari Island, Kepulauan Seribu National Park and Menjangan Island, West Bali National Park. Areas with medium pressured, have a tourism area that the Pasir Putih Beach in Situbondo and Sendang Biru Beach in Malang. Then the area with high environmental pressures is areas that have a high number and density of population, the Gili Ket-apang island in Probolinggo and Mandangin island in Sampang. Coordinates of sampling points in each study site can be seen in Table 1. Data population density and number of visit tourism on research location in Table 2.
Percentage of coral reef and algae
The average percentage of live coral cover were the highest obtained at the second location is Menjangan Island, with a value of 65.00%. Pari Island, amounting to 42.50%; Pasir Putih Beach tourist area, Situbondo, 40.00%; Sendang Biru Beach, Malang, amounting to 34.17%; Gili Ketapang island, Probolinggo, amounting to 20.83%; and location with average coral cover percentage is lowest that Mandangin Island with a value of 19.17%.
MATERIALS AND METHODS
RESULTS AND DISCUSSION
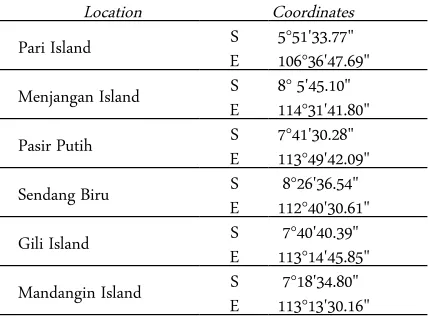
Table 1. Coordinates of sampling points in each study
Location Coordinates
Pari Island S 5°51'33.77" E 106°36'47.69"
Menjangan Island S 8° 5'45.10" E 114°31'41.80"
Pasir Putih S 7°41'30.28" E 113°49'42.09"
Sendang Biru S 8°26'36.54" E 112°40'30.61"
Gili Island S 7°40'40.39" E 113°14'45.85"
Mandangin Island S 7°18'34.80" E 113°13'30.16"
Table 2. Data population density and number of visits tourism
Location Area
Pasir Putih 18.09 223 162,341 Sendang Biru 27.39 302 8,800 Gili Ketapang 0.61 15,508 0
Mandangin 1.65 11,861 0
Table 3. Coral reef percent cover in location study
Location % cover of coral reef
1 2 3 4 Average
Pari 43.3 43.3 40.0 43.3 42.50 Menjangan 63.3 66.7 66.7 63.3 65.00 Pasir Putih 36.7 40.0 43.3 40.0 40.00 Sendang Biru 33.3 33.3 36.7 33.3 34.17 Gili Ketapang 23.3 20.0 23.3 16.7 20.83 Mandangin 20.0 20.0 16.7 20.0 19.17
Table 4. Algae percent cover in location study
Location Algae (%)
1 2 3 4 Average
Pari 13.3 16.7 13.3 13.3 14.17 Menjangan 10.0 10.0 13.3 10.0 10.83 Pasir Putih 16.7 23.3 20.0 16.7 19.17 Sendang Biru 23.3 26.7 26.7 23.3 25.00 Gili Ketapang 36.7 36.7 30.0 30.0 33.33 Mandangin 33.3 36.7 33.3 36.7 35.00
Table 5. Number of correlation between coral and algae Coral reef (%) Algae (%)
Coral reef (%) 1
Algae (%) -0.89 1
The most dangerous average percentage of algae is in the sixth location, Mandangin island, with a value of 35.00%. Gili ketapang island, as much as 33.33%; area tourism Pasir Putih beach, as much as 19.17%; Sen-dang Biru beach, as much as 25.00%; Pari island, as much as 14.17%; and the location with an average closing the percentage of algae with the lowest is the island with a value of Menjangan island reached 10.83%.
Correlation between coral and algae is negative; it is portrayed between the two is an inversely propor-tional relationship. In accordance with the results of the research showed that in locations that have a high percentage of coral cover some algae would be low, otherwise in places where the percentage of coral cover is low, some algae are high.
Identify the types of sea urchins in this study con-ducted with the gene fragment sequences Cytochrome Oxidase subunit I (COI). Stages isolation of DNA-based procedures uses Gsync DNA Extraction Kit from Geneaid.
In this study, the process of DNA sequencing per-formed at First Base Malaysia, and the sequence data was obtained in the form of the nucleotide sequences of the form file with the extension (.ab1 and .fas); which each contain DNA sequences (Revers and For-ward). The data file then inserted into the analysis phase by using software Bioedit and Mega.
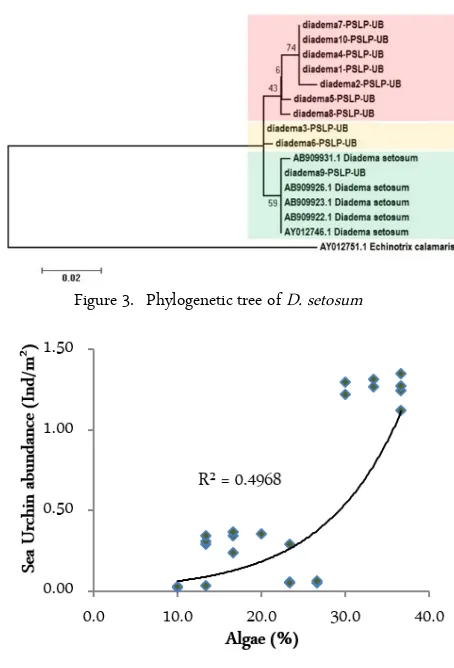
After the Blast or confirmation of these species was completed, a phylogenetic analysis using the neighbor-joining, where the calculation matrix genetic distance method Kimura-2 parameter is implemented on pairwise distance calculation in the program Mega (Molecular Evolutionary Genetics Analysis) software version 5 [10]. Statistical confidence of the two meth-ods was evaluated using test bootstrap 1000 replica-tions. Phylogenetic analysis intended to determine kin-ship or closeness between species existing samples with the identification results from previous studies.
Phylogenetic analysis was done by comparing the sample sequence with the sequences that exist in the genebank. It aims to study the evolutionary relation-ships between organisms or genes from a taxonomic unit. Phylogenetic or kinship is crucial to note as the basis of classification of organisms. The analysis process begins by taking ten of Diadema setosum DNA sequences in Genebank and the DNA sequences of the type Echinotrix calamaris as outgroup sample types. Then in the form fasta file is processed using the MEGA program, the method of Kimura. The results of
Figure 2. Diadema setosum
Table 6. The density of sea urchins in location study
Location Density of Sea Urchins (Ind/m
2
)
1 2 3 4 Average
Pari 0.29 0.35 0.31 0.34 0.32 Menjangan 0.03 0.02 0.04 0.03 0.03
Pasir Putih 0.37 0.29 0.36 0.24 0.31 Sendang Biru 0.06 0.07 0.05 0.05 0.06 Gili Ketapang 1.12 1.35 1.22 1.30 1.25 Mandangin 1.31 1.25 1.27 1.27 1.28
Table 7. Number of correlation between algae and sea urchin Algae (%) Sea urchin (Ind/m2)
Algae (%) 1
Sea Urchin(Ind/m2) 0.82 1
Table 8. Calculation of analysis variation ANOVA
Source of
Variation SS df MS F count P-value F crit
Location 6.54 5 1.31 507.91 1.04 2.77
error 0.05 18 0.00 Total 6.59 23
phylogenetic analysis of ten sequences that compared with similar sequences in Genebank showed in the phylogenetic tree in Figure 3.
The density of sea urchins
The density of sea urchins in each study site at each station ranged from 0.03–1.28 ind/m2. The highest densities are in densely populated areas with the per-centage of coral cover is low and a large proportion of algae. Conversely, the lowest density is in a protected area is a national park with the coral cover proportion of the high and low proportion of algae.
The correlation between the densities of sea urchins with a percentage of algae are positive; this shows the proportional relationship between the two. The results revealed that in locations with a high abundance of sea
Figure 3. Phylogenetic tree of D. setosum
Figure 4. Regress analysis of sea urchin abundance with algae percentage
urchins, the percentage value of algae in these sites is also high.
Sea urchins are herbivores organism whose life is strongly influenced by the presence of a source of food. The presence of sea urchins determines the abundance and distribution of marine plants like algae in shallow marine waters [2]. There is an adamant correlation be-tween the density of sea urchins and habitats that con-tain algae or a combination of rock and algae [12]
The causal link between the abundance of sea urchins with algae percentage can be calculated by re-gression analysis. The rere-gression analysis as the study of the dependence of one variable (dependent variable) to one or more other variables (explanatory variables) with the aim to make predictions average population or the value of the dependent variables [13].
These values show the dependency relationship be-tween the abundance of sea urchins on the proportion of algae is quite strong. The greater the percentage of algae will be followed by an increase in the number of the abundance of sea urchins in each study site.
to determine differences in the average of two or more groups of observed data, and can also be used as a test of the hypothesis.
In this experiment, the test procedure used one-way ANOVA analysis of variation (density urchins) by a factor (the difference between locations of the data). The results of analysis calculations obtained the F-count value (507.91) over the F-table (2.77), with alpha (α) or the boundary of the biggest mistakes that can be received by 0.05 (5%) and the P-value less of alpha (<0.05). Based on these values, the alleged (H0) is re-jected, which means differences in the location of a sig-nificant effect on the density of sea urchins.
Species sea urchins were found at each study site with different environmental stress conditions showed no distinct diversity. The locations of the data and samples of sea urchins that has been done, is dominated by a type of sea urchin D. setosum.
The abundance of sea urchins in six locations to collect data under different environmental stress conditions showed significantly different values. This proves that the water environmental conditions greatly affect the abundance/density of sea urchins.
Based on the value of the density of sea urchins in each study site, can be interpreted that the presence of sea urchins can be used as indicators of the quality/condition of the water environment, especially the coral reef ecosystem.
Authors sincerely thank to Research Group of Aquatic Biofloc, Faculty of Fisheries and Marine Science and Study Program of Environmental Resources Management and Development, Brawijaya University.
1. Lang C, Schroeter SC (1976) Change in sea urchin popu-lations after the destruction of kelp beds. Marine Biology
36: 321-326. doi:10.1007/BF00389193.
2. Lawrence JM (1975) On the relationship between marine plants and sea urchins. Oceanogr. Oceanography and Ma-rine Biology - An Annual Review 13: 213-286.
3. Hamid A (2007) Keragaman Genetik Bulu Babi (Echi-noidea). Jurnal Biota 12 (2): 131–135.
4. Moningkey R (2010) Pertumbuhan populasi bulu babi (Echinometra mathaei) di perairan pesisir Kima Bajo Kabupaten Minahasa Utara. Jurnal Perikanan dan Kelau-tan 6 (2): 73-78.
5. Satyawan N (2013) Feeding behavior and bioerosion: the ecological role of the rock boring urchin, Echinometra mathaei in Okinawa reef flat. Aquatic Science and Man-agement 1 (1): 10-16.
6. Supono, Arbi UY (2012) Kelimpahan dan keragaman Echinodermata di Pulau Pari, Kepulauan Seribu. Jurnal Ilmu dan Teknologi Kelautan Tropis 4 (1): 114-120. 7. Anwar, Chairul et al. 2015. Bioekologi bulu babi
(Echi-noidea) di perairan laut teluk dalam desa malang rapat ke-camatan gunung kijang Kabupaten Bintan. Tesis. Univer-sitas Maritim Raja Ali Haji.
8. English S, Wilkinson CR, Baker V (1994) Survey manual for tropical marine resources. ASEAN-Australia Marine Science Project: Living Coastal Resources. http://epub-s.aims.gov.au/. Accessed: January, 2017.
9. Chow S, Konishi K, Mekuchi M et al. (2016) DNA bar-coding and morphological analyses revealed validity of Diadema clarki Ikeda, 1939 (Echinodermata, Echinoidea, Diadematidae). ZooKeys 585: 1–16. doi: 10.3897/zookeys. 585.8161.
10. Tamura K, Stecher G, Peterson D et al. (2013) MEGA6: Molecular Evolutionary Genetics Analysis version 6.0. Molecular Biology and Evolution 30 (12): 2725-2729. doi: 10.1093/molbev/mst197
11. Langdon MW, van Keulen M, Pailing EI (2013) Distribu-tion, abundance and bioerosion of the grazing sea urchin Echinometra mathaei at ningaloo marine park, western australia. Journal of the Royal Society of Western Aus-tralia 96: 19.
12. Gujarati DN (2006) Essential of econometrics. New York, USA, McGraw-Hill.
JTLS | J. Trop. Life. Science 147 Volume 7 | Number 2 | April| 2017
ACKNOWLEDGMENT
REFERENCES CONCLUSION