Analysis of Land Transport Comparison with Water
Transport for Coal Transportation
Arif Fadillah[1], Shanty Manullang[2], Muhammad Kurniawan [3], Putra Pratama [4] 1,2,3,4Department of Naval Architecs, Faculty of Ocean Engineering, Darma Persada University
Jl. Taman Malaka Selatan, Jakarta 13450 Indonesia E-mail: [email protected]
Abstract—Coal is one of the most abundant energy resources in Indonesia. At present, coal in Indonesia is not only an export commodity producing foreign exchange, but also began to be used as a source of energy to replace oil and natural gas. Coal demand is still high for export and domestic needs, coal production in one area of the Province of South Kalimantan will be increased from 8,000,000 tons / year to 10,000,000 tons / year.Increasing the amount of production requires appropriate transportation so that production can be achieved. The calculation of the comparison of coal transportation starts from the transport capacity, the capacity of the freight transportation based on the graph of the travel schedule,Land transportation used is a 30 ton capacity truck and the water transport used is a 180 feet barge with a capacity of 1,000 tons. Based on the results from the analysis, land transportation production is 8,466.120 tons. The amount of production cannot be increased because the capacity of the cargo has been maximal and the number of queues of vehicles is tide. Based on the results of calculations, the
best transportation for coal transportation is water
transportation.
Keywords—Coal; Transport Capacity; Comparison Transportation; Coal Transportation.
I. INTRODUCTION
Coal is one of the most abundant energy resources in Indonesia. At present, coal in Indonesia is not only an export commodity producing foreign exchange, but also began to be used as a source of energy to replace oil and natural gas. Increasing demand for coal in the country is expected to increase coal production in the coming years. Kalimantan Island is the largest coal producer in Indonesia as seen from the amount of its reserves which reaches ± 16,627 million tons, while the amount of coal reserves in Sumatra Island is ± 13,284 million tons. On Borneo Island there are 4 coal-producing provinces, namely: Central Kalimantan, South Kalimantan, East Kalimantan, and North Kalimantan. South Kalimantan Province is the second largest producer after East Kalimantan (Lakin Minerba, 2017). Coal transportation in this area uses water transportation and land transportation. The water transportation used is a 180 feet drag barge with a capacity of 1,000 tons and transported by river as far as 29 km. The land transportation used is a truck with a capacity of 30 tons. The river used as a transportation route is the normalization of the dead river called Sungai Muning. Coal is transported from the starting point at the Upper Terminal and
transported to the Lower Terminal. Coal production in this region will be increased to meet domestic coal demand and export needs. Coal production will be increased from 8,000,000 tons / year to 10,000,000 tons / year. From this increase in production will be carried out the calculation of the transport capacity used, namely land transportation with water transport, to be carried out in comparison so that it can be known which transportation is more efficient to increase coal production in the region.
II. METHODOLOGY
A. Thought Flow Chart
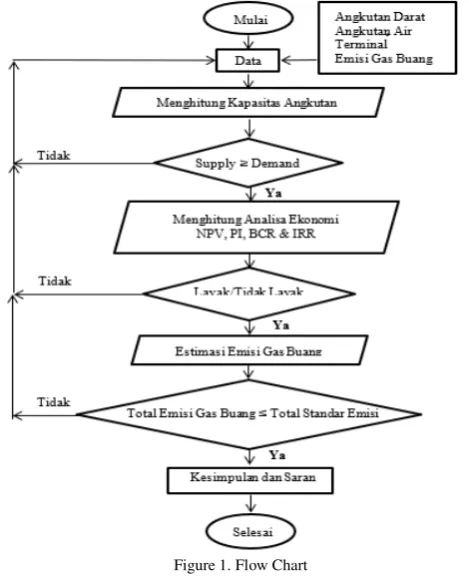
Analysis of coal transport capacity is carried out by comparing the transport capacity used, then from the comparison it is chosen to be coal transport in the Muning River[1].In conducting this research, the author uses a flow of thought that will be explained through the flow chart Figure 1:
Figure 1. Flow Chart
To calculate the travel time of coal transportation using the following formula:
T = .... ………...… (1)
Where
t = travel time (hour) s = distance traveled (km) v = speed (km / h)
From the above calculation then proceed to calculate the total trip per day (nh), where the formula used is as follows:
nh= Time Work / Day
Time Total (tw) ...(2)
For the calculation of payload capacity per day, the calculation must meet equation (2), the transport capacity used (Wo) and the total trip per day (nh) must be the same as the requirement (W).
W = Wo x nh ... (3) Whereas to determine coal transport capacity for one year using the following formula:
Wx = Wtotal x n ... (4) Where :
Wx = total 1 year load (tons) Total = total load per day (tons) n = effective work time of 1 year
After knowing the total load per year then the division between the total production last year with the total load per year, the formula used is as follows :
Na=
Wtahun
Wx ………..…...(5) Where :
Na = Number of trucks used Wtahun = Total production last year Wx = Total payload a year
B. Methodology of NPV, PI, and IRR 1. Net Present Value (NPV)
Net Present Value (NPV) can be interpreted as the present value of the revenue stream generated by investment. Mathematically, the NPV calculation can be formulated as follows:
NPV = TPV - Investment ...(6) Where:
- NPV = net profit based on the amount of Present Value (PV)
- PVP = the total amount of cash flow after multiplying (x) the interest rate
- Investment = total amount of initial business investment The assessment criteria with the NPV method are if the NPV (+) means that the investment is received, while if the NPV (-) means that the investment is rejected. 2. Payback Period (PP)
Payback Period (PP) is the period or number of years needed to return the value of the investment that has been
issued.
Following is the formula used to calculate PP.
PP =Nilai rata-rata Investasi cas flow……….…...….(7)
3. Profitability Index (PI)
This method calculates the comparison between net cash receipts in the coming year and the current investment value. If the Profitability Index (PI) is> 1, the project is said to be profitable. Whereas if the <1 project is not profitable.
PI = PV (A)
Investasi………...……...………..…….(8)
Dimana
PI = Profitability Index
PV (A) = total Present Value of Cash Flow Investasi = investasi
4. IRR (Internal Rate Of Return)
Internal Rate of Return (IRR) is the maximum interest rate that a business can pay for the resources used because the business again requires funds to finance operations and investments[8]. If the IRR is equal to r% (discount rate), the business does not get profit or loss, and if the IRR <r% (discount rate) of the business is not feasible to run. A viable business is run if the IRR> r%. The discount rate (r%) has been determined by the company. Systematically, IRR calculations can be formulated as follows:
Calculation of estimated emissions is calculated based on the European methodology standard (MEET), where this calculation has been applied by Trozzi. Trozzi in his research used daily engine fuel consumption and emissions were calculated by considering factors such as engine power and type of fuel used. [9]
Whereas to find the total emissions from pollutants are as follows:
Ei (Total) = Ei (hulu) + Ei (hilir)+ Ei (perjalanan)……...(13)
III. DATA
A. Shipping Rute
Figure 2. Shipping Rute
The muning river is used as a coal transportation route for water transport that connects from the upstream terminal to the downstream terminal which is 29 km away. The dimensions of the muning river can be seen in the Figure 2 .
Source : Research Data
Figure 3. Muning River Dimension
B. Tidle Data
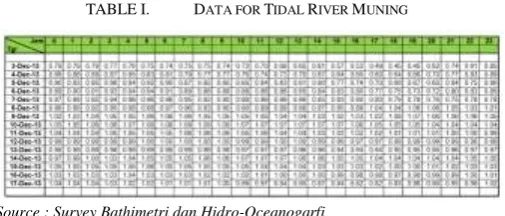
Tides in these waters occur 2 times for 1 day. The influence of tides in these waters is not too large because of its distance from the sea. The following are the tidal data based on the Bathimetry and Hydro-Oceanography Survey that has been carried out. The survey was carried out using a palm (tidal sign) with a height of 3 m and then recorded a change in water height for 15 days.
TABLE I. DATA FOR TIDAL RIVER MUNING
Source : Survey Bathimetri dan Hidro-Oceanogarfi
The table above is the tide data of the Muning River. The tide will be used to calculate the size of the tug boat.
• Coal Transportation Land Transportation
In transporting coal, use 2 modes of transportation, namely on land using trucks and canals using drag barges. The following data is used:
TABLE II. SPECIFICATION
Merk Hino
Type FM 260 JD New
Model Dumptruk
Max Power 260 PS ( 266 HP )
SFOC 178 gr/kwh
Rpm 2500 rpm
Capacity 30 Ton
Dimension P x L x T 8645 x 2490 x 2770 m
Source : www.hino.co.id
• Water Transportation
Water transport that will be used to transport coal is drag barges and tugboats. Tugboat is used to towing barges.
TABLE III. SPECIFICATION TUG AND BARGE
No Name DIMENSION (M) Speed
(Knot)
LOA B d
1. Tug Boat 15,50 4,80 2,30 8
2. Barge 52,67 13,11 3,35 8
Source : Reseearch Data
The main engine specification data used are as follows:
TABLE IV. MAIN ENGINE SPECIFICATION
Merk DOOSAN INFRACORE
Type L 126 TIH
Number Series EDIKM210685
Power 360 PS (265 Kw)
Rpm 2000 rpm
SFOC 117 g/kwh
Fuel Solar
Source : Research Data
The auxiliary engine specification data used is as follows:
TABLE V. AUXILIARY ENGINE SPECIFICATION
Merk WEICHAI
Type D226B-3C1
Power 35 Kw
Rpm 1800 rpm
SFOC 198 g/kwh
Fuel Solar
Source : https://www.weichai.com
• Loading and unloading data
This coal terminal will be used as a place to load and unload coal that is transported through the river channel. In this study the upstream terminal is at the starting point of the coal loaded, while the downstream terminal for the coal loading site.
• Upper Terminal Data
Source : Analysis
Figure 4. Layout Upper Terminal
Data Upper Teminal is :
- Depth = 5m
Downstream Terminal Data are as follows:
- Depth = 5 m larger barge via the Putting River line with the width of the river reaching 240 m.
Source : Analysis Data
Figure 5. Layout Downstream Terminal
IV. RESULTSANDDISCUSSIONS
A. Land Transport Capacity
The land transportation used for coal transportation is a truck with a dump truck type with WO load capacity = 30 tons. Truck travel when loading is from A-B, while truck trips when empty are from B-A. The concept and calculation of trucks when loading up to empty trucks are as follows:
Source : Analysis Data
Figure 6. Land Transportation Concept
Below is a table of distance and speed of time taken for land transportation:
TABLE VI. DISTANCE,SPEED AND TRAVEL TIME OF LAND
TRANSPORTATION
No Condition Distance
(Km)
The table explains the length of travel time when the barge is fully loaded and the barge is empty when returning to the loading place.
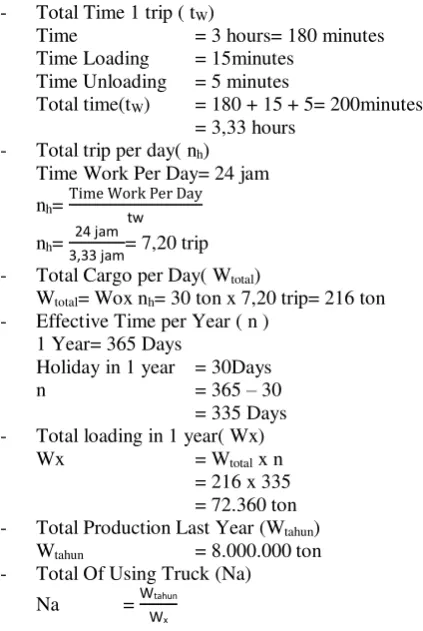
- Total Time 1 trip ( tW)
Time = 3 hours= 180 minutes
Time Loading = 15minutes Time Unloading = 5 minutes
Total time(tW) = 180 + 15 + 5= 200minutes - Total Production Last Year (Wtahun)
= 8.000.000 ton72.360 ton = 110,56 = 111 truk
From the above calculation, it is known that the truck used is 111 units, and the number of truck transportation reserves is 9 units.
B. Water Transport Capacity
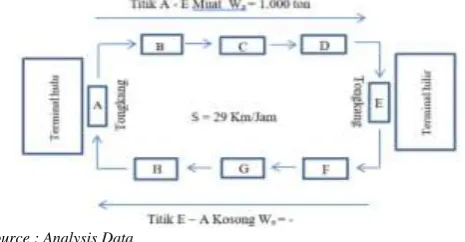
Water transportation used for coal transportation is a drag barge. The drag barge used is a 568 GT 180 feet barge with a WO loading capacity = 1,000 tons. The barge trip when loading is from A-E, while from E-A the barge travels when it is empty. The concept of coal transportation using barges can be seen in the Figure 7.
Source : Analysis Data
Figure 7. River Transportation Concept
Coal transportation from loading to empty has different speeds, the details are as follows:
• Water transport when loading
The A - E point is the condition when the barge is loaded with Wo = 1,000 tons. The distance and calculation of travel time when loading is found in the table VII.
TABLE VII. DISTANCE,SPEED AND TRAVEL TIME OF WATER
The data above is the speed traveled on each stage, so that the time taken in one trip will be known. The data above is data from land or truck transportation
• Water transport when empty
Whereas at point E - A conditions when barges are empty. The distance and speed of the barges and the calculation of the travel time of the barges when empty are found in the table VIII.
TABLE VIII. DISTANCE,SPEED AND TRAVEL TIME OF WATER TRANSPORT
The data above is the speed traveled on each stage, so that the time taken in one trip will be known. The data above is data from Tug and Barges.
- Calculation total time 1 trip ( tW)
conveyor loading Capacity = 1.500 tph conveyor unloading Capacity = 900 tph
conveyor Efficiency = 90 % Loading Time = 0,74 Hour = 44,44 Minutes
Unloading Time = 1,23 Hour = 74,07 Minutes - Total Time Barge( tw)
- Total Loading per Year( Wx ) Wx = Wtotal x n
= 2.425,55 x 335 = 812.558,26 ton
- Total Production Last Year( Wtahun) Wtahun= 8.000.000 ton transportation used is 10 units, and the number of reserves is 1 unit.Based on the Bathimetry and Hydro-Oceanography Survey that has been carried out, the change in water level at high tide reaches 4.09 m, while the change in water at low tide
is 3.45 m. The water-laden height is then added to the trim by stern condition and clearance with seabed.
TABLE IX. ADDITION OF BARGE HIGHT
The height of 230 feet barge water is 2.77 m after adding 0.9 m to 3.67 m, the lowest river depth is 3.45 m. the river depth is less than 0.22 m so that the depth of the river can be traversed by 230 feet. Dredging the river channel into a solution so that the 230 feet barge can be used optimally in these waters.
• Economic Analysis of Water Transport
The costs used for calculating the feasibility of investment in water transport consist of the investment costs of transportation and terminals, operational costs, and operational costs of travel.
Cash flow estimation calculations (Cash Flow), Payback Period (PP), Net Present Value (NPV), Profitabilty Index (PI), and Internal Rate of Return (IRR).
• Estimated Cash Flow
TABLE X. ESTIMATED CASH FLOW OF WATER TRANSPORT FOR 5 YEARS
Information Calculation Cash Flow per Years (Rp.)
2017 2018 2019 2020 2021
Income 1.520.000 1.530.000 1.800.000 2.090.000 2.400.000
Operating
Cost 105.069 110.322 115.838 121.630 127.712
Depreciation 70.083 66.579 63.250 60.088 57.083
Pre – Tax
Income 1.344.848 1.353.098 1.620.911 1.908.282 2.215.205
Tax 30% 403.454 405.930 486.273 572.485 664.561
After Tax
Revenue 941.393 947.169 1.134.638 1.335.797 1.550.643
Depreciation 70.083 66.579 63.250 60.088 57.083
CashFlow 1.011.477 1.013.748 1.197.888 1.395.885 1.607.727
Total 6.226.725
c. Investment analysis using Profitabilty Index (PI) method
The Profitability Index method is a method that calculates the comparison between the present value of net cash receipts in the future (proceeds) and the present value of investment (outlays). If PI is greater 1, then the investment project is worth it. If the PI is smaller 1, then the investment project is not feasible.
PI = 4.608.1902.106.530
= 2,19 = 2,19 > 1
Based on the results of the calculation above, a positive result or 2.19> of 1 can be obtained, thus investment in coal transportation using water transport is feasible.
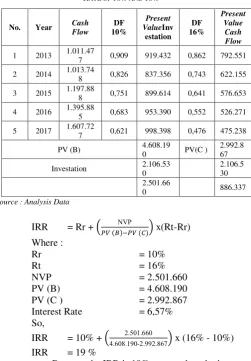
d. Investment Analysis with Internal Rate of Return (IRR) Method
TABLE XII. ESTIMATED WATER TRANSPORT NPVWITH AN INTEREST
7 0,909 919.432 0,862 792.551
2 2014 1.013.74
8 0,826 837.356 0,743 622.155
3 2015 1.197.88
8 0,751 899.614 0,641 576.653
4 2016 1.395.88
5 0,683 953.390 0,552 526.271
5 2017 1.607.727 0,621 998.398 0,476 475.238
Because the IRR is 19% greater than the interest rate, the project is feasible to run. Based on the calculation of the IRR Analysis above, the transportation of coal using water transport is feasible to use because the IRR is greater than the interest rate that has been set at 6.57% per year.
V. CONCLUSION
Based on the calculation of the cash flow projection, and from the aspect of investment analysis with the Payback Period (PP) method, Net Present Value (NPV), Profability Index (PI), and Internal Rate of Return (IRR) the results of analysis of coal transportation using land and water transport worth running. A summary of the results of the calculation of economic feasibility can be seen in the table XIII.
TABLE XIII. SUMMARY OF THE RESULT OF PP,NPV,PI AND IRR transportation using water transport the results are more feasible than land transportation. This makes water transportation chosen to be used as coal transportation to increase planned production.
The following suggestions can be given as a consideration for objects of observation in making decisions and subsequent research.
1. Water transport facilities for loading and unloading so that they can be repaired or replaced to speed up the time when loading and unloading.
2. Dredging the river channel so that the depth of the river increases, with increasing depth will not be an obstacle for a larger barge.
3. For further research, a study on the use of Self Propeller Barge for coal transportation in the Muning River can be carried out. This use aims to make coal transportation more practical because the engine barges have their own propulsion machines so that they do not require barges during the transport process.
For further research can be done Placement of empty barges at the coal terminal to optimize the performance of the tugboat.
REFERENCES
[1] Astanugraha, I Made Candra dan Hasnudin, “Analisis Teknis dan
Ekonomis Konversi Barge Batubara Menjadi Kapal Ikan Pengangkut Ikan Hidup Untuk Perairan Sumbawa”, ITS, Surabaya, 2017.
[2] Fadillah, Arif and Putra Pratama, “Optimization of Coal Transportation Using Pusher Barge System Empty Barge at The Port and Utilization of
Tidak River”, Institute Teknologi Sepuluh November : Surabaya, 2016.
[3] Jatmiko, Sukanto, dan Imam Pujo M, “Analisa SensitivitasKelayakan
Usaha PT. Jasa Marina Indah DenganaBeroperasinya Graving Dock
18.000DWT”, UniversitasDiponegoro.Semarang, 2010.
[4] Karana Sjafril, “Kajian Penentuan Jenis dan Ukuran Sarana Angkutan
Batubara Dari Pelabuhan Sorongke PLTU KTI”, Direktorat Pengkajian Teknologi Industri dan SistemTransportasi, Vol. 9 No. 2, 2015.
[5] Pratama, Putra dan Arif Fadillah, “Analisa Angkutan Batubara dengan
Konsep Penggunaan Tongkang Kosong di Pelabuhan dan Pemanfaatan Pasang Surut”, Universitas Darma Persada, Jakarta, 2016.
[6] Pratama, Putra and Arif Fadillah. 2015. “Analysis of Coal Transport Optimization with The Concept of Use Empty Barge in The Port and
Utilization of Tidal River”, Institut Teknologi Sepuluh November :
Surabaya
[7] Putra, Erzad Iskandar dan Ir. Tri Achmadi, Ph.D, “Analisa Penerapan
Continous Coal Transport Mode untuk Angkutan di Sungai”, ITS :
Surabaya, 2012.
[8] Siagian, Rizky Torang Surya dan Medis Sejahtera Surbakti, “Analisis Awal Kelayakan Ekonomi dan Finansial dalam Perencanaan Monorel
Kota Medan”, The 18th FSTPT International Symposium, Universitas
Lampung.Bandar Lampung, 2015.
[9] Trozzi,C., Vaccaro,R.: Methodologies For Estimating Air Pollutant Emission From Ships, Techne Report MEET RF98b.,1998
Halaman ini sengaja dikosongkan