Genomu joho o mochiita DNA/RNA ketsugo tanpakushitsu no yosoku to tRNA no shinka ni kansuru kaiseki
Bebas
68
0
0
Teks penuh
(2) ISBN. 978-4-87762-175ー9. SFC-MT 2006-005. redactionof novelDNA/RNA-binding. proteinsand. analysisof tRNA evolutionusinggenomic data 2006年. 藤 島 皓介 政策・ メディア研究科修士課程 先 端 生命 科 学 プ ロジェクト. 慶應義塾 大 学 湘 南 藤 沢 学 会 優P.
(3) 優秀 修士論文推薦の ことば. 原始 生命 に近 い古細 菌 を研 究す る ことは、生命 システムの起源 を知 る上で非 常に 重要である。本論文では アミノ酸 の周期性 という独 自の要素 を定義 し、古細菌 にお いて、数多 くの新規核酸 結合蛋 白質 を予測 しさ らに同定 した。また網羅 的なtRNA 配列の比較解 析 を通 して得 られた仮説 は、遺伝暗号表 の起源 を明 らか にす る可能性 が ある。このよ うに生命情報 学 と分子 生物 学 を組み合わせたハ イスルー プ ッ トな研 究手法 はSFCが. 目指す分 野融合 と最 先端の研究 を体現 して いる ことか ら、本論文. を修士優秀論文 として強 く推薦す る。. 慶應 義塾大学 環境情報学部教授 冨田 勝.
(4) 修 士論文. Prediction analysis. of novel of tRNA. 2006年. 度(平 成18年. DNA/RNA-binding evolution. ゲ ノ ム 情 報 を 用 い たDNA/RNA結. using. 度). proteins genomic. and. data. 合 蛋 白 質 の 予 測 とtRNAの. 進 化 に 関 す る 解 析. 慶應義塾大学大学院. 政 策 ・メデ ィア研究科. 藤島. 1. 皓介.
(5) Abstract. Prediction. of novel tRNA. of Master's. Thesis. DNA/RNA-binding evolution. using. Academic. Year 2006. proteins genomic. and. analysis. of. data. Abstract Proteins play a critical role in complex biological systems, yet about half of the proteins in publicly available databases are annotated as functionally unknown. Proteome-wide functional classification using bioinformatics approaches thus is becoming an important method for revealing unknown protein functions. Using the hyperthermophilic archaeon Pyrococcus furiosus as a model species, we used the Support Vector Machine (SVM) method to discriminate DNA/RNA-binding proteins from proteins with other functions, using amino acid composition and periodicities as feature vectors. We defined this value as the Composition (CO) score and Periodicity (PD) score. The P. furiosus proteins were classified into three classes (I-III) based on the 2D correlation analysis of CO score and PD score. As a result, approximately 87% of the functionally known proteins categorized as class I proteins (CO score + PD score > 0.6) were found to be DNA/RNA-binding proteins. Applying the 2D correlation analysis to the 994 hypothetical proteins in P. furiosus, a total of 151 proteins were predicted to be novel DNA/RNA-binding protein candidates. DNA/RNA-binding activities of randomly chosen hypothetical proteins were experimentally verified. Five out of six candidate proteins in class I possessed DNA/RNA-binding activities, supporting the efficacy of our method. Recent discovery of the completely separated 5' and 3' halves of tRNA molecules; so-called split-tRNA in Nanoarchaeota Nanoarchaeum equitans has brought us question whether ancient form of tRNA was codified on single or separated genes. We propose a new theory that tRNAs are originated from the combination of 5' half and 3' half tRNA fragments in the ancestral archaeons. To verify this hypothesis, we prepared total 1302 tRNA sequences from 30 archaeal genomes based on computational prediction and performed sequence alignment of the exon sequences to observe the relativity of split- intronic- and nonintronic tRNAs at the sequence level. As a result, exon tRNA sequences were clearly separated into 39 different clusters resulting each of the 6 split-tRNAs classified among the intronic and non-intronic tRNAs with same anticodon. Further, we divided 304 tRNAs in 7 representative archaeal species from different genus at the canonical intr on position (37/38) to mimic split-tRNA and performed comparative phylogenetics upon 5' and 3' tRNA halves respectively. The topology of the phylogenetic trees of 5' and 3' tRNA halves differed significantly and the consensus sequence of each cluster has shown potential identity determinants suggesting the different evolutionary background. The combination patterns of 5' and 3' tRNA halves strongly correlated with the divergence of amino acids in the codon table. These results suggest that ancient tRNAs could have been emerged through combination of various 5' and 3' tRNA sequence to. 2.
(6) establish the genetic code.. Keywords: functional prediction, DNA/RNA-binding protein, amino acid periodicity, Support vector machine, tRNA evolution, phylogenetic analysis. Keio University, Graduate School of Media and Governance Kosuke Fujishima. 3.
(7) 修 士 論文 要 旨. 2006年 度(平 成18年. 度). ゲ ノ ム 情 報 を用 い たDNA/RNA結 合 蛋 白質 の 予 測 と tRNAの 進 化 に 関 す る 解 析 諭 文要 旨 ポ ス トゲ ノ ム 時 代 を 迎 え た 今,蛋 白 質 と 核 酸 が お りな す 複 雑 な 相 互 作 用 が 遺 伝 情 報 の 発 現 を 中 心 と す る 生 命 シ ス テ ム に ど の よ う に寄 与 し て い る か を 知 る 事 は 非 常 に 重 要 な 問 題 と な っ て い る.本 は 古 細 菌 に お け る 蛋 白 質 及 びRNAに 目的 で 解 析 を 行 っ た.現. 研 究で. 着 目 し、そ の 機 能 や 進 化 的 な 側 面 か ら 先 の 問 題 の 一 端 を 解 明 す る. 在 、 プ ロ テ オ ー ム の 分 野 で は 実 験 的 に確 認 され た もの も 含 め て も機 能 既 知 蛋. 白 質 の 割 合 は 全 体 の 約5割. 程 度 に と ど ま っ て い る.ー. 方 これ ま で の 先 行 研 究 か ら核 酸 結 合 蛋 白 質 の 多. く は 特 定 の ア ミ ノ 酸 を 周 期 的 に 有 す る こ と が 確 認 さ れ て い る こ と か ら,私 指 標 を 用 い て 新 規 の 核 酸 結 合 蛋 白 質 の 予 測 方 法 の 確 立 を 目指 した.モ furiosusを 用 い た.そ の 理 由 は 遺 伝 子 数 が2000程. は ア ミノ酸 の周 期 性 とい う. デ ル 生 物 に は 超 好 熱 性 古 細 菌P. 度 で 進 化 的 に 生 命 の 起 源 に 近 い 生 物 で あ る こ と,さ ら. に 蛋 白 質 が 熱 耐 性 で あ り精 製 が 容 易 で,実 験 的 に 検 証 しや す い こ とが 挙 げ ら れ る.ま ず ア ミ ノ 酸 を 電 荷 や 疎 水 性 な ど の 性 質 に 基 づ いて23の. グ ル ー プ に 分 類 し,そ れ ぞ れ の ア ミ ノ 酸 グ ル 一 プ が 周 期 性 に 現 れ. る 頻 度 を 蛋 白 質 ご と に 計 算 した.各 々 の 蛋 白質 の 周 期 性 をSVM法 独 自 に 定 義 し た.さ ら に 二 次 元 プ ロ ッ ト法 を 用 い てPD. で 学 習 させ,周 期 ス コ ア(PD. score)を. scoreを ア ミ ノ 酸 使 用 頻 度 と併 せ て 用 い る こ と. で,非 常 に 高 い 精 度(87%)で 核 酸 結 合 蛋 白 質 群 を 分 類 す る こ と に成 功 した.さ. ら にこの 周期 性 を機 能未. 知 蛋 白 質 に 適 応 す る こ と に よ り10個 の 新 規 核 酸 結 合 蛋 白 質 を 実 験 的 に 同 定 した. -方 で 進 化 の 側 面 か ら遺 伝 情 報 の 形 質 発 現 に お い て 重 要 なtRNA分 子 に 着 目 し、古 細 菌 に お け るtRNA 進 化 に 関 す る 新 た な 仮 説 を 提 唱 す る-通 常tRNAは 受 け て 成 熟tRNAに. ゲ ノ ム 中 の あ る 領 域 か ら 転 写 され,プ ロ セ シ ン グ を. な る が,ナ ノ古 細 菌 が 有 す るtRNAの. され,そ の 後 トラ ン ス ス プ ラ イ シ ン グ を 経 て 成 熟tRNAな はsplit型,イ ン トロ ン型,非 イ ン トロ ン 型 の3種 間 比 較 を 用 い た 系 統 解 析 を 行 っ た.ま ソ フ トSPLITSを のtRNAが. 用 い て,3種. identityが80%以. る.こ の よ う なtRNAをsplit. 類 のtRNAの. 類 のtRNAす. 所 の 領 域 か ら転 写 tRNAと. の 古 細 菌 に対 し てtRNA予. べ て を 網 羅 的 に 予 測 した.そ の 結 果,信. 測. 頼 性 の 高 い1302本. 対 して イ ン トロ ン 配 列 を 取 り 除 き 、 エ キ ソ ン配 列 の み で ア. 類 のtRNAは. そ の 型 に 関 係 な く 同 義 コ ドン を 持 つtRNA間. 模 倣 し分 類 した 結 果,コ. ポ ジ シ ョ ン37/38で5'断. で配 列の 片 と3'断 片. ドン の 遺 伝 暗 号 表 は特 定 の5'及 び3'tRNA断. み 合 わ せ と 良 く 対 応 し,進 化 的 に 共 通 し て 使 わ れ る 断 片 が あ る こ と が 明 らか とな っ た.こ か ら古 細 菌 に お け るtRNAの. 呼 ぶ.私. 間 に 進 化 的 な 関 連 性 が あ る と 仮 定 し,多 種. 上 の ク ラ ス タ を 形 成 した.さ ら に す べ て のtRNAを. に分 け てsplit型tRNAを. は ゲ ノ ム 中 の2箇. ず 全 ゲ ノ ム 配 列 が 既 知 で あ る30種. 予 測 され た.予 測 さ れ たtRNAに. ラ イ メ ン トを 行 った と こ ろ,3種. う ち6つ. 進 化 に お いて5'と3'の. 片 の組. れ らの結 果. 配 列 の セ レ ク シ ョ ンが 過 去 に 起 き た こ と が 示 唆 さ. れ た.. キ ー ワ 一 ド=蛋 白 質 機 能 予 測,DNA/RNA結 進 化,多. 種 間 比 較,系. 合 蛋 白 質,ア ミ ノ酸 周 期 性,サ ポ-ト. ベ ク タ ー マ シ ン,tRNA. 統解析 慶應. 義塾 大学 大 学院. 政 策 ・メ デ ィ ア 研 究 科. 藤島. 4. 皓介.
(8) Contents. 1. Chapter. 1. Introduction. Chapter. 2. Proteome-wide. prediction. of novel DNA/RNA-binding. proteins using amino acid composition in the hyperthermophilic. archaeon. and periodicity. Pyrococcus furiosus. 3. 4. 2.1 Introduction. 2.2 Materials. 6. and method. 2.2.1. Protein. dataset. and functional. 2.2.2. Amino. acid periodicity. 2.2.3. SVM classification. 6. annotations. 7. of DNA/RNA-binding. proteins. based on amino. acid. periodicity. and composition. 8. 2.2.4. Validation. of PD score performance. 9. 2.2.5. Construction. of expression. recombinant. proteins. 2.2.6. Gel-shift. vectors. and purification. of His-tagged 11 12. assay. 2.3 Results and discussion. 12. 2.3.1 Functional annotation of P. furiosus proteome and those of other model species. 12. 2.3.2 Amino acid periodicity score (PD score) and prediction of the DNA/RNA-binding proteins. 14. 2.3.3 Both CO score and PD score are required for efficient classification of DNA/RNA-binding protein predictions. 17. 2.3.4 Selection and experimental verification of novel DNA/RNA-binding 19. protein candidates 2.3.5 Possible explanation of charged amino acid periodicity with DNA/RNA-binding activities. 25. 5.
(9) 2.4 Conclusions. Chapter. 3. A new. tRNAs s'half. 27. were. hypothesis. evolved. and s'half. for tRNA. through. tRNA. evolution. the combination. in archaea: of ancestral. fragments. 28. 3.1 Introduction. 29. 3.2 Material. 30. and methods. 3.2.1. Preparation. 3.2.2. tRNA. 3.3 Results. of the genomic. sequence. 30 30. analysis. and discussionsl. 3.3.1. Comprehensive. 3.3.2. Phylogenetic archeal. 3.3.3. data. phylogenetic relation. analysis. of tRNAs. in 30 archaeal. of the six known. split-tRNA. reveals. origin and evolution. species. 31. hypothesis. 39. and other. tRNAsss. Phylogenetic. analysis. different. of. the 5' and 3' tRNA halvess4 3.3.4. Possible. 3.3.5. A possible tRNAs. 3.4. evidence. supporting. mechanism. the 5' —3' tRNA. of the emergence. combination. and evolution. of. in archaea4o. Conclusions. 41. Acknowledgements. 43. References. 44. Appendix. 49. 6.
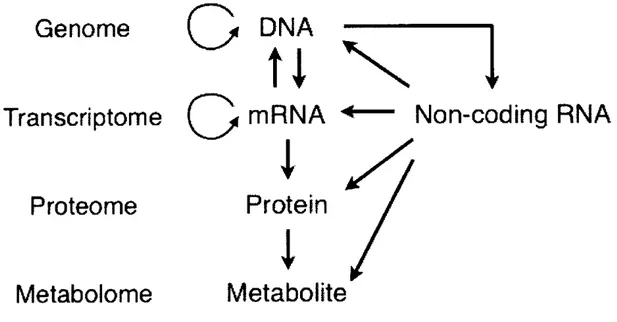
(10) Chapter. 1. Introduction. The RNA molecule can store genetic information just like DNA and acts as a ribozyme to perform various biological processes like protein enzymes. Recently, various systematic screens have identified a new class of RNA known as non-coding RNA (ncRNA) genes., More that 50% of the genome sequence in mouse are known to be transcribed as a ncRNA and some of these transcript seem to play an important role in the gene rexpression, post-transcriptional regulation and even act as a sensor of metabolites, pH and heat to quickly respond to the change in the intracellular environments. Thus, RNA network seem to be supporting and regulating the main stream of genetic information and overall biological processes (Figure 1).. GenomeDNA ----------. t. 1. Transcriptome GmRNA4— Non-coding RNA Proteome. Protein. Metabolome. Metabolite. Figure. 1. Schematic. representation. of ncRNA. network. affecting. the central. dogma. The ncRNA molecule acts dynamically throughout the main stream of genetic information known as central dogma.. Although. some. of. the. biological. functions. of. 7. ncRNAs. have. been. revealed,. dynamic.
(11) interaction between other molecules especially proteins are yet to be analysed. Considering the fact that about half of the proteins are un-annotated and along with the emergence of mass ncRNAs, discovery of novel RNA-protein regulatory networks are to be expected. Further, revealing the function, origin and evolution of these RNA-protein networks will be an interesting theme for both biologists and molecular evolutionists. In this manuscript, we introduce two different analyses to reveal the dynamics in the ancient RNA-protein world focusing on archaeal proteins and tRNA molecule. In chapter 2, we introduce a new method to predict novel DNA/RNA-binding proteins from functionally unknown proteins using amino acid composition and periodicity in hyperthermophilic archaeon Pyrococcus furiosus. In chapter 3, represent a new theory to explain the evolution of tRNAs in archaea by analyzing the sequences of 5' and 3' tRNA halves separately.. 8.
(12) Chapter 2. Proteome-wide proteins. using amino. hyperthermophilic. prediction. of novel DNA/RNA-binding. acid composition. and periodicity. archaeon Pyrococcus furiosus. 9. in the.
(13) 2.1 Introduction Thelast decade has been a remarkable time in the field of genome science. DNA sequences from over 2400 species have been determined [1], and more are on the way. Correspondingly, the need for reliable functional annotation has become prominent. Most functional annotation is based on a sequence similarity approach [2], but about half of the proteins registered in protein databases are classified as hypothetical because they lack similarity to functionally known proteins. Proteome-wide functional classification using bioinformatics approaches is becoming an important method for revealing unknown protein functions. For example, the recent exponential growth in Protein Data Bank (PDB) entries has enabled highly accurate functional predictions to be made on the basis of structural similarities to three-dimensional profiles of proteins [3, 4]. Comparative genome analysis using phylogenetic profiting has revealed a diversity of functional linkages among genes, and thus it can be a useful strategy for elucidating the functions of uncharacterized proteins [5]. However, although species-specific genes (so-called ORFans) are known to encode many uncharacterized short peptides [6], the functions of these peptides are difficult to predict with certainty using comparative genomics because they lack homology to those sequences currently in databases. More than 23,000 ORFans have been found in 60 microbial genomes, and, based on structural studies, many are likely to encode expressed, functional, or even essential proteins [7]. Therefore, alternative bioinformatics methods that can predict these uncharacterized protein functions at the proteome level are very useful. For the past few years, we have been working. on RNA metabolism in the. hyperthermophilic archaeon Pyrococcus furiosus [8-10], and reported on our experimental system in which an expression cloning method is used for extracting DNA/RNA-binding proteins at the proteome level. During this work, we observed that charged amino acids—such as aspartic acid, glutamic acid, arginine, and lysine—appeared both in the sequence of the. 10.
(14) novel RNA-binding protein FAU-l and Ribonuclease E in a periodic manner [8]. It is possible that certain acidic and basic amino acid periodicities might affect the secondary or tertiary structure of a protein so that it gains DNA/RNA-binding activities. Amino acid periodicities are commonly observed features in the sequences of various proteins such as myosin and amyloids [11], serine—threonine and tyrosine protein kinases [ 12] and are known to be strongly correlated with their secondary structures. The purpose of the current study was to demonstrate that a bioinformatics approach focusing on the periodicity in a protein's primary structure could be a suitable method for elucidating DNA/RNA-binding proteins. Previously, several support vector machine (SVM) based methods were developed towards predicting DNA-binding and RNA-binding proteins based on various amino acid profiles (i.e., overall composition, pseudo-amino acid composition, surface composition, electrostatic potential and hydrophobicity) [13-15]. SVM is one of the most powerful supervised learning algorithm that recently has been widely used in the field of bioinformatics. We describe here a SVM-based method for classifying known DNA/RNA-binding proteins from P. furiosus using amino acid composition and periodicity as a feature vectors. The discriminant value (SVM output) derived from these profiles were defined as a new indices: composition (CO) score and periodicity (PD) score. Amino acid composition are known to be strongly correlated with protein secondary structure class [ 16] and subcellular localization [ 17, 18] and are assumed to support the protein function classification. Therefore based on the 2D correlation analysis, we combined amino acid composition (CO score) with PD score to further improve the performance of DNA/RNA-binding protein prediction. The 2D correlation analysis was then applied to hypothetical proteins of P. furiosus and promising candidates for being novel DNA/RNA-binding proteins were selected. DNA/RNA-binding activities of these candidate proteins were examined experimentally and many of them were. 11.
(15) confirmed. as novel. 2.2 Materials. DNA/RNA-binding. proteins.. and methods. 2.2.1 Protein dataset and functional annotations Automated annotations and amino acid sequences of proteins from the two archaeal species, P. furiosus (2057 proteins) and S. solfataricus (2934 proteins), were taken from the EMBL database (http://www.ebi.ac.wk/embl/ :Release 83, June 2005). Each protein entry has a UniProt Knowledgebase (UniProtKB) accession code corresponding to its entry in either the UniProtKB/Swiss-Prot. (http://www.ebi.ac.wk/swissprot/. : Release 47, May 2005) or. UniProtKB/TrEMBL (http://www.ebi.ac.wk/trembl/ : Release 31, September 2005). Both databases contain information on the Gene Ontology annotation (GOA: a combination of electronic assignment and manual annotation) and protein data from the domain databases InterPro [24] and Pfam [25]. Swiss-Prot data were used for the four prokaryotic and eukaryotic speciesB.. subtilis (2799 proteins), E. coll K12 MGl6ss. (4465 proteins), A.. thaliana (3454 proteins) and C. elegans (2655 proteins)—as a reliable independent test set. We defined "functionally known proteins" as functionally annotated proteins in the Swiss-Prot or TrEMBL databases with additional GOA. TrEMBL protein entries with no additional annotation were categorized as "putative functional proteins." Proteins annotated as "hypothetical" in the database were defined as "hypothetical proteins ." DNA/RNA-binding proteins were defined as those proteins whose annotations included the following keywords in Swiss-Prot, TrEMBL, and GOA annotations: DNA, RNA, ribosome(al), RNP, ribonucleo-, helicase, nuclease, or nucleic acid binding. To reduce the bias of functional variety in the protein dataset, the functionally known proteins of the six model species were filtered to. 12.
(16) remove homologous proteins at sequence identity level with E-value <1 x 10⁴ and short peptides <20 amino acids from future analyses. In total, we prepared 477 proteins of P. furiosus, 582 proteins of S. solfataricus, 914 of B. subtilis, 1436 of E. coll, 865 of A. thaliana, and 566 of C. elegans as a "representative set" for the analysis (Table 1).. 2.2.2 Amino acid periodicity To analyze amino acid periodicities, we used eight physico-chemical profiles (Chemical, Sheath, Dayhoff, Stanfel, Functional, Charge, Structural, and Hydrophobicity) [37] to subdivide the 20 common amino acids into groups. For example, the "Charge" profile divided the 20 amino acids into the three groups DE, RKH, and others (ACFGILMNPQSTVW). In total, 23 amino acid groups were identified: DE, RK, NQ, CM, ST, ILV, RKH, FYW, AGP, MNQ, CST, DEQN, FHWY, AGPST, GAVLIP, DERKH, CGNQSTY, ACGPSTWY, RNDQEHK, ILMFV, AFILMPVW, ACGILMPSTV, and CDEGHKNQRSTY. Amino acid periodicity was defined as the regular appearance of a certain amino acid group (X), Y (Y > 3) times in a protein sequence with a period (the number of amino acids from one appearance to the next) of Z. Although a previous analysis in E. coll defined the range of periodicity as 2 to 50, to eliminate binal periodicities (ex: period 5 includes period 10), we used prime numbers and their multiples (2, 3, 5, 7, 8 [2 x 4], 9 [3 x 3], 11, 13, 15 [5 x 3], 17, 19). To take into account the fluctuation of periodicities, we set the error range as ±1. For example, in seq 1 (XXXXAXXAXXXX), "A" appears only twice, so no periodicity can be defined. Seq2 (XXBXXXXBXXXXBX) contains three "Bs" with a period of five ("B-s" periodicity).. Seqs. (XCXXXCXXCXXXCXXCX). contains. five "Cs" with multiple. periodicities (two of length 3, two of length 4 and two of length 7). Based on the error range ±1, length 4 is included in length 3; therefore Seqs is defined to have "C" periods of only 3 and 7.. 13.
(17) 2.2.3 SVM classification of DNA/RNA-binding proteins based on amino acid periodicity and composition SVM is a non-linear classifier creating a maximum-margin hyperplane by applying a kernel trick to the feature vectors. We performed two different SVM analysis based on the individual dataset of amino acid periodicity and amino acid composition. For amino acid periodicity, we calculated the relative coverage of the periodic region (R) of each training set (i) with 253 patterns of amino acid periodicities (j): 23 amino acid groups x 11 kinds (2, 3, 5, 7, 8, 9, 11, 13, 15, 17, 19 periods): R P ~=N where P is the length of periodic region of periodicity j in a single protein i, and N is the full amino acid length of a single protein i. Thus, a transformed feature space is created from 2ss-dimensional feature vectors of periodic region R. For amino acid composition, we calculated the relative composition of amino acid (C) of of each training set (i) with 20 types of amino acids (k) A N. C,k. where A is the number of amino acid k in a single protein i, and N is the full amino acid length of a single protein i. These factors were applied as a feature vector and classified two distinct members: DNA/RNA-binding proteins and proteins with other functions. For SVM training, the data label for DNA/RNA-binding proteins was denoted as 1 and proteins with other functions was denoted as -1. SVM analysis in this study was performed by the default parameters in Gist package version 2.3, which contains software tools for SVM classification [22]. After SVM. 14.
(18) training based on the protein training set of amino acid periodicities, maximum-margin hyperplane was applied to the protein test set based on a radial basis function kernel (r =1), and the discriminant value of each protein were defined as the PD score. Likewise, linear kernel based maximum-margin hyperplane was applied for the protein set based on amino acid composition and discriminant values were defined as the CO score.. 2.2.4 Validation of PD score performance The performance of the PD score at predicting novel proteins was validated based on lo-fold cross-validation test. The lo-fold cross-validation test is one of the most reliable methods for estimating the performance of the predictor. For example, the 477 representative dataset of P. furiosus was randomly split into 10 mutually exclusive subsets Dl, D2,..., Die of approximately equal size. Each subset was tested based on the training using the rest of the 9 subsets. Estimated accuracies were derived as average values. First, the classification accuracy of the PD score was compared with that of single amino acid periodicity using receiver operating characteristic (ROC) studies. The ROC curve is represented by two indices: sensitivity and specificity. The sensitivity and specificity of the PD score were calculated using a lo-fold cross-validation test with PD score cut-off of 0. Equations are represented below: Sensitivity =---------TPSpecificity TP + FNFP. =. TN + TN. where TP refers to true positive (number of DNA/RNA-binding proteins with PD score > cut-off), FP refers to false positive (number of other proteins with PD score > cut-off), FN refers to false negative (number of DNA/RNA-binding proteins with PD score < cut-off), and TN refers to true negative (number of other proteins with PD score < cut-off). Error bars were added for each dataset representing the standard deviation values derived from the lo-fold cross-validation test.. 15.
(19) Second, PD score was compared against CO score (amino acid composition based SVM) and other SVM-based protein function predictor, SVM-Prot. To assess the PD score performance, we calculated the overall accuracy (ACC) for PD score using lo-fold cross-validation test. Training dataset of SVM-Prot is fixed as a combination of 54 functional protein families and predicts several functional classes due to the probability of correct prediction [23]. SVM-Prot uses 1943 positive set and 1353 negative set for training DNA-binding proteins and 871 positive set and 1120 negative set for training RNA-binding proteins. To equally validate the prediction performance of SVM-Prot with our method, proteins that were predicted as DNA/RNA-related with the highest probability were regarded as DNA/RNA-binding proteins. SVM-Prot was applied to the representative dataset and ACC is calculated as the given equation: ACC =. TP + TN TP+FN+FP+TN. x 100 (%). To extract proteins that are more likely to be novel DNA/RNA-binding proteins, an index: positive predictive value (PPV) was adapted to measure the percentage DNA/RNA-binding. proteins. among proteins above certain thresholds. of. (blue line in. Supplementary Figure 1). PPV is calculated as the given equation: PPV =. TP x 100 (%) TP+FP. The final prediction decision is given by using the calculated value of the Matthews correlation coefficient (MCC) [38] to determine the threshold value of the CO+PD score. The MCC is a popular index for measuring the performance of prediction, maximum MCC provides efficient sensitivity and specificity. MCC =. (TP* TN) —(FP * FN) 1,1(TP+ FP)(TP + FN)(TN + FP)(TN + FN). where TP refers to true positive (number of DNA/RNA-binding proteins with CO+PD score > cut-off), FP refers to false positive (number of other proteins with CO+PD score > cut-off), 16.
(20) FN refers to false negative cut-off),. and TN refers. to. (number of DNA/RNA-binding proteins. with. CO+PD. score. true negative (number of other proteins. with. CO+PD. score. cut-off).. 2.2.5 Construction. of expression vectors and purification. of His-tagged recombinant. proteins Genomic DNA of P. furiosus DSMs6s8 was isolated using a GNOME kit (BIOiol,. La. Jolla, CA, USA) as described previously [39] and partially digested with the restriction enzyme SausAI. The resulting DNA fragments were fractionated by electrophoresis on a 0.7% agarose gel. Fragments of 15 kb were extracted from the gel and used as templates for PCR cloning. After PCR amplification using site-specific primers with NdeI and XhoI sites at the 5' and 3' termini, respectively, each of the candidate genes was cloned into the pET-2sb expression vector (Novagen, Madison, WI, USA). Insert DNA was sequenced and shown to be identical to database sequences. Recombinant proteins were prepared as described previously [8]. Briefly, E. coll strain BL2l(DE3). was transformed with each expression plasmid, however optimal protein. production required E. coll strain BL2l(DE3)pLysS for the expression of PFos6s and PFl4is proteins and strain HMSli4(DE3)pLysS. for expression of PFl4g8. Transformants were. grown at 37 °C in Luria—Bertani (LB) medium containing 50 µg/ml ampicillin and supplemented with 0.4 mM isopropylthio-b-galactoside. After 14 to 16 h of further growth at 30 °C, cells were harvested by centrifugation (sooog for 10 min at 4 °C), and the recombinant proteins were released by sonication (2 min) in buffer A (20 mM Tris•HCI, pH 8.0, 5 mM imidazole, 500 mM NaCl, 0.1% NP4o). The extracts were heat-treated at 85 °C for 15 min to destroy E. coll endogenous proteins and then centrifuged at l2ooog for 10 min at 4 °C to remove cellular debris. The recombinant proteins were purified in a Nit+-Sepharose column,. 17.
(21) according to the manufacturer's instructions (Amersham Pharmacia, Piscataway, NJ, USA). The peaks of the eluted proteins were pooled and dialyzed against buffer B (50 mM Tris•HCI, pH 8.0, 1 mM EDTA, 0.02% Tween 20, 7 mM 2-mercaptoethanol, 10% glycerol).. 2.2.6 Gel-shift assay s'-end FAM-labeled oligonucleotides were chemically synthesized by Hokkaido System Science Co. (Hokkaido, Japan). Binding reactions containing the oligonucleotide (125 or 500 nM) and 0.1 to 0.5 µg of purified recombinant protein were incubated for 15 min at either room temperature (24 °C) or 75 °C in 20 µ1 of DNA/RNA binding buffer (10 mM Tris•HC1, pH 7.5, 50 mM NaCl, 0.5 mM EDTA, 2.5 mM MgCl2, 5% glycerol, 1 mM dithiothreitol). The DNA/RNA—protein complexes were analyzed by 6% non-denaturing PAGE. The quantity of DNA/RNA—protein complexes was evaluated by scanning the fluorescent image with a computerized image analyzer, FX Pro (Bio-Rad Laboratories, Hercules, CA, USA). For sequencing of the oligonucleotides we used the following two probes (Xiaojing et al., to be published separately): (1) MPOR-2i, s'-r(GAAACAAGGAGAAAUGGUUCGUGUCCU)-3', (2) MPOD-2i, s'-d(GAAACAAGGAGAAATGGTTCGTGTCCT)-3'.. 2.3 Results and discussion. 2.3.1 Functional annotation of P. furiosus proteome and those of other model species P. furiosus, Sulfolobus solfataricus, Bacillus subtilis, Escherichia. coll, Caenorhabditis elegans, and Arabidopsis thaliana were used as model species. The hyperthermophilic. 18.
(22) archaeon P. furiosus was chosen for its topical importance in the evolution of the ancient architecture of DNA/RNA regulation [ 19] as well as for the thermal stability of its proteins, which enables easy generic purification. In addition, many P. furiosus protein functions remain unknown, which further justifies their study. From the EMBL database (Release 83, June 2005), we extracted reliable protein function data for P. furiosus [EMBL accession number, AEooggso] by unifying information from the three annotated databases Swiss-Prot, TrEMBL, and GOA [20, 21]. We defined three categories of proteins based on the number and quality of annotations (see Methods). For example, 2057 P. furiosus proteins were categorized into 942 functionally known proteins, 121 proteins with putative function, and 994 hypothetical proteins. To eliminate proteins with similar amino acid sequences, we performed a homology search among the 942 functionally known proteins using BLASTP (E-value < 1 x 10⁻⁴) and reduced the protein dataset to 477 non-redundant proteins for the periodicity analysis. To facilitate their use as a training dataset for SVM learning, these functionally known proteins were further divided into 157 DNA/RNA-binding proteins and 320 proteins with other functions. The same procedure was applied to the EMBL data of the archaeon S. solfataricus [EMBL accession number, AEoo664l] and the Swiss-Prot entries of the B. subtilis, E. coll, A. thaliana and C. elegans proteomes (Table 1).. Table 1. Functional classification table of the proteome dataset of six model species. 19.
(23) Species. Database. Functionally *Representative set DNA/RNA. P. furiosus. TrEMBL+Swiss-Prot. 157. S. solfataricus. TrEMBL+Swiss-Prot. 184 204. B. subtilis. Swiss-Prot. known Redundant. Putative. Hypothetical. Total. protein. Total. Others. Total. 320. 477. 465. 942. 121. 994. 398. 582. 730. 1312. 302. 1320. 2934. 710. 914. 908. 1822. 1. 976. 2799 4465. 2057. E. coll. Swiss-Prot. 346. 1090. 1436. 1889. 3325. 1. 1139. A. thaliana. Swiss-Prot. 223. 642. 865. 1590. 2455. 56. 144. 3454. C. elegans. Swiss-Prot. 165. 401. 566. 1215. 2580. 0. 874. 2655. * Representativeset consistsof proteinswith aminoacid length> 20 and homologyredactedusing BLASTP (E-value< 1 x 10⁻⁴). 2.3.2 Amino acid periodicity score (PD score) and prediction of the DNA/RNA-binding proteins To. ascertain. common. features. of. amino. acid. periodicity. throughout. the. DNA/RNA-binding protein sequences, we defined 23 amino acid groups using eight physico-chemical profiles (Chemical, Sheath, Dayhoff, Stanfel, Functional, Charge, Structural and Hydrophobicity). We prepared a total of 253 patterns of amino acid periodicities (23 groups x 11 non-redundant periodicities). For each training dataset in the six model species, the relative coverage of periodic region R was calculated for 253 individual amino acid periodicities as feature vectors for SVM input. Radial basis function SVM classification was performed with default parameters using the software Gist, which allows users to apply a sophisticated machine learning algorithm to the data [22]. To quantitatively evaluate a DNA/RNA-binding protein at the proteome level, the discriminant value derived by SVM was defined as a novel index, the periodicity score (PD score), and was assigned to the representative protein dataset of each of the six model species. Performance of the PD score as a DNA/RNA-binding protein classifier was evaluated by applying the receiver operating characteristic (ROC) curve to the representative set of P. furiosus proteins (Figure 2).. 20.
(24) 1 PD score RK7 CDEGHKNQRSTY8 MNQlg AF[LMPVld U.. II. .. (7 C w. 1. l-TN/(TN+FP) • Specificity Figure. Performance. 2.. of PD score. Receiver-operator-characteristic. (ROC) curves of PD score (black) and single amino acid periodicities [RK7. (red), CDEGHKNQRSTY8 (blue), MNQlg (green) and AFILMPVWlI. (orange)]. For example RK7 denotes. the frequency of the periodic region of Arginine (R) and Lysine (K) appearing in the protein sequence with periodicity of 7.. Sensitivity acids. and specificity. periodicities. demonstrated. of the PD score overwhelmed. (RK7,. CDEGHKNQRSTY8,. that a combination. MNQlg. of amino acid periodicities. system for classification of DNA/RNA-binding To further validate the performance. that of various individual amino and. AFILMPVW 11).. as a feature vector optimizes the. proteins.. of PD score, we conducted a comparative. upon amino acid composition and SVM-Prot [23]. Amino acid composition profile. for predicting. calculated defined. protein function,. 20 individual a new indicator. subcellular. amino acid compositions named. This. as composition. 21. localization. analysis. is a widely used. and protein folding.. We. as feature vectors for SVM input and (CO). score.. SVM-Prot. is a general.
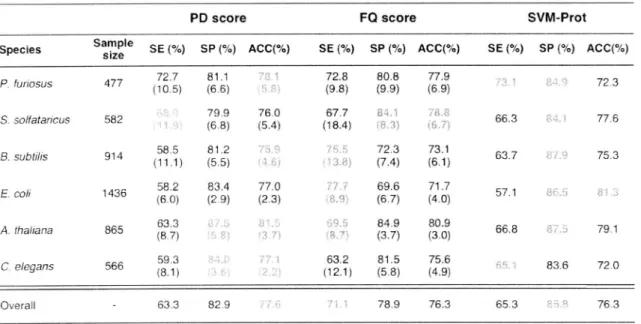
(25) proteome-wide. function prediction software based on various features of primary sequences.. Three indices, sensitivity (SE), specificity (SP) and overall accuracy (ACC) were calculated for the six model species respectively. using lo-fold cross-validation. to calculate the precise. prediction efficiency (Table 2).. Table. 2.. Prediction. the six model. performance. of PD score. compared. Sample size. SE (%). SP (%). 72.7 (10.5). 81.1 (6.6). P. furiosus. 477. S. solfataricus. 582. B. subtilis. 914. 58.5 (11.1). 81.2 (5.5). 1436. 58.2 (6.0). 83.4 (2.9). A. thaliana. 865. 63.3 (8.7). C. elegans. 566. 59.3 (8.1). E. coil. 79.9 (6.8). 63.3. Overall. Sid stands for standard deviation. TN/(TN+FP). CO score. and. SVM-Prot. in. species. PD score Species. with. and ACC (accuracy). FQ score. ACC(%). SVM-Prot. SE (%). SP (%). ACC(%). 72.8 (9.8). 80.8 (9.9). 77.9 (6.9). SE (%). 77.0 (2.3). 63.2 (12.1) 82.9. _ (TP+TN)/(TP+FN+TN+FP).. 66.3. 77.6. 75.3. 72.3 (7.4). 73.1 (6.1). 63.7. 69.6 (6.7). 71.7 (4.0). 57.1. 84.9 (3.7). 80.9 (3.0). 66.8. 81.5 (5.8). 75.6 (4.9). 78.9. 76.3. Numbers. 79.1. 83.6. 72.0. 65.3. Predicted results are shown as SE (sensitivity). ACC(%) 72.3. 67.7 (18.4). 76.0 (5.4). SP (%). 76.3. = TP/(TP+FN). in red indicates. , SP (specificity). the highest index among. the three classifiers.. The. three. proteins. predictors. due to the three. had the highest result. have. PD score. observed. overall was. shown. indices. sensitivity. comparable. based on the comparative. and PD score to improve. different. characteristic. The PD score possessed and SVM-Prot to other. Thus,. our DNA/RNA-binding. but. overall. DNA/RNA-binding accuracy,. overall. statistical. we combined. prediction. 22. highest. had the highest. methods. analysis.. in predicting. CO score. specificity.. significances the two indicator. method.. =. cannot. As a be. CO score.
(26) 2.3.3. Both. CO. score. DNA/RNA-binding. and. PD. score. are. required. for. efficient. classification. of. protein predictions. We performed 2D correlation analysis of CO score and PD score upon 477 functionally known proteins in P. furiosus. The correlation coefficient was r = 0.75 (overall) and r = 0.55 (DNA/RNA-binding. proteins only) respectively.. The 157 DNA/RNA-binding. and blue circles in Figure 3A) distributed at the right-upper. proteins (red. region of the 2D plot, suggesting. that both CO and PD score are required for classifying proteins with DNA or RNA-binding activity (Figure 3A).. A 2.50. 1.50. tU 0 U. 0.50. 0 U -0.50. -1 .50. -2 .50. 4--2 .00. 0.00. -1 .00. 1.00. 2.00. PD score. Number. B. of proteins. 0. •. Total (%). 12. 94 (19.7). I. 48. 34. class. II. 8. 39. 52. 99 (20.8). class. III. 6. 23. 256. 284 (59.5). class. 23. CO+PD. score. = 0.6. CO+PD. score. = -0.13.
(27) Figure 3. 2D correlation analysis of DNA/RNA-binding proteins in P. furiosus. based on. amino acid composition and periodicity. (A)Total477 functionallyknownproteinsin P.furiosuswas plottedon 2D correlationplot of CO scoreand PD score.The ribosomalproteins(red),rest of the DNA/RNA-binding proteins(blue)andother functionallyknown proteins(black)are shown.The two dotted lines representa thresholdof maximumMCC value = 0.59 for optimizingsensitivityandspecificity(blackarrow)and maximumACCvalue= 81.8%for optimizingprediction of DNA/RNA-binding proteincandidates(whitearrow).The rangesof threeclassesare: ClassI (CO+PDscore> 0.6), classII (0.6> CO+PDscore> -0.13)and classIII (-0.13> CO+PDscore). (B) Thenumbersof ribosomal proteins(red),rest of the DNA/RNA-binding proteins(blue)and other functionallyknownproteins(black)are countedin classIta classIII.. For efficient classification of DNA/RNA-binding. proteins, we defined two different. thresholds using a value of CO score + PD score (CO+PD score). First threshold is based on the highest overall accuracy (ACC) with CO+PD score = 0.6 and the second threshold is based on the highest Matthews correlation coefficient (MCC) with CO+PD score = -0.13. According to the Supplementary Figure 1, the first threshold optimizes the extraction of reliable candidates for novel DNA/RNA-binding proteins (SE = 52.2%, SP = 96.3%, ACC = 81.8% and PPV = 87.2%) and the second threshold optimizes the classification performance of CO+PD score (SE = 82.2%, SP = 80%, ACC= 80.7% and PPV = 66.8%). Based on these thresholds, we classified proteins into three classes (class I —class III) (Figure 3A). As a result, total 94 proteins including 82 DNA/RNA-binding proteins (Figure 3B) were categorized as class I proteins (CO+PD score > 0.6). The further observation of DNA/RNA-binding proteins has revealed a region-specific distribution of ribosomal proteins and other DNA/RNA-binding proteins. Ribosomal proteins are strongly affected by CO score and are dominant at the high range of CO score (CO > 0.5). The CO score of other DNA/RNA-binding proteins ranged between 0 to 0.5 but some of them were dominant at high PD score region (0.25 —1.5). This region includes 13 tRNA-processing 24.
(28) enzymes (i.e.,. tRNA-synthetases,. CCA-adding. enzyme and Rnase. P subunits),. 11. DNA-binding proteins (i.e., DNA polymerase, DNA helicase, DNA primase and reverse gyrase), 3 ribosomal proteins (i.e., ribosomal protein S3P and ribosomal protein Ll4e), and various transcription/translation. related proteins (i.e., SRPs4, HTH-type transcriptional. regulator and transcription termination-antitermination factor). We assume that PD score is an effective means of classifying DNA/RNA-binding proteins from a set of proteins, which cannot be distinguished by using amino acid compositions.. 2.3.4 Selection. and experimental. verification. of novel DNA/RNA-binding. protein. candidates The same procedure was applied to 994 hypothetical proteins in P. furiosus (Figure 4).. 25.
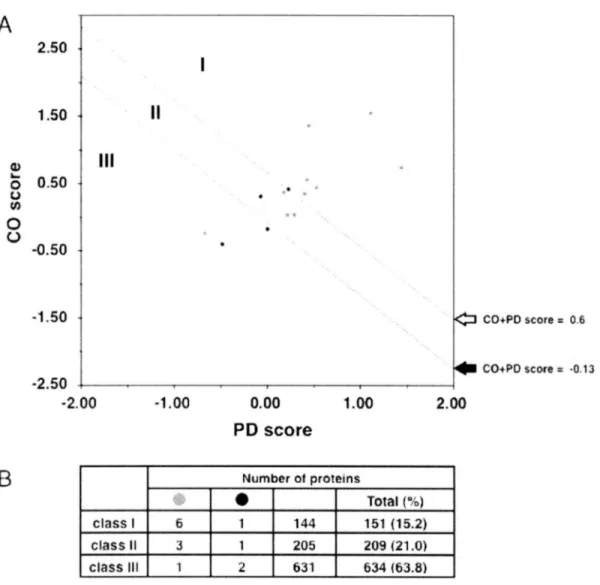
(29) A 2.50. 1.50. 2.) 0 0.50 U co 0 0 -0.50. -1.50. co+PO. score. 0.6. CO+PQ score 2 -0.13. -2 .50 •2 .00. -1.00. 0.00. 1.00. 2.00. PD score. B. Number. of proteins. I. Total (%). class. I. 6. 1. 144. 151 (15.2). class. II. 3. 1. 205. 209 (21.0). class. Ill. 1. 2. 631. 534 (63.8). Figure 4. 2D correlation acid composition. analysis of hypothetical. proteins. in P. furiosus. based on amino. and periodicity.. (A) The vertical and horizontal axis represents (CO score) and periodicity (PD score). Distributionof the 994 hypothetical proteins are shown. Experimentallyvalidated 14 candidate proteins are denoted as red circles (possessedDNA/RNA-bindingactivity) and black circles (no detectable DNA/RNA-bindingactivity) and the remaining proteins were shown as green circles. (B) The numbers of experimentally verified proteins with DNA/RNA-bindingactivities (red), protein with no DNA/RNA-bindingactivities (black) and the remaining hypotheticalproteins (green)are counted for class I to class III. The 2D plot of hypothetical proteins was similar to that of functionally known proteins as well as the protein ratio in class 1 to classIll (Figure 2 vs Figure 3). Although,the number of proteins have decreased from the high CO score (CO score > 0.5) region, which is known to be dominatedby ribosomalproteins.. 26.
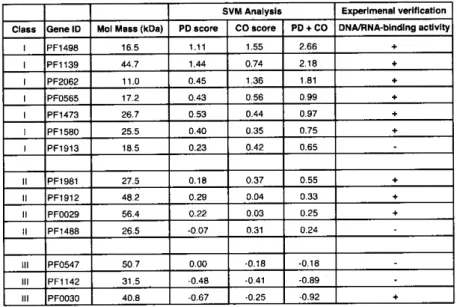
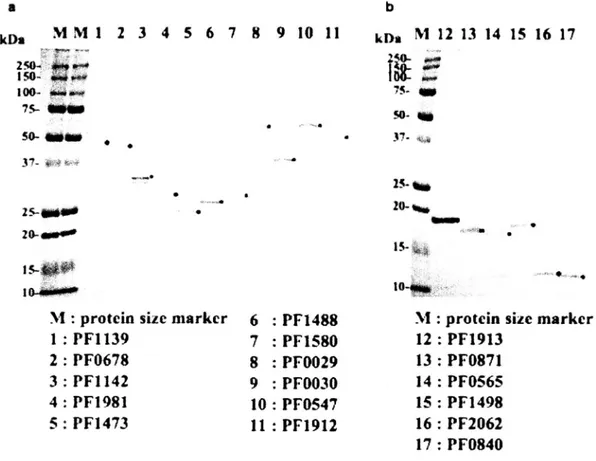
(30) As a result, 994 hypothetical proteins were classified in to three classes (I-III) due to the CO+PD score thresholds and total 151 proteins were classified as a strong candidate for novel DNA/RNA-binding proteins. In order to verify that hypothetical proteins in class I actually possess DNA/RNA-binding protein activities, we randomly chose 17 hypothetical proteins from three different class I - III (9 from class I, 5 from class II and 3 from class III, Table 3).. Table 3. Summary of experimentally validated hypothetical proteins in P. furiosus Experimenal. SVM Analysis PD + CO. Mol Mass (kDa). PD score. CO score. PFl4g8. 16.5. 1.11. 1.55. 2.66. PFllsg. 44.7. 1.44. 0.74. 2.18. PF2o62. 11.0. 0.45. 1.36. 1.81. PFos6s. 17.2. 0.43. 0.56. 0.99. PFl4is. 26.7. 0.53. 0.44. 0.97. PFls8o. 25.5. 0.40. 0.35. 0.75. PFlgls. 18.5. 0.23. 0.42. 0.65. II. PFlg8l. 27.5. 0.18. 0.37. 0.55. II. PFlgl2. 48.2. 0.29. 0.04. 0.33. II. PFoo2g. 56.4. 0.22. 0.03. 0.25. II. PFl488. 26.5. -0 .07. 0.31. 0.24. III. PFos4i. 50.7. 0.00. -0.18. -0 .18. -0 .41. -0 .89. -0 .25. -0 .92. Class. Gene. ID. III. PFll42. 31.5. -0 .48. III. PFooso. 40.8. -0 .67. DNA/RNA-binding. verification activity. The DNA/RNA-binding activities were examined by gel shift assay at room temperature (22 °C) and 75 °C. *The RNA-binding activities of PFl4g8 was examined by 1.2% agarose gel electrophoresis and ethidium bromide staining due to the co-purification with endogenous RNA in E. coll (see Figure 5C).. All 17 recombinant proteins were overexpressed in E. coll and purified to near homogeneity (Figures).. 27.
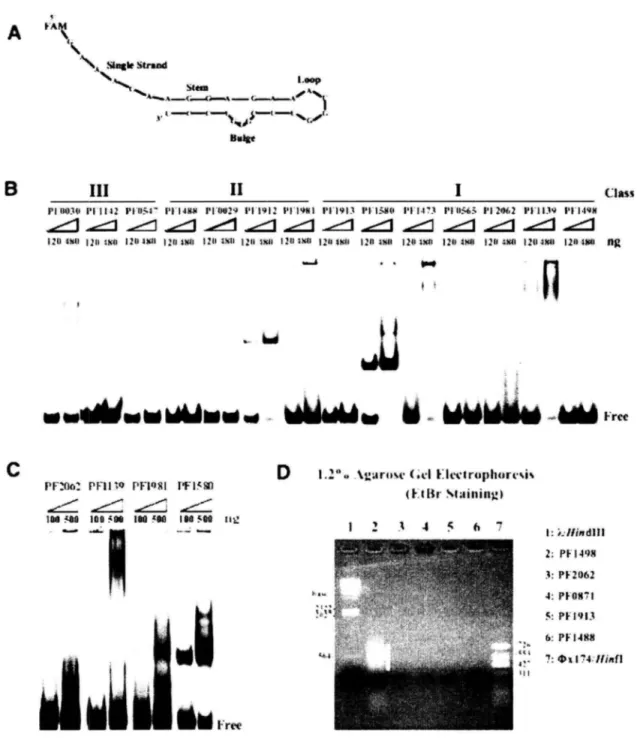
(31) a. b. kDsM. M 1. 2 3. 4. 5. 6. 7. 8. 9. 10. 11. kDa. Ni 12 13 14 15 16 17. 250- Op 150too-. 75- —. 75-. S837-,Q,. 50- 11110410 37--.•. 2520-. •. •. 25--UMW•. .... io-.w.•.. #rest. 15•, r.. to-.. 1o-+to^ M : protein. size marker. 6. PFl488. 1 : PF1 139. 7. PFls8o. 2 : PFo6i8. 8. PFoo2g. 3 : PFll42 4 : PFlg8l. 9. PFooso. 10. PFos4i. 5 : PFl4is. 11. PFlgl2. M : protein size marker 12 : PFlgls 13 : PFo8il 14 : PFos6s 15 : PFl4g8 16 : PF2o62 17 : PFo84o. Figure 5. SDS-PAGE analysis of purified 17 hypotheticalal proteins in P. furiosus. SDS-PAGEanalysisof purifiedcandidateproteins.The positionsof of the the 17 17 purified purified candidate candidate proteins proteins are are markedwith blackdots. 10-20%(left column:a) and 15-25%(right ;ht column. :b) gradient. gel was used for. proteinsof largeandsmallmolecularsize(M, proteinsize marker;Bio-Rad).. To study the DNA/RNA-binding properties of the candidate proteins, we first carried out gel-shift assays using 5' FAM-labeled, 2i-bp, multipotential oligoprobe RNA (MPOR-2i) (Figure 6A). MPORs potentially possess four different secondary RNA structures (stem, bulge, loop, and. single strand), which. encompass the currently. known. structures. corresponding to the activities of various RNA-binding proteins. Three proteins, PFo8il, PFo6i8 and PFo84o, aggregated in the loading well, so we removed them from the final results.. 28. X4o-.
(32) s. A N . SlogleStrand Loop Stem. 1,1 ,1,c! Belo. 6. III. II. pl 1100. Plll42. pi-ll:a,. 120. 1211 11+00 1211 ltin. i'i•14N$. 1.1•Oe2g. 120 OA. 120 vol. 1 1.11912. i2ll. 1x0. PFlso. 1' l'l'lgNl. ('1.1913. 12 WI 1211. 1211 Sltll. l'l'l.1'3. Pl'llsg. 1'1.I.9/1. 121^i$II 12412xll 1:t^ 001 120 OM 12114x4l 120 ssa • •. .....i. Class. PI '115.63l'l2o62. hg. Pry,. t ~. tr 11r. ed ti i. lr~. è. .r. C. D PF2oa:. PHI. to. 104 MA. 100 548. PFIQ8I. 1- It8[l. 180 561. 160 500 _. 1.2.°0. .%gartrs.e. (.t•I. Free. Electrophoresis Staining). tie.. 1. ...... Z. 4. .. 6. ?. I :. _Ilindlil 2: PF 1498 3: PF2g62 4: pie$171 5: Pllgls 6: P F 1481$ te,. 7: mx 174, llinfl. Free. Figure. 6. Experimental. verification. of DNA/RNA-binding. activities. of 14 candidate. proteins. (A) Nucleotide sequence and possible RNA secondary structure of multipotential oligoprobe. RNA. (B). Detection of RNA-binding activity of 14 candidate proteins by gel-shift assay at room temperature (24 °C). (C) Gel-shift assay of four candidate proteins with prominent RNA-binding activity at 75 °C. (D) 1.2% agarose gel analysis of purified protein peak fractions. White bar indicates the existence of nucleic acids. Lanes 1 and 7 are DNA markers.. 29.
(33) A prominent shift of the RNA probe up the gel was observed in candidate proteins PFoo2g, PFooso, PFos6s, PF 1139, PFl4is,. PFls8o, PFlgl2, and PF2o62 (Figure 6B). Interestingly,. the formation of certain nucleic acid—protein complexes appears to be temperature-dependent. For example, PFlg8l. showed a significant shift at 75 °C but not at 24 °C (Figure 6C vs. Figure 6B). PFoo2g, PFooso, PF 1139, and PFls8o also showed binding affinity with the multipotential oligoprobe DNA, MPOD-2i. (data not shown). No significant shifts were. observed in PFos4i, PF 1142, PFl488, PFl4g8, or PFlgls,. though agarose gel analysis of. purified PFl4g8 revealed it to be a potential protein—nucleic acid complex (Figure 6D).During our investigation, five out of six class I proteins, three out of four class II proteins and one class III proteins were determined as novel DNA/RNA-binding proteins (Table 3). According to our previous works [8-10], systematic screening of P. furiosus genome using the expression cloning method has determined several DNA/RNA-binding proteins (such as Rnase HII, FEN-l, Thy-l and FAU-l) and its possible biological functions. Our system also demonstrated that approximately 10% to 20% of the P. furiosus gene products are to be involved in nucleic acid metabolisms. Thus we suggest that the 10 newly discovered DNA/RNA-binding proteins are determined through experimental procedure with certain specificity. The in vive targets and precise biological functions of the 10 newly identified DNA/RNA-binding proteins are to be further investigated. According to the domain assignment of the InterPro/Pfam domain database [24, 25] against P. furiosus proteome, 95-98% of the 942 functionally known proteins possessed domains related to those with known function (functional domains). On the other hand, for 994 hypothetical proteins, only 31% — 38% of the proteins possessed functional domains, 20% possessed domains of unknown function (DUF / UPF) and the remaining 4350% lacked domain annotation (Supplementary Figure 2). According to Supplementary Table 1, among the newly discovered 10 DNA/RNA-binding proteins, at least four ORFans are detected. 30.
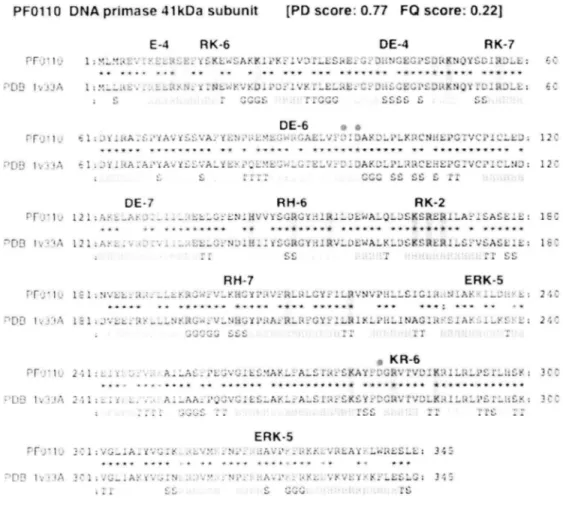
(34) (PFoo2g, PFooso, PFos6s. and PFlg8l). which completely lacked sequence similarity. (E-value > 0.1) compared with any of the swissprot protein entries. The remaining six proteins have shown sequential similarity to the hypothetical proteins of nearest BLASTP hit (8.ooe-oi > E-value > 0.0) which were conserved among Pyrococcus and Methanococcus including two proteins (PFl4is. and PF2o62) with no Pfam domain annotation. Thus, we. believe that combination of CO score and PD score is a powerful indicator for predicting DNA/RNA-binding proteins from sequence specific ORFans and a set of proteins having no obvious functional domains, even allowing that the sample size of validated proteins is still small.. 2.3.5 Possible explanation. of charged amino acid periodicity with DNA/RNA-binding. activities As the amino acid composition within proteins varies among taxa [26], our method removes the need to allow for the evolutionary gain and loss of amino acids and increases the generalization capability of SVM training. Figure 7 presents an example of charged amino acid groups that appear periodically in the amino acid sequence of DNA primase.. 31.
(35) PFolI 0 DNA primase `'1('}E-4 '-_ i _z ^' z... I :.._A. 41 kDa subunit. [PD score:. 0.777 PQ score.. 0.221. fi~t RK-i 1 ~`...!<<. ._a'... RK-6 ..r dlcq'..x e..sti;. .az'K .:.'..~i LL :! >., 1_ >DE-4yF ?..s ~.,i .':4w~l-IS.:'^x i wa "si,~.° ... ' ~' :. .t. ^ w s . • r x . r w• ..~, .x i ^ s ^'I +.^ + ^ r ^ f ^ ti!.y... ^ x . @`DS x x SYs rw 9F7 I , M...._.A . __.......F'c::*? _ Z.N „a'<r:'Ya.:,. i _ L_ ..tY.'X". _.i....a(L,^ .v..:..:<.:OC...12'..>wiiEN, I ..i..rio4.J_E: EC • _s •JC+;.? .'`lHIV." JJwT.J wT wT '. DE-6 0 .1.zsit'falr:i:aYttS.'i=:t°•.++,a.+ane'f'ls'.:,..I...~.i(LiY:..,Ew•Y.:.i.L..•L.:•+L ^ ^:+w•. ......... .^A r x•x,Y^w • Y!.X..x.. ^ . ... * 7t ^M +sryr+R ^Rt*f 7Y ^!^1•x'+k ryt•zaNs<.s•Y'^t,,r<Ixf<.,,,,,C i ~.•xi'l:Z.r.31:~1:. •'YS'~...Y:..,..":~if~:e.._t£~..<fi>_2..~...,~a:.c' .Py.120 r.f t. RH-6RK-2 IEC ....:..'...• * ......... ws. ... .......... ****ww f s ^ s«arr ~> .~ ~t d>a ~i l •:1, ..... .:...., ."...«" ..,:,a:... ...c #:.?+h:....x...`'~ `~~ s.?~:..iT'Y M..,:.;v1<'i ~ ..stv«~ ..?.a.Y ..~. ~.1..:wt. 'J.,T lYJ a - ..... I ` '. ..• •:1_. DE-i. ':lam.r:.>::1 (' .1j.RH-/,gj,TqyVy,ti,KERK-s.2,IC Pi_l..1 •N~Vs= .,.,a4 .__."....... <.w3,..,.~~ ...."':•,..2~.,V....i'F..i.t...+.^Il....IIiit.tiPi _....LS IC .I,..~~~-!'D......,..,.. r x +. ...... 1• t tF,t ^5k,w^ 7F tRXyrw?R••'>' Y^f +)t RR ww,w. ~ <, irlr'4~`!!°t~y. r~4t'...~ll:A,i_~.."Y...L.,l;..........~:"'~'..~'ku~'~8.~<.!~r:(il«~~~a..:(~<.5~,..w..,lw~.~:2Tiuiy~%.7.-:~t{..,...-.. .i:.0 KR-6 ~,~>:.•, t (`f::.,..1 y}x.:,ses"gre.,"szzr;..~ }•"'7C` >,,. 2'1~..~ 1 .....I ....i:.... .,,,s.. _ i..Jv"~,.. ..zs^•x;•;, i"....',tis...._TS,....•1 [: Ol'ttl. «'<.72 Yi i)z.. ... :~. ,....c~....3 ...•a... ..s~z, ..ri'.. ~~r..~ w• • > . • .s, i • . s s.r...... 'ItA'F. vwy• ^ i os f ''~.'.....Ir,~'_......__...a_Yt.l...V,..IM...•_y•~u:,se,a''tt~a::,...v37.'...i._ 'r3c:'113s?tit:•~<rli~tl~.~!'Z.:r.T~<(~u~_~~u~~><~~Y«r.;f;3..i~~.:.Ti,~~ }"il ~`ti. ^ (lERK-s ~~ _ 1_ ~ T~ ~1v i•. ` _ .i__ ....Y:.' ,. .,...,.`xii.i, i k ..i^.:'4:.:> :..G.: 34: .... • • • • • a !.s •x. • . . xYwt• ^r. x *y!! i03 . .''A . '. ..i• .' f':..3•~ ~4. `~. ~''I . ^ .;i1 ..'.--^:a." sV . . 3^~''. ...a'.. ~)...+J. 7•i•.. Figure 7. Schematic. representation. of Amino acid periodicity. in the sequence. of DNA. primase. The distributionof amino acid periodicitieswith structuralfeatures were observed in many class I proteins with high PD score and low CO score (PD score > 0.25 and CO score < 0.5). Amino acid sequencewas aligned with closest structuralorthologues registeredin the ProteinsData Bank (PDB). The periodicregion consists of overall region (colored squares) and amino acids correspondingwith periodicities (oblong box). Periodicity includes error range ±1. The conserved amino acids between P.furiosus protein and the structurallyknown proteins with same functions are marked with asterisks. DNA primase 41kDa subunit (PFolio) is aligned with orthologous protein PFolgs in Pvrococcus horikoshii(PDB_ID: 1vssA) with 79.1% identity. Putativeactive site residues are markedwith red dot. An amino acid periodicity of both positively and negatively. charged amino acids with. various periodicities were widely found throughout the protein primary sequence. The amino acid residues creating the periodicity (oblong boxes in Figure 7) are often conserved in the 3D. 32.
(36) structures of orthologous proteins. Similar feature was observed in other proteins with high PD score such as Signal recognition particle 54 kDa subunit (SRPs4) and HTH-type transcriptional. regulator lrpA (Supplementary Figure 3). Periodic region also covers. DNA/RNA recognition motifs of these proteins known as M domain and Helix-Turn-helix as well as DNA primase active sites. We suggest that these periodic features might affect the secondary. structures. or the net. charge. of the protein. surface. to enhance. the. DNA/RNA-binding capacity. These charged amino acids, especially basic amino acids have previously been suggested as a key component of nucleic acid binding activity; for example, arginine-rich regions of the Drosophila melanogaster suppressor of sable gene [27] are thought to mediate specific RNA-binding activity. Similar features have been observed in the structural motifs of DNA/RNA-binding proteins that possess positive electrostatic potentials in the binding site region [28-30]. On the basis of electrostatic potential, negatively charged amino acids (DE) conflict with DNA/RNA-binding. However, recent work has revealed that negative peptide charges contribute significantly to the electrostatic free energy of positively charged peptides and affect RNA binding [31], suggesting the importance of not only basic regions but also in some cases, acidic regions at the protein surface, for establishing DNA/RNA-binding functions. Further detailed analysis of the relationship between DNA/RNA-binding capacity and specific amino acid periodicity will be an important task with the help of other bioinformatics approaches such as the use of DNA/RNA binding site prediction software [32-34], a comparative genomics approach that predicts function based on the comparison of various domains [35], and three-dimensional protein models [36].. 2.4 Conclusions In this paper,. we have presented. a new method. 33. for predicting. novel. DNA/RNA-binding.
(37) proteins at the proteome level by focusing on compositions and periodicities of amino acids with similar physico-chemical profiles (quantified as a novel index denoted as CO score and PD score).. The 2D correlation analysis of CO score and PD score effectively separated. DNA/RNA-binding proteins from other functionally known proteins in P. furiosus as class I proteins. Similar distribution plot was observed for the hypothetical proteins. Total 10 novel DNA/RNA-binding proteins were determined experimentally including four ORFans and two proteins with no domains. The 2D correlation analysis of CO score and PD score is applicable to any organisms with complete genomic data. To conclude, our method is highly efficient for evaluating hypothetical proteins on the basis of DNA/RNA-binding function. The prediction results derived from CO+PD scores can be further integrated with prediction results from various protein function prediction and annotation methods to validate uncharacterized proteins. comprehensively.. Further. investigation. of. these. newly. discovered. DNA/RNA-binding proteins might elucidate the role of undiscovered protein—DNA/RNA networks and the recognition of many non-conserved proteins throughout entire species.. 34.
(38) Chapter tRNAs and. 3. A were. s'half. new. evolved. tRNA. hypothesis through. for the. fragments. 35. tRNA. combination. evolution. in. of ancestral. archaea: s'half.
(39) 3.1 Introduction The origin and evolution of tRNAs are widely discussed since the accumulation of genome sequences has provided comparative analysis of numerous tRNAs. A model has been proposed suggesting that the tRNA molecule must have originated by direct duplication of an RNA hairpin structure on the origin of the transfer RNA molecule [41]. Preceding studies have shown that single hairpin RNA structure called minihelix (tRNAacceptor-T 'P C arm helix) can be aminoacylated by modern tRNA synthetases [42]. Thus two halves of tRNA, 5' half (containing D arm and anti-codon) and 3' half (containing acceptor stem and T arm) are considered to be originated and evolved independently in the early genomes. Interestingly tRNA-like structure containing s'-terminal CCA sequence appears in the s'-end of various RNA virus, retroplasmid and bacteriophage genomes to initiate RNA/DNA replication by replicase or reverse transcriptase [43,44]. Futher, 3' half is recognized by series of tRNA maturation enzymes: RNase P, aminoacyl-tRNA synthetases and CCA-adding enzymes suggesting that 3' half of tRNA is an ancient structural domain acting as a "genomic tag" in early protein-RNA world [45]. Therefore 5' half is considered to be arose after 3' half to provide additional specificity of corresponding amino acids at s'-end [44]. Recently, 3' and 5' tRNA fragment of total six different tRNA genes were found at separate region in the genome of hyperthermophilic archaeal parasite Nanoarchaeum equitans [46]. Both 3' and 5' tRNA half genes possessed conserved polymerase III promoter consensus box A motif at the 5' flanking region suggesting that these sequences are transcribed independently. There is also an argument of an evolutionary link between these split-tRNAs and intr on containing tRNAs. Transfer-RNA genes in archaea often have intrans intervening between exon sequences. The structural motif at the boundary between exon and intr on is the bulge-helix-bulge (BHB) motif [47]. This motif was also found in the processing leader sequence of split-tRNAs [48]. Thus, we consider the evolutional linkage of the three types of tRNAs by analyzing exonic. 36.
(40) sequence. of the 1302 tRNA. theory. that the present. tRNA. fragments.. branched. tRNAs. were emerged. Phylogenetic. near other. same amino. as well as 5' and 3' tRNA. acids.. archaeal. analysis tRNAs. The combination. amino. acid in the genetic. halves. but with. differed. sequence. stage of archaeal. tRNA,. a variety. genetic. from. has shown. with. the combination that exonic. identical. identified. tRNA. These. results. combinations. have. to support. of individual. the. 5' and 3'. of the split-tRNAs. anticodon. correlated. a set of tRNAs. of the 5' region. of s'-s'. halves. separately. sequences. and synonymous. of 5' and 3' tRNA. code. We have. fragments. encoding. with the variation. with conserved indicates evolved. the of. 3' tRNA. that in the early to construct. the. code.. 3.2 Materials. and Methods. 3.2.1 Preparation. of the genomic data. The genome sequences of 30 archaeal species were down loaded from European Bioinformatics Institute web server (http://www.ebi.ac.wk/genomes/archaea.html). in EMBL. file format (Rel. 83) except, the genome sequence for Uncultured methanogenic archaeon RC-I (GI:116077928), was down loaded from National Center for Biotechnology Information. In total five Crenarchaeota (such as Aeropyrum per nix K], ape), twenty four Euryarchaeota (such as Pyrococcus furiosus, pfu) and one Nanoarchaeota (such as Nanoarchaeum equitans, neq) were prepared. Three types of tRNAs: nonintronic-, intronic- and split- tRNAs were obtained using tRNA predicting software SPLITS [49]. The intr on and split intrans (sequence constructing the BHLmotif and GC-rich duplex for the split-tRNA) are removed to prepare total 1302 mature tDNA sequences for the analysis.. 3.2.2 tRNA sequence analysis All tRNA sequences (input as tDNA sequences) were first aligned using ClustalW [50] with. 37.
(41) the following settings: the Multiple Alignment parameter Gap Opening 10.00; the Multiple Alignment parameter Gap Extension Penalty 0.1; and the Multiple Alignment parameter Delay Divergent Sequence 25% [51]. Several types of phylogenetic trees were constructed using sequence alignment data. A neighbor joining (NJ) tree was constructed using ClustalW. Maximum likelihood (ML) tree and Maximum parsimony (MP) trees with 1,000 bootstrap replicates were constructed using PAUP 4bio [52]. Bayesian trees were constructed using MrBayes v3.1.2 [53]. The model of sequence evolution was determined by MrModeltest ver2.2 [54]. Finally, these phylogenetic treefiles was described using Hypertree and Treeview... 3.3 Results and discussion 3.3.1 Comprehensive phylogenetic analysis of tRNAs in 30 archaeal species Total 1302 archeal tRNAs including six known split-tRNAs were aligned based on clustal X algorithm. Pairwise alignment was performed based on the exon sequence of the tRNA gene (using tDNA sequence as an input).. 38.
(42) 5. pro 3. ArtyTrp. Arg Various 4 S. Gly. Lew!Ser/Cyst,.-'r. Ser. 3<d,'. val. 38 ^ Lc u.. 37,\ 'll,. Pro \sgVal wArg. \:\\\.~. Lew 36. \11Various. It:.6. 'F. Cys/SeC 35/',..4,,,s ,,. ,''12. Arg lsArg. Ser/Cys. 34. #'''./dfr'#'. ...`. \' e„,:,, eMet33\ ,;;;,/ ,,,,,i?/. 32\,,,../-,,' 32\,.„r: '. 1,. if,lie \eMet 30$,'°~. This.;i;.. Thr 31. efolet. Phe Phe2g2',8 2,,:19 ,. 8. Phylogenetic. The phylogenetic. tree. of 1302. NJ tree was constructed. 2'24 23 22 Arg Gin. archaeal. 21 His. 18. 17. lie. ~,VariousAih. I. PheiTyr P he/Ty r 2'''' 27 --...., Various Ash Various Ash 26. Figure.. ,. fY.. 30. Gill/Asp. tRNAs.. based on the alignment. of predicted. 1302 tRNA sequences. complete genome of 30 archaeal species. The tRNA clusters are denoted by number and corresponding acids. Red letters indecate the phylogenetic tRNAs corresponding. to several amino. including. derived. N. equitans. euryarchaeon. position of the six split-tDNAs. acids. The tRNA clusters. tRNAs (red), without. N. equitans. derived tRNAs only (blue) and crenarchaeon. Cluster denoted as "various". are classified derived. into four categories;. tRNAs (orange),. from the amino include clusters. cluster consists of. derived tRNAs only (green).. As a result, unrooted NJ tree was constructed and relative distance of each tRNA tax on was determined. The 1302 tRNAs were clustered into 39 groups based on their sequence similarity and most of the tRNA clusters. were dominated. by synonymous. tRNAs. with. 1 or 2. corresponding amino acids (Figure 8). The exonic sequence of split-tRNAs and other intronic 39. te. o.
(43) tRNAs were clustered within the same cluster suggesting an evolutional linkage between the three types of tRNAs. (The pricise phylogenetic locations of the split tRNAs and intronic tRNAs were further discussed in the section 3.3.2). Total 31/39 (79%) clusters were dominated by the tRNAs corresponding to the single amino acids suggesting that these tRNAs with synonymous anti-codons could have common ancestral tRNA. For example, 60 out of 61 archaeal Glycyl-tRNAs (Gly) are clustered in the same branch (cluster no.6 in Figure 8) with consensus of [N]CC (GCC, TCC, CCC) anticodon rules. The feature of first cod on in archaeal tRNA severely excludes adenine (A), which were previously shown in Marck and Nikolajewa's works [55,56]. The same rules can be observed in various tRNA clusters for example, Valine (Val) with [N]AC, praline (Pro) with [N]GG, Alanine (Ala) with [N]GC, Seline (Ser) with [N]GA, etc. These results indicate that in the early stage of archaea, ancestral tRNA anticodon and corresponding amino acids were severely restricted by the strong selectivity of second and third cod on as well as lack of adenine in the first cod on. Based on the exon tRNA sequence, about 80% of the tRNAs with same anti-codon should have evolved from the single origin, indicating that common ancestral archaea may have already possessed a genetic code similar to that of universal genetic code. In that environment, error in second or third anticodon will alter the charging of amino acid, which can be very critical for the species. As a result, only 17/39 (44%) of the tRNA dades were conserved among all archaea (dades filled in red: Fig.8), suggesting that about half of the tRNAs were sequentially stabilized before the differentiation of three major archaeal dades (nanoarchaeota, crenarchaeota and euryarchaeota).. 3.3.2 Phylogenetic location of the six known split-tRNA and other archeal tRNAs Since the six split-tRNAs have possessed sequential similarity with other tRNAs with same anticodon, I focused on the evolutional relationship of six split-tRNAs derived from. 40.
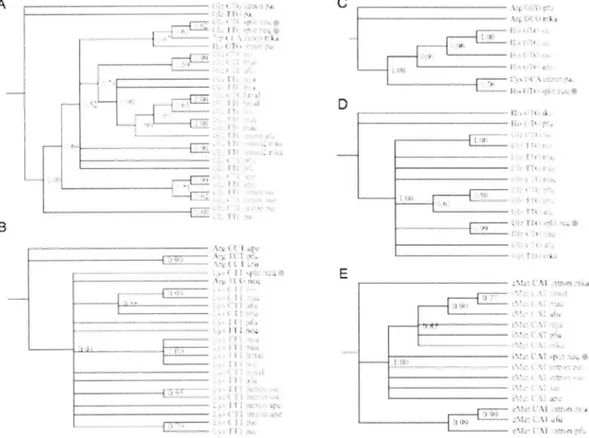
(44) • •. Nanoarchaeum. equitans with other intronic and nonintronic. tRNAs of archea. Split-tRNAs. were aligned with tRNA sequences of the same cluster (cluster number:14,. 19, 22, 25 and 32. in Fig. 8) and precise phylogenetic analysis was performed.. C. A. r •. IrtI'. E?I .i I:.. { 1,'. •. El • •. "a .. 3. fi. >k.. i E {. .. •. fi I•. il :. •. k,. ,. B I ,.. E "~.. •. '~.. • •'`,. "=. [. •. \I. ..... •?:. a. =. 11. f 1 •. Figure. 9. Phylogeny. of the six split-tRNAs. based. on the Bayesian. tree. Bayesian approach is performed for the six tRNA clusters including split-tRNA plus adjacent tRNA cluster as an out group using MrBayes[53]. Evolutionary model for each tRNA clusters were determined by MrModeltest2[54]. Clade credibility is described with threshold 0.5. The locations of split-tRNA taxons are shown in red circle. The colored square represents other tRNAs with synonymous codons in euryarchaea (orange) and crenarchaeota (green). (A) Bayesian tree of glutaminyl(Glu)-tRNA cluster with Glutamine(Gin)-tRNA used as an out group. (B) Bayesian of Lysyl(Lys)-tRNA cluster with Arginyl(Arg)-tRNA used Histidyl(his). -tRNA. glutamine(Gin)-tRNA. cluster. with. Arginyl(Arg)-tRNA. as an out group. (C) Bayesian tree of. used as an out group. (D). Bayesian. tree of. cluster with Histidyl(His)-RNA used as an out group. (E) Bayesian tree of initiator. Methyonyl(iMet)-tRNzzA with elongator Methyonyl(eMet)-tRNA as an out group.. 41.
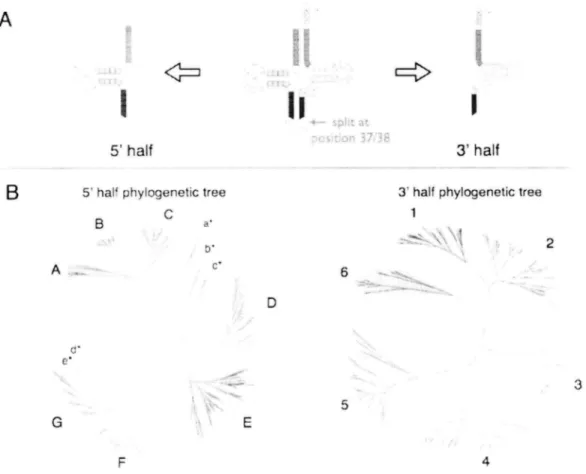
(45) As a result, exonic tDNA sequences of the six split-tRNAs (two Glu, Lys, His, Gin and Met) were branched at the root of the subtree cluster with synonymous tRNA anticodons derived from both crenarchaeota and euryarchaeota lineages (Figure 9). The three types of split tRNA (Glu, Lys and iMet) were conserved among all archaea, although Histidyl-tRNA and glutamine(Gin)-tRNA. were only conserved with tRNAs derived from crenarchaeota or. euryarchaeota, suggesting that these split-tRNAs could be the common ancestor of present tRNAs Although, positive or negative selection seems to be occurred for some tRNAs which can also be confirmed in Fig.8. In addition, several intronic tRNAs were found within the same tRNA cluster, yet further analysis is necessary to discuss the origin and evolution of these intrans. These results strongly support the fact that split- intronic and nonintronic tRNAs emerged from evolutionary common ancestral tRNA sequence.. 3.3.3 Phylogenetic analysis reveals different origin and evolution of the 5' and 3' tRNA halves Phylogenetic location of split-tRNAs and intronic-tRNAs have shown evolutional relation between the three types of tRNAs in archaea. Thus, archaeal tRNA sequence may still possess an evidence of the 5' and 3' tRNA selection and combination through evolution. To support this hypothesis, seven archaeal species including one nanoarchaeota: N. equitans (neq), three crenarchaeota: P. aerophilum (pae), A. per nix (ape) and S. solfataricus (sso) and three euryarchaeota: P. furiosus (pfu), M kandleli (mka) and Mjanaschii (mja) are chosen, for it is known as the closest taxons to the Last Universal Common Ancestor (LUCA) [56]. In total, 304 tRNA sequences from the seven species were extracted and each tRNA was separated at the cannonical exon/intr on junctions (position 37/38). Unrooted NJ tree was constructed for 5' and 3' tRNA halves respectively. According to Figure 10B, the s'half tRNAs are categorized into seven large taxa (A-F) and five small taxa mainly filled with pseudo sequences (a*-e*).. 42.
(46) L. The s'half tRNAs are clearly seperated possesses. root as the internal. phylogenetic. relationships. node.. into six large taxa. Each of the large tRNA taxa These phylogenetic. trees tells us only about the. of each taxa. although clear difference can be observed between. the phylogenetic topology of the two tRNA halves. A. r=>. II. I. 5' half<=3 B. 5' half phylogenetic. 3' half 3' half phylogenetic. tree. tree. 1 Ba' 2 A. ._. 6 D. £* 3 5 GE F4 Figure. 10. Comparison. of the tree topology. of 5' half and 3' half tRNA. clusters. (A) Schematic representation of 5' and 3' tRNA halves used in the phylogenetic analysis. The tRNA sequence were separated at position 37/38 to produce 5' half (position 1 to 37) and 3' half (position 38 to end) tRNAs respectively. (B) The unrooted NJ tree was constructed based on the 304 tRNA sequences derived from 7 species (neq, pae, ape, sso, pfu, mka and mja). The cluster ID was denoted alphabetically (5' half) and numeric (s'half) for easy comparison. The color of the cluster responds to the genetic code in Figure 11.. To. examine. hypothesis. the. evolutional. that selection. differences. between. the. of 5' and 3' tRNA combinations. 43. two. tRNA. halves. have actually. and. happen. support. our. in the past, we.
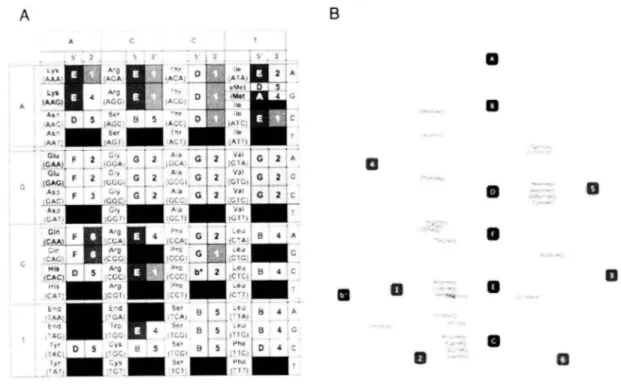
(47) filled. the cod on. table. with. the cluster. ID of corresponding. tRNA. halves.. B. A A ,. fi r. ":'i. 3. Lys, €A.AG)iAGG. ; Ac,... ALA• ,,,:;AC,,. As, Aaluer. 0 A. .AGA D. 0. 3. 5. tAf.:C.; D 11 ,Ate.C:. G. 2. ,C,.., A:a' ..G 2.. .:,,,,,, A'aG 2,Val G'7 ,...,CCI•:,:`.; ,1C2,. A,val. AA,;AC,. .c.A.,l,,6,,.,w, G.:f2:}.y (GAGA ,;GGC Asps"r ....P.!.',.C.)i. G . ..2 G2 C .i :. G • 2. CIA Fa-o _ CM7.....;:ti>A; _r..~. B. ,C ,:..,GA; ____ ........„. ,•,:•A, ,acc.: ,...„....... • . lc 2• .,....b*2 , ,,',C ICA B. ,CAC,,...,st_ rlg4. t,,,,1111 ";. C-CTI,C,'. .."ll. Iyr ot Ar'...f.:: 1yr::,is. j. :..ye ty. B. 5. 4. S. A. 11111 13,MI'. , AiB ' 1-• ""' sec 8 , 5 , , ,..:,. iAA'i.IA< t^,r,fr,,. •. iiiirG 2. iiii. C:A''i'G?. 4. 4. £i. 4. B. d. 0. L. 0. 8 1 5 „1Yhe1D4. ,t, Mil PI,. 111111 ICI:. Figure. 11. The combination. of 5' and 3' tRNA. halves. in N. equitans. (A) Cod on table is filled with the cluster ID of 5' and 3' tRNA halves derived from N. equitans (neq). The six cod on corresponding to the split tRNA is filled with pink. The color of each ID responds to the color of clusters in Figure 10. (B) Combination of 5'- 3' tRNA in N. equitans are visualized as a interaction network. Each node represents 5' tRNA fragment (black) and 3' tRNA fragment (blue), thus tRNAs are represented as edge in the network.. Figure 11A shows the cod on table filled with the ID of N. equitans 5' and 3' tRNA cluster respectively.. The combination. how 5' —3' combination. of 5' and 3' tRNAs elucidate several interesting features of. are selected. Firstly, combination. of 5' and 3' tRNA seems to be. strongly correlated with the genetic code and specific relativity between the 5' -3' pair and amino acids can be observed (i.e., A-4 for iMet, F-2 for Glu, B-4 for Lew, etc). Some of the combinations. are common used among several codons encoding different amino acids.. 44. For.
(48) aN 5. example,. tRNA encoding. Glysine. (Gly), Alanine. (Ala), Valine. anticodon. CCA are all consists of G-2 combination.. (Val) and praline. These commonalities. visualized as an interaction network of 5' and 3' tRNA fragments (figure. with. were further. I 13). In N. c'quitafl.,,. all fragments except cluster C were used for constructing total 43 types of tRNA sequences. The combination of s'-s'. fragments for the six split-tRNAs are various, which includes tRNA. fragments from cluster '/\".. 'I)', '2', '4', '5' and '6'. Same features were observed in. the colon tables of other species (Supplementary. figure 4). To identify the conservation of 5'. and 3' pairs among the seven species, the cod on tables and the network of each species were integrated and further analyzed. AB 13. Al. a. ,ay.A:,2Ar.;... A. E,A,~,ATA,. <.'.E t.,.TIC,...,..,Avis?C:. 10. :;.c•A>"Q. 's:>. 713. Via..{. l'S'f.5Al) A,',St. 018. fl:,1:•.. rt A.':°:>::::CIA,so,, ,.,t:<.t{:,3y,6.,213.,'. ,LTA .£'G•y. ,,. 'G?ci'. 1,2. A. .C.•(f. 1,2. C;. Gd`. 1:2. ;N.mAri'r: :Al;v~ii:I?T: lTAAY,Y•'tr;Alt. ,,,,aim'tr. ,TF<;:{~viv:.,'~:~.;fit'-fig Ti.r,,wt_,{,>~. ITAZ:C:C,Cr..`. 12. The combination. 0. 32. A. : 3. ,:::cif B:Cs.-„ n,. G C. i13.•Cg:~?.0. fA1:Mill'IGT' ''C(1` Figure. 0 43 45. eL*{;CatsAs;+v„,INN ,r, la 2.(PG••C _AA:.a'..,,,A,11_l.i :~CTA' :;:>~ffiPPG*c. 41. 0 39. 27. 0 22. 2. t2;. 1. 30 1 el. a 20 0. 42. of 5' and 3' tRNA. halves. 0 12. in N. equitans. (A) A consensus cod on table is constructed based on the 7 species (neq, pae, sso, ape, pfu, mka and mja). Conserved 5' and 3' tRNA halves among the 7 species were shown due to the variation of tRNA fragments for each cod on. Cod on with only single variation is shown in red (conserved in all 7 species). Cod on with two variations are shown in yellow (variations conserved in all taxa), green (variations conserved only in neq and crenarchaeota) and blue (variations conserved only in neq). (B) Consensus 5'- 3' tRNA network is visualized. Each node represents 5' tRNA fragment (black) and 3' tRNA fragment (blue), thus tRNAs are represented as. 45.
Gambar
+7
Dokumen terkait
ANALISIS KOMPETENSI PEMBUATAN BATIK CAP BERDASARKAN TUNTUTAN STANDAR KOMPETENSI KERJA NASIONAL INDONESIA PADA PESERTA DIDIK SMK NEGERI 14 BANDUNG. Universitas Pendidikan Indonesia
Hasil yang didapat menunjukkan bahwa periode SMA yang kecil (jangka pendek) cukup baik untuk memprediksi trend harga saham, namun untuk SMA jangka panjang, hasilnya masih jauh
Menimbang : bahwa dengan adanya perbaikan gaji pokok Anggota Kepolisian Negara Republik Indonesia yang berlaku terhitung mulai 1 Januari 2006 sebagaimana dimaksud dalam
alam, bencana, konflik antaranggota komunitas secara damai, masalah kesehatan, penyakit, dan cara hidup lainnya sehingga pengetahuan tradisional sangat
Conclusion of the research were indicate that supplementation of concentrate feed rich Omega-3 to filial Etawah goat received grass silage with or without mineral lick could
“ Upaya Meningkatan Hasil Belajar Matematika Melalui Pembelajaran Kooperatif Tipe Numbered Heads Together Siswa Kelas 5 Semester II SD Negeri Cebongan 03 Salatiga
Dalam perancangan suatu sistem informasi diperlukan data dan informasi yang akurat agar sistem informasi yang dirancang dapat memenuhi kebutuhan yang sesuai dengan
Nilai tukar ialah kemampuan suatu barang untuk dapat ditukarkan dengan barang lain di pasar. Misalnya : Buku pelajaran ekonomi, tas sekolah, buku tulis, beras, tekstil,
