Doi: 10.21059/buletinpeternak.v42i1.28307
Modeling How the Leader Power Affecting Performances of the
Smallholder Beef Farming
Novie Andri Setianto*, Nunung Noor Hidayat, and Pambudi Yuwono
Faculty of Animal Science, Jenderal Soedirman University, Purwokerto, 53123, Indonesia
Article history
Submitted: 15 September 2017 Accepted: 20 December 2017
* Corresponding author: Telp. +62 81213898400 E-mail: [email protected]
ABSTRACT
This study aimed to explore how the leader power is affecting the performance of beef farmer group. The research was undertaken in two farmers group in Kabupaten Banjarnegara, Central Java Province involving 35 farmers and two beef traders. Systems thinking the approach was chosen about its capability to capture the complexity of the beef farming systems. A combination of semi-structured interviews, in-depth interviews, and workshop have been conducted to finalize this study. The discussion were focused on three aspects; (1) daily activities; (2) resources used and affected by those activities; and (3) pressures that are directly affected the resources and activities. The result was presented in a Causal Loop Diagram (CLD) which generated using Vensim® software. The CLD showed that leader power affects the group performance in two reinforcing loops. Firstly, leader power positively linked to the decision for allocating profit to group reinvestment. Secondly, for allocating proportion for breeding. Farmer’s actual income become the leverage of the power dimension. Income will enforce the power thus makes the loop virtuous, whereas a loss will reduce power and makes the power loop vicious.
Keywords: Beef farming, Causal Loop Diagram, Farmer group, Qualitative modelling, Smallholder
Introduction
Beef farming is still one of the focus of livestock development in Indonesia. The fact that in 2015 the Indonesian government imported live cattle valued at US 549 million (Directorate General for Livestock and Veterinary Services, 2017) indicate that there are a major supply and demand gap of beef. With an average of fewer than four cattle per farmer, smallholders are dominating the farming and remain the main contributors for beef supply in Indonesia (Boediyana, 2007; Ministry of Agriculture of the Republic of Indonesia, 2010). Smallholders refer to farmers who depend on small areas of land for their farming survival, utilizes high labor inputs but low level of capital, and involves intensive use of land (Overton, 2011). For smallholders, cattle farming is not just an income generating activity, but also their livelihood security instruments (Siegmund-Schultze et al., 2007,
Stroebel et al., 2008, Huyen et al., 2010). Thus, developing beef farming will not only improve the national beef supply but also increase farmer’s welfare. One recommended strategy for beef development in Indonesia is strengthening the breeding (Setiantoet al., 2014a, 2014b).
Since 2000, numbers of government program have been implemented to boost the cattle
population which mainly focused on smallholder beef farming. However, like many development programs elsewhere, selective adoption and side-tracking practices commonly occur. Selective adoption refers to the situation in which the target population will only adopt the certain part of the program which subjectively fits and works for them. Additionally, side-tracking emphasizes that the reasons for recipients to adopt the development program are usually different from those motivating program designer (Olivier de Sardan, 2005). A study by Setianto et al. (2014a)
showed that government breeding program which initially designed for increasing the breeding cows were not fully adopted by farmers. Further, Setianto (2016) reported a Causal Loop Diagram which showed how government grant linked with cattle population, farming preference, and income. These studies showed that many farmers shifted from breeding to fattening. However, it did not specifically discuss why the group leader could not prevent this shifting. This study aimed to complement those finding by exploring how the leader power affected the decision process on their groups and showed the importance of leader power to group performance.
Bulletin of Animal Science
ISSN-0126-4400/E-ISSN-2407-876X Acredited: 36a/E/KPT/2016
http://buletinpeternakan.fapet.ugm.ac.id/
Materials and Methods
Participants
As the research heavily focused on a complex system, systems thinking approach was used in this study. Systems thinking is a ‘discipline
for seeing wholes’ (Senge, 1992); it has the ability to examine any causal effect and acknowledge how that causal effect constructs feedback loops which likely occurred in a real world situation (Bosch et al., 2007; Flood, 2010; Cabrera et al.,
2008). One of systems instrument which widely used to describe any systems called Causal Loop Diagram (CLD), a qualitative model to describe systems behavior (Sherwood, 2002).
This research was conducted in two beef farmers group in Banjarnegara regency, Central Java. Both have different group maturity. For the ethical purposes, the name of the groups was presented as group A and group B. Both groups were selected purposively based on the age of the group. Group A is a mature group which was established in 1978; whereas group B is a relatively new group established in 2010. The different levels of group maturity might lead to different group dynamics which should be taken into consideration. A new farmer group can be expected to have less bonding and trust among members than the mature one which likely to have a stronger social bonding to help it to survive from any external pressures. Social bonding, in the form of trust, is critical to support group performance (Maani and Maharaj, 2004; Barham and Chitemi, 2009). Currently, Group A has 22 active members, whereas Group B has 13 members. All members from both groups were involved in this study. Additionally, beef traders and government officers were also interviewed. As the study was based mainly on those two groups, the results and recommendations of this study can be seen as limited to those groups only. However, as the non-sampled groups were also dealing with the similar socio-economic situations, the approach applied in this study can be used as a reference to study those other groups.
Research steps
The first step of the study was undertaken scoping visits in both groups. The aim of the scoping was to initiate communication with the head of the groups and observe the daily activities and available resources in the area. Then, followed by conducting series of semi-structured interview to all members of the groups. The interview was focused on three aspects; (1) daily activities which are directly linked to beef farming; (2) resources used and affected by those activities; and (3) pressures that are directly affected the resources and activities. The result from this step was then analyzed to identify five most-mentioned activities, resources, and pressures. This result was then discussed further in the workshop in both groups, involving all group members. The discussion should focus on identifying the linkages among activities, resources, and pressures. The output of
the workshop was a rich picture that describes elements within the beef farming system and visualized linkages existed among those elements. To fine-tune the finding, in depth interview involving four key persons has been undertaken. Then, the study came to the model development stage. A Causal Loop Diagram (CLD) which described the main elements of the systems, structures, the existing process, and the currently recognized and potential issues (Maani and Cavana, 2007) was developed using Vensim® software. Finally, to verify the CLD another workshop with the same participants were performed. This was achieved by contrasting the CLD with the real world situation. Some adjustments and modifications were made to ensure that the loops and linkages made sense and were able to mimic the real farming situation.
Results and Discussion
Both groups received government aid program. The aim of the current program is increasing the breeding performance. The main goal of breeding is to produce calves (Boykin et al.,
1980), with most female calves retained for use as breeding stock, and increasing the number of breeding females, whereas males are sold to generate income. Thus the expectation of the program was that the farmer’s groups would be strengthened, having more cattle and capital, and thus, become less dependent on government grants in the future. The causal linkages describing the grant and cattle population is visualized in a CLD. There are three features in a CLD; feedback loops, polarity, and feedback process.
The feedback loop is built from variables and their causal links which were shown by an arrow (Schaffernicht, 2006). Another attribute of the CLD is the polarity, which explains the nature of the relationship among those variables (Schaffernicht, 2010). It can move in the same or opposite direction; a positive sign shows a causal link which goes in the same direction, and a negative sign (-) to show a causal link in opposite directions. Furthermore, there are two types of feedback processes: reinforcing and balancing loops. Reinforcing loops are self-reinforcing representing growing or declining actions in the systems, while balancing loops are a self-correcting mechanism which counteracts and oppose change (Sterman, 2000). Two loops were identified, one reinforcing loop (R1) and one balancing loop (B1).
Review from the previous study
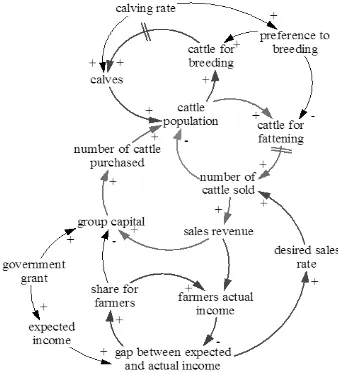
Model of beef farming under government grant has been discussed by Setianto (2016) which explore the linkages between government grant, cattle population, preference for breeding and fattening, and farmers income (Figure 1).
The CLD describes the situation where farmers used the government grant to purchase cows for breeding purposes (shown by a green arrow with positive polarity) resulted in the increased number of cattle owned by farmers
group. As designed by the program, the purchased cows should be allocated for breeding purposes to produce more calves. A delay mark indicated that this process needs a certain gestation time. Newborn calves would further increase the population (as shown by reinforcing loop in blue). Female calves should be raised as breeding cattle, whereas male calves were kept for fattening purpose, sold to the market, thus reduce the cattle population. However, farmers have their own objectives – to increase their income.
Figure 1. Linkages between government grant, cattle population, farming preference and farmers income
(Setianto, 2016).
How the current study complements the previous
As more resources are allocated for fattening, availability of resources left for breeding will decrease because fattening and breeding compete for resources. As a result, cattle for breeding decrease and become a vicious cycle of declining breeding activities. In the real world, all systems are regarded as purposeful (Ulrich and Reynolds, 2010). All loops in the motivation dimension mentioned above are flowing purposefully to achieve two goals; to increase cattle population and to generate income. Currently it seems that farmers have more concerns about income than with increasing the population. The current study discusses the source of control within a smallholder beef farming system which drives the above-mentioned motivation in pursuing those two goals.
Discussion with group members revealed that in term of power control, coerciveness does exist, leader dominated the decision process. However, leaders were respected for two reasons: (1) leaders were considered to have made a significant contribution in obtaining the government grant, and (2) they were able to manage the group resources and provide cash returns to all group members regularly. In contrast, discussion with both group leaders revealed that they were not entirely keen to be appointed as group leaders
because of all the responsibilities incurred. Externally, as a program recipient, the leader has to deal with all monitoring processes, and internally, he is expected to be able to manage the group resources to generate income. However, the group leader does not receive any additional income for his extra efforts. His share of profit is the same as others in the group. Although this sharing is not financially beneficial
to the leaders, it does increase members’ trust
and respect for their leader.
All group decisions are made at the group meeting which is regularly conducted each month. Leaders observed that they often need to take a coercive measure in the group meeting to ensure that a decision is not only beneficial for all members but also supports group sustainability. For example, when members need to sell cattle, the leader needs to organize the purchase of the replacements as soon as possible. Before purchasing the replacement cattle, the money allocated for that purpose needs to be transferred to the group account. Thus the role of the leader is to decide wisely between competing individual members’ and group interests so that it remains in harmony. This pragmatic type of leadership is often necessary to minimize group conflict (Kotlyar et al., 2011).
However, sometimes the leader needs to make an exception, particularly when farmers have suffered from some significant loss. Interviews with leaders in both groups revealed that in the case when a farmer has suffered from loss, the leader will tend to allocate some extra cash. They argued that regardless of the result, farmers have already worked, and therefore, should get something as a reward, even if this means reducing the share retained by the group, which could lead to a decrease in group capital.
The leader has a significant role in ensuring the balance between group and
individual members’ interests. This role can
only be achieved if the leader is trusted and respected by group members (Burke et al.,
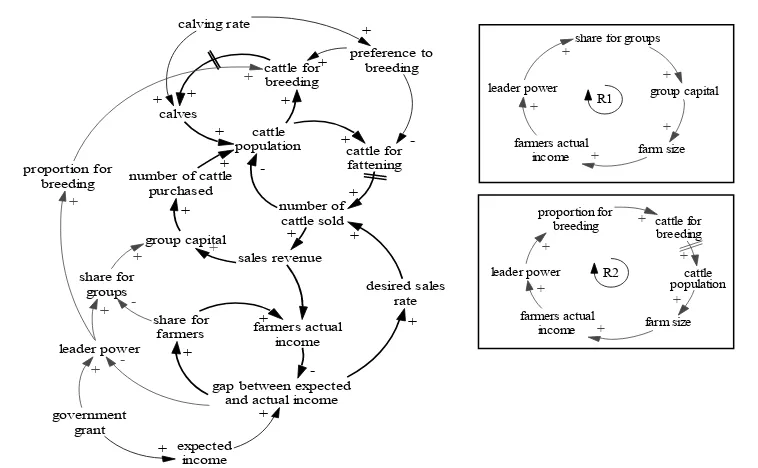
2007). Trust and group performance are closely linked in a dynamic process where positive group performance will buffer the trust, but negative performance will diminish trust (Peterson and Behfar, 2003). This situation is visualized in a causal loop diagram (Figure 2).
The blue arrow visualizes the complimentary finding of the current study to the previous study. The simplified visualization of the CLD showed on the right side of Figure 2 highlighted two additional loops, R1 and R2. R1 loop is a reinforcing loop which explains how the leader is credited for the success of the group in receiving the government grant. Therefore government grant increases leader to power. With this power, the leader can ensure the allocation of cash for the group, thus increasing the group capital. Subsequently, this increases the farmer's
Figure 2. Linkages of power control to group capital and breeding preference.
actual income, closes the gap between expected and actual income, and increases the member trust which will further strengthen leader power. R2 loop is also a reinforcing loop. It describes how increased leader power will able to force the group to allocate more proportion for breeding which would increase the cattle population and generate more income. However, the R2 showed a delay mark which in the real farming situation has a significant importance. More delay means less income in a year.
Conclusion
Within this power loop, the important part is
how to maintain the members’ trust so that they
obey the leader decision to allocate some of the revenue back to the group. Trust will be buffered as long as the group performs well and generates income for its members. However, if farmers fail to receive income, a loss of trust will occur, and the reinforcing loops become a pair of a vicious cycle. In the situation of smallholder groups, leader power needs to be maintained to ensure the sufficient resource allocation for breeding purpose.
References
Barham, J. and C. Chitemi. 2009. Collective action initiatives to improve marketing performance: Lessons from farmer groups in Tanzania. Food Policy, 34,53-59. Boediyana, T. 2007. Kesiapan dan Peran Asosiasi
Industri Ternak Menuju Swasembada Daging Sapi 2010 (Roles of Livestock Industries Association to Support National Beef Self Sufficiency Program 2010). Seminar Nasional Hari Pangan Sedunia 2007 (World Food Day National Seminar 2007). Bogor - Indonesia.
Bosch, O. J. H., C. A. King, J. L. Herbohn, I. W. Russell and C. S. Smith. 2007. Getting the big picture in natural resource management—systems thinking as
‘method’ for scientists, policy makers, and
other stakeholders. Systems Research and Behavioral Science, 24, 217-232.
Boykin, C. C., H. C. Gilliam, R. A. Gustafson, and S. United. 1980. Structural characteristics of beef cattle raising in the United States, [Washington], Dept. of Agriculture, Economics, Statistics, and Cooperatives Service: for sale by the Supt. of Docs., U.S. Govt. Print. Off.
Burke, C. S., D. E. Sims, E. H. Lazzara, and E. Salas. 2007. Trust in leadership: A multi-level review and integration. The Leadership Quarterly, 18, 606-632.
Cabrera, D., L. Colosi and C. Lobdell. 2008. Systems thinking. Evaluation and Program Planning, 31,299-310.
Directorate General for Livestock and Veterinary Services. 2017. Livestock and Animal Health Statistics 2016, Jakarta, Direktorat Jenderal Peternakan dan Kesehatan, Kementerian Pertanian Republik Indonesia.
Flood, R. L. 2010. The Relationship of ‘Systems Thinking’ to Action Research. Systemic
Practice and Action Research, 23,269-284. Huyen, L. T. T., P. Herold and A. Valle Zárate. 2010. Farm types for beef production and their economic success in a mountainous province of northern Vietnam. Agricultural Systems, 103,137-145.
Kotlyar, I., L. Karakowsky and P. Ng. 2011. Leader behaviors, conflict and member commitment to team-generated decisions. The Leadership Quarterly, 22,666-679. Maani, K. E. and V. Maharaj. 2004. Links between
systems thinking and complex decision
making. System Dynamics Review, 20, 21-48.
Maani, K. and R. Cavana. 2007. System thinking, system dynamics; managing change and complexity, Rosedale New Zealand, Pearson education.
Ministry of Agriculture of the Republic of Indonesia. 2010. Blue print program swasembada daging sapi 2014 (blueprint of national beef self-sufficiency program 2014), Jakarta, Ministry of Agriculture of the Republic of Indonesia.
Olivier de Sardan, J. P. 2005. Anthropology and Development,Understanding
Contemporary Social Change, London and New York, ZED Books.
Overton, J. 2011. Smallholders [Online]. SAGE
Publications.http://sage-ereference.com/view/environment/n990.xm l Accessed 15 November 2011.
Peterson, R. S. and K. J. Behfar. 2003. The dynamic relationship between performance feedback, trust, and conflict in groups: A longitudinal study. Organizational Behavior and Human Decision Processes, 92, 102-112.
Schaffernicht, M. 2006. Detecting and monitoring change in models. System Dynamics Review, 22,73-88.
Schaffernicht, M. 2010. Causal loop diagrams between structure and behaviour: A critical analysis of the relationship between polarity, behaviour and events. Systems Research and Behavioral Science 27: 653-666.
Senge, P. M. 1992. The fifth Discipline; the Art and Practice of the Learning Organization. Milsons point, New South Wales Australia, Random House Australia.
Setianto, N. A., D. Cameron, and J. B. Gaughan. 2014a. Identifying archetypes of an enhanced system dynamics Causal Loop Diagram in Pursuit of strategies to improve smallholder beef farming in Java, Indonesia. Systems Research and Behavioral Science 31: 642-654.
Setianto, N. A., D. Cameron, and J. B. Gaughan. 2014b. Structuring the problematic situation of smallholder beef farming in Central Java, Indonesia: using systems thinking as an entry point to taming complexity. Int. J. Agricult. Management 3: 164-174.
Setianto, N. A. 2016. Kajian kualitatif dampak bantuan pemerintah pada peternakan sapi potong menggunakan pendekatan model. Agripet 16: 114-120.
Sherwood, D. 2002. Seeing the Forest for the Trees; A Manager's Guide to Applying Systems Thinking, London, Nicholas Brealey Publishing.
Siegmund-Schultze, M., B. Rischkowsky, J. B. Da Veiga, and J. M. King. 2007. Cattle are cash generating assets for mixed smallholder farms in the Eastern Amazon. Agricultural Systems, 94: 738-749.
Sterman, J. D. 2000. Business Dynamics: System Thinking and Modelling for A Complex World, New York, Irwin McGraw-Hill. Stroebel, A., F. J. C. Swanepoel, N. D. Nthakheni,
A. E. Nesamvuni, and G. Taylor. 2008. Benefits obtained from cattle by smallholder farmers: a case study of Limpopo Province, South Africa. Australian J. Experimental Agric. 48: 825-828.
Ulrich, W. and M. Reynolds. 2010. Critical systems Heuristics. In: Systems Approaches to Managing Change. Reynolds, M. and S. Holwell (Eds.). A Practical Guide, Springer London.