Yudi Wicaksono et al.
* Corresponding author. Tel : +62-331-324736
Email address : [email protected] DOI: 10.22146/ijc.25089
Thermodynamic and Thermomicroscopy Study of Atorvastatin Calcium-Succinic Acid
Binary Mixtures
Yudi Wicaksono
1,2,*, Budipratiwi Wisudyaningsih
1,
Frida Oktaningtias Widiarthi
2, and Tri Agus Siswoyo
2,31Faculty of Pharmacy, University of Jember, Jl. Kalimantan I/2, Jember 68121, Indonesia
2Center for Development of Advanced Science and Technology, University of Jember,
Jl. Kalimantan No. 37, Jember 68121, Indonesia
3Faculty of Agriculture, University of Jember, Jl. Kalimantan No. 37, Jember 68121, Indonesia
Received May 19, 2017; Accepted August 14, 2017
ABSTRACT
Binary mixtures of pharmaceuticals significantly affect the physical-chemical properties of each component. Understanding the behavior of pharmaceutical ingredients in binary mixtures will assist in formulating the pharmaceutical ingredients into good dosage forms. The aim of this work was to explore the thermal behavior and solid state transformation of binary mixture of atorvastatin calcium and succinic acid. The thermodynamics of binary mixtures were determined by differential scanning calorimeter. Meanwhile, thermomicroscopy and microstructure were determined by a polarized microscope. The results showed that melting points of atorvastatin calcium and succinic acid respectively were 159.35 and 188.51 °C. The solid-liquid phase diagram of atorvastatin calcium - succinic acid indicates the existence of two eutectic points at 136.57 and 120.96 °C respec tively on the mole fraction of atorvastatin calcium 0.3 and 0.5. The Tamman diagram accurately shows mole fraction of atorvastatin calcium at eutectic point 0.33 and 0.46 respectively for eutectic points 130.0 and 134.0 °C. Determi nation of Jackson’s roughness parameter showed the interfaces of all remelting crystals were smooth. The results can be used to modify the properties of atorvastatin calcium as well as the development of the formula into good pharmaceutical preparations.
Keywords: thermodynamic; atorvastatin calcium; binary mixtures; phase diagram
ABSTRAK
Campuran biner bahan obat sangat mempengaruhi sifat fisika-kimia masing-masing komponen. Memahami perilaku bahan farmasi dalam campuran biner akan membantu dalam memformulasi bahan farmasi tersebut menjadi sediaan obat yang baik. Tujuan dari penelitian ini adalah mengetahui sifat panas dan transformasi padatan campuran biner kalsium atorvastatin dan asam suksinat. Termodinamika campuran biner kalsium atorvastatin-asam suksinat ditentukan dengan differential scanning calorimeter. Sedangkan termomikroskopi dan mikrostruktur ditentukan dengan mikroskop terpolarisasi. Hasil penelitian menunjukkan kalsium atorvastatin dan asam suksinat mempunyai titik lebur masing-masing 159,35 dan 188,51 °C. Diagram fase padat -cair dari kalsium atorvastatin-asam suksinat menunjukkan adanya dua titik eutektik pada suhu 136,57 dan 120,96 °C yaitu masing-masing untuk fraksi molar kalsium atorvastatin 0,3 dan 0,5. Diagram Tamman secara lebih akurat menunjukkan molar fraksi dari kalsium atorvastatin pada titik eutektik yaitu 0,33 dan 0,46 masing-masing untuk titik eutektik 130,0 dan 134,0 °C. Penentuan parameter Jackson’s roughness menunjukkan antarmuka semua kristal adalah halus. Hasil penelitian dapat digunakan untuk memodifikasi sifat-sifat atorvastatin kalsium maupun pengembangan formulasi atorvastatin menjadi sediaan farmasi seperti yang baik.
Kata Kunci: termodinamika; kalsium atorvastatin; campuran biner; diagram fase
INTRODUCTION
Pharmaceutical properties of mixture of substances are generally influenced by molecular interactions between components. Most studies have shown that interaction model among components of pharmaceutical
Yudi Wicaksono et al.
diagram we can know the thermodynamic properties of the mixture relating to the interaction model that occurs between the components in the mixture. And this is an important data for the process of modification or formulation of a pharmaceutical ingredient. Recently, the various phase changes of binary mixtures of materials can rapidly be characterized by differential scanning calorimetry method [2].
The interactions between the molecules affect microstructure of their mixtures and are related to the value of enthalpy and entropy of fusion of pure substances and eutectic mixtures. Thus, value of entropy of fusion can be used to estimate the solid-liquid interface morphology of substance. The entropy of fusion is calculated base on Eq. 1 [3]: change and T is the melting temperature. The characters of growth morphology from melt of binary mixture depend on the nature of solid-liquid interface and can be predicted from value of entropy of fusion. The predicted structure is related to roughness factor known as
Jackson’s roughness parameter (α) and is closely depending upon the geometry of the molecules; it usually has a value ≤ 1. ∆S is entropy of fusion, and R is gas constant. Smooth interface appears when α >2 for both phases while the interface is rough and many sites
if α < 2.
Thermomicroscopy is a synergy of microscopy and thermal analysis to analyze the physical properties of materials as a responsibility of temperature and time. It allows characterization of little amount of substances to acquire solid-state properties of substances. In the field of pharmaceuticals, thermomicroscopy has been used to obtain visual and semi-quantitative data with respect to transition of pharmaceutical polymorphs. Therefore, thermomicroscopy is commonly used to support thermal analysis method of DSC [4].
Atorvastatin is a drug that is classified as statin group, used to reduce blood cholesterol levels [5]. There are 42 crystalline structures of atorvastatin [6]. However, chance to create atorvastatin into another polymorphic or different crystal structure is still fully open [7]. For this reason, verification of crystal phase and thermodynamic changes of atorvastatin in binary mixtures is important to do. Succinic acid (SA) is a dicarboxylic acid. In this research, it was used to form a binary mixture with atorvastatin because it is often used as ingredient in modification of pharmaceuticals [8]. The aim of this work
was to explore the thermal behavior and solid state transformation of binary mixture of atorvastatin calcium (AC) and succinic acid (SA). The results of the study are useful for the modification process in order to improve the properties of atorvastatin calcium and also for the formulation of atorvastatin calcium into ready-to-use pharmaceutical preparations such as tablets, capsules and others.
EXPERIMENTAL SECTION
Materials
Atorvastatin calcium (AC) was obtained from PT Dexa Medica (Palembang, Indonesia) and succinic acid (SA) was supplied by Sigma-Aldrich.
Instrumentation
The instruments used were differential scanning calorimeter (Rigaku Thermo Plus EVO II), polarized microscope (Olympus BX41), camera (Olympus DP21), heating stage (Scilogex MS7-H550-Pro), and analytical balance (Precisa ES 225SM-DR).
Procedure
Physical mixtures of AC and SA
AC and SA were sifted to obtain particle size in similar range and each was weighed according to desired mole fraction. These materials were mixed carefully using a mortar to form a homogeneous mixture [9].
DSC measurements
Physical mixtures of AC-SA at different composition were transferred into aluminium crucibles (with lid rested on the sample) and then weighed approximately 5 mg using a balance with precision of
10 μg. The differential scanning calorimetry (DSC)
measurements were determined at temperature range 30-200 °C with heating rate 10 degrees per minute. The dry nitrogen was used as atmosphere of experiments.
Microstructure
Each sample of AC and SA was placed on an object glass then heated to melt. The melt was covered with cover-slip and placed at room temperature in order to crystallize again. The crystal was observed by a polarized microscope equipped with a camera [3].
Thermomicroscopy
Yudi Wicaksono et al.
Table 1. Melting point and enthalpy of binary mixtures of AC-SA at different composition
Mole fraction of AC (X1) 1
st DSC peak 2nd DSC peak
T (°C) ΔH (J/g) T (°C) ΔH (J/g)
0.0 - - 188.51 320.77
0.1 128.24 1.06 167.54 38.12
0.2 123.48 12.67 156.91 0.12
0.3 136.57 46.44 136.57 -
0.4 122.24 58.58 153.10 0.22
0.5 120.96 47.78 120.96 -
0.6 123.05 42.74 151.37 0.16
0.7 132.42 15.52 149.48 5.61
0.8 152.94 13.85 160.79 7.00
0.9 153.45 17.66 160.92 15.21
1.0 - - 159.35 101.90
composition was placed on an object glass and then heated at 30-180 °C. Phase transitions and eutectic point of sample were observed, and images were taken
[4].
RESULT AND DISCUSSION
Solid-Liquid Phase Diagram
Phase diagram of binary mixtures of AC-SA was constructed from DSC curves of each pure substance and its binary mixtures. DSC curves of AC, SA and binary mixtures at different composition are shown in Fig. 1. DSC curves of each pure substance are showing only one endothermic peak, corresponding to its melting point. Binary mixtures of AC-SA have two endothermic peaks; the first peak appearing at lower temperature is attributed to melting point of eutectic composition and second one, at higher temperature, correlated with melting point of major component [3].
DSC curve of AC exhibited a sharp endothermic peak at 159.35 °C due to melting point of AC. The melting point of AC has enthalpy 101.90J/g confirming that crystal the substance of AC consists solely of form I [10]. The melting point of SA is 188.51 °C accordin g to the literatures [11-12]. The melting point of AC decreased with additional mole fraction of SA and attained minimum melting point at 120.96 °C when the mixture had 0.5 mole fraction of SA. The melting point and enthalpy of binary mixtures obtained from DSC curves are presented in Table 1.
DSC curves of binary mixtures of AC-SA were used to create the solid-liquid phase diagram by plotting temperature versus mole fraction (Fig. 2). Phase diagram shows two eutectic points at temperature of 136.57 and 120.96 °C respectively on the mole fraction of AC 0.3 and 0.5.
This phase diagram is characterized as a congruent melting point that shows the binary mixture of AC-SA capable to form a cocrystal [13]. Phase diagram of cocrystal was a typical W-shaped phase diagram
exhibit two eutectic points and a cocrystal region between the two eutectic points [14]. Melting point and enthalpy of AC, SA and eutectic mixture of AC-SA are given in Table 2.
Fig 1. DSC curves of AC, SA and binary mixtures of AC-SA at different composition
Yudi Wicaksono et al.
Table 2. Melting point and enthalpy of AC, SA and eutectic mixture of AC-SA
Compound Tfus (°C) ΔfusH (Jg
-1)
Experiment Literature Experiment Literature
AC 159.35 158.80 [9] 101.90 86.85 [9]
SA 188.51 187.60 [10]
191.30 [11]
320.77 168.0 [11]
Eutectic 1 136.57 - 46.44 -
Eutectic 2 120.96 - 47.78 -
Table 3. The entropy of fusion and α value of AC, SA and binary mixtures of AC - SA
Compound ΔfusH (Jg-1) ΔfusH (kJ mol-1) Tfus (K) ΔfusS (J mol-1 K-1) α
AC 101.90 123.24 432.50 284.95 35.03
SA 320.77 37.88 461.66 82.05 10.09
Eutectic 1 50.00 23.92 409.72 58.38 7.02
Eutectic 2 50.50 31.32 394.11 79.47 9.56
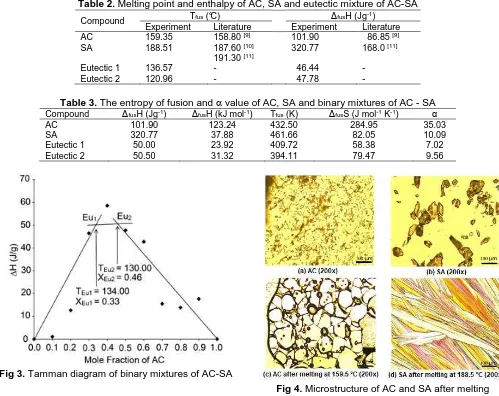
Fig 3. Tamman diagram of binary mixtures of AC-SA
Fig 4. Microstructure of AC and SA after melting
Determination of eutectic composition can be significantly improved using Tamman diagram by plotting mole fraction of AC versus enthalpy ∆H (J/g) of eutectic point of binary mixtures [15]. The results of plotting of Tamman diagram (Fig. 3) accurately show mole fraction of AC at eutectic point 0.33 and 0.46 respectively for eutectic temperature 130.0 and 134.0 °C. These results indicate that the mixture of AC and SA in the molar fractions ratio of AC 0.33 and 0.46 gives the eutectic mixture with different physical properties with the origin components indicated by the decrease of the melting point of the mixture to 130.0 and 134.0 °C.
Microstructure
The values of entropy of fusion and of AC, SA and binary mixtures of AC - SA are presented in Table 3. Calculation of Jackson’s roughness parameter shows
that AC, SA and eutectic mixtures have α value more
than 2 which indicates that the interfaces of crystals are
smooth. The microstructures of remelting crystal of AC and SA are shown in Fig. 4. Microstructure of remelting crystal of AC is irregular while SA crosses plates. Remelting crystal of AC has different types of shape which represents polymorphism. These results are in agreement with report that AC exhibits several polymorphic forms [16
].
Thermomicroscopy
Yudi Wicaksono et al.
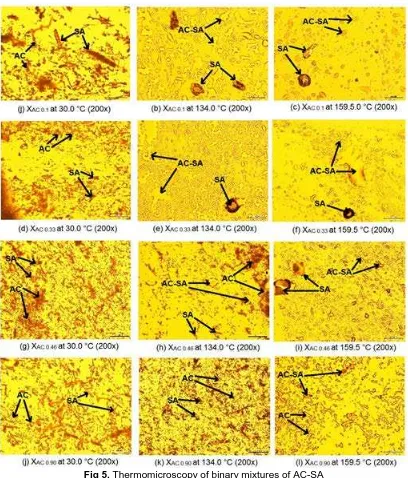
Fig 5. Thermomicroscopy of binary mixtures of AC-SA
mole fractions of AC 0.1, 0.33, 0.46, and 0.9 respectively at temperatures of 128.24, 136.57, 122.24, and 153.45 °C. At temperature of 159.5 °C, the eutectic mixtures in all samples are melting and mix with excess components in the mixture [17].
CONCLUSION
Thermal behaviors of binary mixtures of AC-SA were investigated by DSC and thermomicroscopy technique. The phase diagram of AC-SA indicates the existence of two eutectic points at 134.00 and 130.00 °C respectively on the mole fraction of AC 0.33 and 0.46.
The values of Jackson’s roughness parameter of AC, SA and eutectic mixtures were found greater than 2 which indicated smooth interfaces of remelting crystals. Thermomicroscopy of binary mixtures of AC-SA were consistent with the phase diagram
ACKNOWLEDGEMENT
Yudi Wicaksono et al. REFERENCES
[1] Klimová, K., and Leitner J., 2012, DSC study and phase diagrams calculation of binary systems of paracetamol, Thermochim. Acta, 550, 59–64.
[2] Trache, D., Khimeche, K., Benelmir, R., and Dahmani, A., 2013, DSC measurement and prediction of phase diagrams for binary mixtures of energetic materials’ stabilizers, Thermochim. Acta, 565, 8–16.
[3] Meltzer, V., and Pincu, E., 2012, Thermodynamic study of binary mixture of citric acid and tartaric acid, Cent. Eur. J. Chem., 10 (5), 1584–1589. [4] Vitez, I.M., and Newman, A.W., 2007, Thermal
Analysis of Pharmaceuticals, CRC Press, Boca Raton, 222–260.
[5] Rao, S.K., Prasad, T., Mohanta, G.P., and Manna, P.K., 2011, An overview of statins as hypolipidemic drugs, Int. J. Pharm. Sci. Drug Res., 3 (3),178–183. [6] Shayanfar, A., Ghavimi, H., Hamishehkar, H., and
Jouyban, A., 2013, Coamorphous atorvastatin calcium to improve its physicochemical and pharmacokinetic properties, J. Pharm. Pharm. Sci., 16 (4), 577–587.
[7] Chadha, R., Kuhad, A., Arora, P., and Kishor, S., 2012, Characterisation and evaluation of pharmaceutical solvates of atorvastatin calcium by thermoanalytical and spectroscopic studies, Chem.
Cent. J., 6 (1), 114–129.
[8] Shevchenko, A., Bimbo, L.M., Miroshnyk, I., Haarala, J., Jelínková, K., Syrjänen, K., van Veen, B., Kiesvaara, J., Santos, H.A., and Yliruusi, J., 2012, A new cocrystal and salts of itraconazole: Comparison of solid-state properties, stability and dissolution behavior, Int. J. Pharm., 436 (1-2), 403– 409.
[9] Setyawan, D., Sari, R., Yusuf, H., and Primaharinastiti, R., 2014, Preparation and
characterization of artesunate-nicotinamide cocrystal by solvent evaporation and slurry method, Asian J. Pharm. Clin. Res., 7 (Suppl. 1), 62–65.
[10] Zhang, H.X., Wang, J.X., Zhang, Z.B., Le, Y., Shen, Z.G., and Chen, Z.F., 2009, Micronization of atorvastatin calcium by antisolvent precipitation process, Int. J. Pharm., 374 (1-2), 106–113.
[11] Patel, J.R., Carlton, R.A., Needham, T.E., Chichester, C.O., and Vogt, F.G., 2012, Preparation, structural analysis, and properties of tenoxicam cocrystals, Int. J. Pharm., 436 (1-2), 685–706.
[12] Ober, C.A., and Gupta, R.B., 2012, Formation of itraconazole-succinic acid cocrystals by gas antisolvent cocrystallization, AAPS PharmSciTech, 13 (4), 1396–1406.
[13] Yamashita, H., Hirakura, Y., Yuda, M., Teramura, T., and Terada, K., 2012, Detection of cocrystal formation based on binary phase diagrams using thermal analysis, Pharm. Res., 30 (1), 70–80. [14] Stoler, E., and Warner, J.C., 2015, Non-covalent
derivatives: Cocrystals and eutectics, Molecules, 20 (8), 14833–14848.
[15] Górniak, A., Wojakowska, A., Karolewicz, B., and Pluta, J., 2011, Phase diagram and dissolution studies of the fenofibrate–acetylsalicylic acid system, J. Therm. Anal. Calorim., 104 (3), 1195– 1200.
[16] Rao, V.P.R., Somannavar, Y.S., Kumar, N.S., Reddy, S.B., Islam, A., and Babu, B.H., 2011, Preparation of stable new polymorphic form of atorvastatin calcium, Pharm. Lett., 3 (5), 48–53. [17] Chadha, R., Arora, P., Bhandari, S., and Bala, M.,
2012, Current Microscopy Contributions to Advances in Science and Technology, Formatex