NDWI-BASED TECHNIQUE FOR DETECTION OF CHANGE DATES OF THE
GROWING SEASONS IN RUSSIAN SUBARCTIC
E. Panidi 1, *, V. Tsepelev 2
1 Department of Cartography and Geoinformatics, Saint Petersburg State University, St. Petersburg, Russia – [email protected], [email protected]
2 Meteorological Department, Russian State Hydrometeorological University, St. Petersburg, Russia – [email protected]
KEY WORDS: Climate Change, Dynamics of Vegetation, Growing Seasons, Vegetation Indexes, NDWI
ABSTRACT:
The paper describes a technique for automated analysis of the annual graphs of Normalized Difference Water Index, which enables to allocate framing dates of the spring, summer and autumn growing seasons. The approach proposed and used for detection of growing season dates allows to detect beginning and ending dates for summer season (when the surface air temperature is above +10 °C), in addition to the detection of beginning date for spring season and ending date for autumn season (when the temperature is above +5 °C), as it described by some authors. We describe general idea of the analysis of NDWI annual graphs and some collisions in the graph data, which are possible when the graph is derived from the satellite imagery time series.
* Corresponding author
1. INTRODUCTION
Previously we conducted a number of studies devoted to the investigation of regional-scale climate change in Northern Russia, namely in the taiga and tundra zones of the European part of Russia (Bobkov et al., 2015; Tsepelev et al., 2015; Panidi et al. 2016). We postulated the sparseness of the ground meteorological observation network in northern regions as a main study issue, which makes it impossible to monitor and evaluate regional features and differences in the climate change (i.e., differences at the regional scale) on the basis of reanalysis data (Kalnay et al., 1996), as it conducted usually. In previous studies, we identified statistically significant relationship between the trends of the surface air temperature and of the shrub vegetation productivity. In addition, in the context of study goal we proposed a principle of the vegetation productivity estimation in frames of the growing seasons, which are the periods when the surface air temperature exceeds +5 °C and +10°C and phytomass growth is affected by different weather conditions in the subarctic regions. Consequently, we need to allocate the framing dates of the spring (surface air temperature between +5 °C and +10°C), summer (surface air temperature above +10 °C) and autumn (surface air temperature between +10 °C and +5 °C) growing seasons to estimate climate trends and climate change. However, the allocation of the growing season dates is complicated also with the sparseness of the ground observation network. Due to this, we proposed to use the Normalized Difference Water Index (NDWI) derived from satellite imagery time series as a marker of growing season change dates. This vegetation index is sensitive to the seasonal change of liquid water presence in the plant tissue. NDWI is derived from near-infrared (0.86 μm) and short wave infrared (1.24 μm)
We used MODIS 8-day averaged surface reflectance product (Vermote, 2015) to produce NDWI gridded maps for years water in plant tissue, it takes minimum value at the beginning of spring season, then rises during the spring and has a plateau during the summer, and finally degrades during the autumn and takes a minimum at the ending of autumn season.
Figure 1 shows annual NDWI graphs for the weather stations located in different parts of studied region and average framing dates of the growing seasons computed accordingly to the data of ground monitoring at the weather stations. The graphs reflect correspondence between the ground and satellite observations.
Some authors describe a possibility of allocation of the framing dates for full growing season through the allocation of the two corresponding minimums on the graphs (Delbart et al., 2005; Sekhon et al., 2010; Semenova, 2015). However, their publications are not cover the issue of separation of the full growing season into spring, summer and autumn.
We have developed our own algorithm for allocation of the beginning and ending dates of the three mentioned growing seasons using the graphs. Spring and autumn minimums are allocated as absolute minimums in corresponding parts of year,
The International Archives of the Photogrammetry, Remote Sensing and Spatial Information Sciences, Volume XLII-3/W2, 2017 37th International Symposium on Remote Sensing of Environment, 8–12 May 2017, Tshwane, South Africa
This contribution has been peer-reviewed.
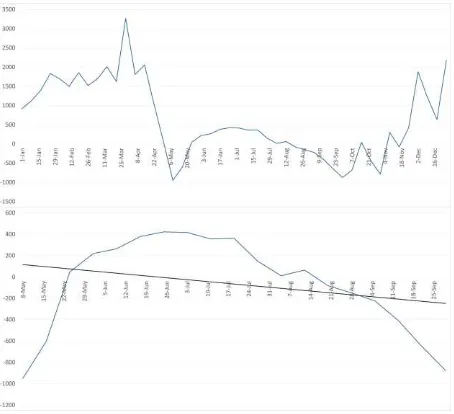
and the summer plateau is allocated using linear trend for the part of annual graph that corresponds with the full growing season (Fig. 2). Above-trend part is recognized as summer season, and below-trend parts with high gradients are the spring and autumn respectively.
Figure 1. Annual graphs of NDWI produced form MODIS imagery for the years 2000-2015 for the Irael (a), Nar’yan-Mar
(b), Petrun’ (c) and Syktyvkar (d) weather stations (data are averaged in the 10 by 10 kilometers area around the stations);
index values are scaled by 10000 coefficient; black vertical lines show average dates of the growing season frames
accordingly to the data of ground observations at the corresponding weather stations
Figure 2. Sample of the annual NDWI graph (upper image) and the part of the graph that is used to allocate framing dates of
the growing seasons; index values are scaled by 10000 coefficient
Annual graphs of NDWI were not visualised during the analysis. All computations concerned with the allocation of needed points on the graphs were produced in ArcGIS by the Python script in pixel-by-pixel mode for every annual dataset of NDWI maps.
It have to be underlined that initial MODIS imagery being averaged by every 8 days allow to allocate needed framing dates for the growing seasons with absolute accuracy of 4 days. Generally, it is possible to interpolate data between 8-day nodes using some smooth function and to allocate dates with 1-day discretization. However, such an approach needs additional accuracy estimation. We not conducted a study of this possibility and corresponding additional accuracy control. 8-day discretization of the graphs leads to collisions in some cases that complicate allocation of spring and autumn absolute minimums. For example, two local minimums can be presented on the graph in the spring or in the autumn (similarly to the situation on the Figure 2). If two local minimums are presented in the autumn, and if both of them are smaller than the spring minimum, simple allocation of two smallest values on the graph will produce incorrect result.
To filter such double minimums we provided a double control in the analysis algorithm. To allocate all minimums on the graph (in node i, for example), the algorithm searches all nodes where neighboring nodes (nodes i-1 and i+1 for node i) have bigger values. Then to prove every allocated minimum, nodes
i-2 and i+2 are estimated to be having bigger values than the node i. This technique allows to filter abovementioned double minimums as well as to filter local minimums.
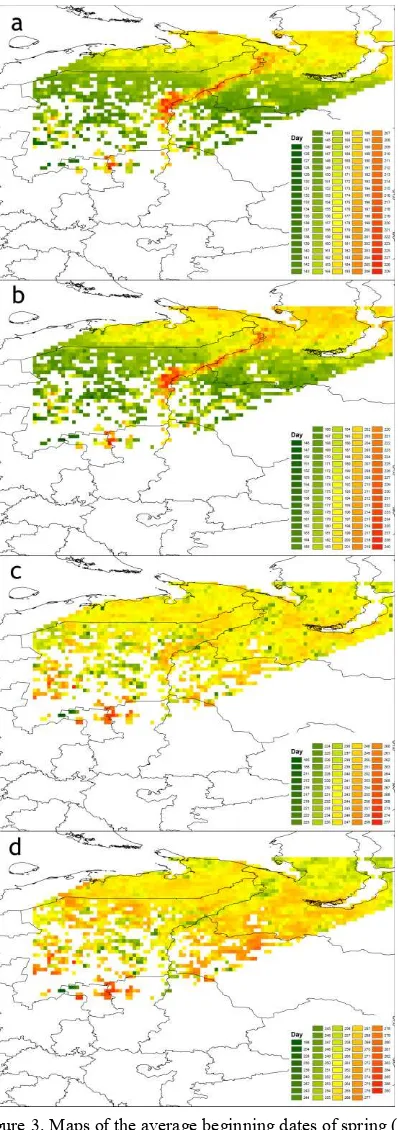
To visualize and estimate obtained results we produced maps of spatial distribution of four framing dates for our test area located in Komi Republic in the Northern part of European Russia. As every annual NDWI dataset allows to obtain maps of the framing dates, we produced four maps for each year and then averaged maps for whole study period (Fig. 3).
Obtained maps show clearly spatial differentiation of the beginning and ending of growing seasons. For example, regular latitudinal differentiation can be allocated on the maps as well
The International Archives of the Photogrammetry, Remote Sensing and Spatial Information Sciences, Volume XLII-3/W2, 2017 37th International Symposium on Remote Sensing of Environment, 8–12 May 2017, Tshwane, South Africa
This contribution has been peer-reviewed.
as some irregularities. One of such irregularities on the maps is a consequence of the mountain region presence on the mapped area. Ural mountains are marked by diagonal red belts on the Figures 3a and 3b and by narrow green belt on the Figure 3d, which show late beginning of spring and summer growing seasons and early ending of the autumn growing season.
Figure 3. Maps of the average beginning dates of spring (a), summer (b) and autumn (c) growing seasons and of the ending dates of autumn growing season (d); legends are not aligned to
highlight spatial differences
Similar maps of framing dates can be produced for every year. Time series of these maps can be used to estimate spatial distribution of average, minimum and maximum values of framing dates, as well as to highlight regular and irregular spatial differentiation in framing dates, to highlight anomalies, and to compute spatial trends. All these computations can be conducted in any GIS software able to produce raster computations.
Unfortunately, as the NDWI was estimated only for shrub-covered areas (needed for climate estimation), the maps of framing dates have corresponding gaps. One of future studies have to explore how to avoid these gaps.
4. CONCLUSIONS
Having time series of satellite imagery applicable for NDWI computation, we can provide analysis of NDWI annual graphs and produce the maps of spatial distribution of the growing season framing dates and season durations calculated on pixel-by-pixel basis. In our study we produced such maps for the test area located in the Komi Republic.
Maps of the medium framing dates show irregularities in the spatial distribution of beginning and ending dates of the growing seasons in the region. Maps of season durations can be produced by subtraction of the maps of framing dates pixel by pixel.
Availability of the NDWI data for a number of years allows us to produce maps of spatiotemporal dynamics of the growing seasons.
It should be noted that further investigations needed to estimate accuracy of the seasons allocation and mapping (also, in different regions).
The weakness of the mapping technique consists in that the territory covered with the shrub vegetation only is used to produce NDWI maps. The issue of filling of the gaps in coverage remains unstudied currently.
ACKNOWLEDGEMENTS
The MOD09A1 V006 dataset was retrieved from the online LP DAAC2Disk download manager, courtesy of the NASA EOSDIS Land Processes Distributed Active Archive Center (LP DAAC), USGS/Earth Resources Observation and Science (EROS) Center, Sioux Falls, South Dakota, https://lpdaac.usgs.gov/data_access/daac2disk.
REFERENCES
Bobkov A., Panidi E., Torlopova N., Tsepelev V., 2015. NDVI dynamics of the taiga zone in connection with modern climate changes, The International Archives of the Photogrammetry, Remote Sensing and Spatial Information Sciences, Vol. XL-7/W3, pp. 157-163. doi:10.5194/isprsarchives-XL-7-W3-157-2015
Delbart N.J-P., Kergoats L., Le Toan T., Lhermitte J., Picard G., 2005. Determination of Phenological Dates in Boreal Regions Using Normalized Difference Water Index. Remote Sensing of Environment, Vol. 97(1), pp. 26-38. doi:10.1016/j.rse.2005.03.011
The International Archives of the Photogrammetry, Remote Sensing and Spatial Information Sciences, Volume XLII-3/W2, 2017 37th International Symposium on Remote Sensing of Environment, 8–12 May 2017, Tshwane, South Africa
This contribution has been peer-reviewed.
Gao B.C., 1996. NDWI A Normalized Difference Water Index for Remote Sensing of Vegetation Liquid Water From Space.
Remote Sensing of Environment, Vol. 58(3), pp. 257-266.
Kalnay E., Kanamitsu M., Kistler R., Collins W., Deaven D., Gandin L., Iredell M., Saha S., White G., Woollen J., Zhu Y., Leetmaa A., Reynolds R., Chelliah M., Ebisuzaki W., Higgins W., Janowiak J., Mo K.C., Ropelewski C., Wang J., Jenne R., Joseph D., 1996. The NCEP/NCAR 40-year reanalysis project. Bullelin of the American Meteorological Society, 123 p.
Panidi E., Tsepelev V., Torlopova N., Bobkov A., 2016. Mapping of the Land Cover Spatiotemporal Characteristics in Northern Russia Caused by Climate Change. The International Archives of the Photogrammetry, Remote Sensing and Spatial Information Sciences, Vol. XLI-B8, pp. 997-1002. doi:10.5194/isprs-archives-XLI-B8-997-2016
Sekhon N.S., Hassan Q.K., Sleep R.W., 2010. A Remote Sensing Based System to Predict Early Spring Phenology Over Boreal Forest. The International Archives of the Photogrammetry, Remote Sensing and Spatial Information Sciences, Vol. XXXVIII, Part 1, 5 p.
Semenova I.G., 2015. Synoptic and Climatic Conditions of Formation of Arid Phenomena in Ukraine. Doctoral thesis, 296 p. (In Ukrainian)
Tsepelev V., Panidi E., Torlopova N., Bobkov A., 2015. Study of Climate Change at the North of European Russia Using Land Cover Data. SGEM2015 Conference Proceedings, Book 3, Vol. 2, pp. 529-536. doi:10.5593/SGEM2015/B32/S14.071
Vermote E., 2015. MOD09A1 MODIS/Terra Surface Reflectance 8-Day L3 Global 500m SIN Grid V006. NASA
EOSDIS Land Processes DAAC.
doi:10.5067/MODIS/MOD09A1.006
Revised May 2017
The International Archives of the Photogrammetry, Remote Sensing and Spatial Information Sciences, Volume XLII-3/W2, 2017 37th International Symposium on Remote Sensing of Environment, 8–12 May 2017, Tshwane, South Africa
This contribution has been peer-reviewed.