103
Economics of Small-scale Sheep Marketing in Gombe
Metropolitan Livestock Markets Gombe State, Nigeria
Saleh Abdullahi1, Adamu Ya’u1, Alkali Haruna Abubakar2, Hamidu Kubra1, Ya’u Shuaib1
1 Department of Agricultural Economics and Extension Federal University
Kashere Gombe State, Nigeria
2 Department of Animal Science, Federal University Kashere Gombe State Nigeria
E-mail: abdussalihi@gmail.com
Received: November 28, 2017; Accepted: January 22, 2018; Published: February 2, 2018 Permalink/DOI: http://dx.doi.org/10.17977/um002v10i12018p103
Abstract
This paper assessed the profitability of small-scale sheep marketing in Gombe Metropolis. Four sheep markets were purposively selected for their popularity in small ruminants marketing. A multi-stage sampling technique was used to select 91 sheep marketers these markets. Data were collected using structured questionnaire and were analysed using descriptive statistics, farm budget and maximisation of consumer satisfaction models. The result revealed that purchasing cost for ram and ewe constituted 92.59% and 91.50% of the total marketing costs respectively. The result further revealed the average net income of ₦4,922.46 ($13.72) per head of animal was realised. The gross and operating ratios for the respective animals were < 1; meaning that the business was profitable. Also, the returns per naira invested for ram and ewe were ₦0.17 ($0.00048) and ₦0.18 ($0.0005) respectively. The marketing coefficient (134.80%) of Tike-babba market, revealed to be most efficient. Inadequate capital was critical; this was attributed to insufficient sources of credits. However, improvement in the existing infrastructural facilities will help promote expansion of the present scale of the enterprise operations. Governments and other financial institutions should also do more to extend funds in the form of soft loans to the marketers, so as to improve efficiency.
Keywords: Market; Profitability; Efficiency; Sheep; Small-scale; Gombe JEL Classification: L10, Q13
INTRODUCTION
104
Although there are many sources of animal protein in Nigeria, recent studies have shown that cattle, goats and sheep products are the predominant and the most commonly consumed animal sourced proteins (Osinowo, 1999). From the foregoing scenario, it is obvious why sheep production and marketing are considered as notable employment and income-generating livelihood activities for the significant proportion of Nigerians [Central Bank of Nigeria] (CBN, 1999). Consequently, the outcome of enhanced production and marketing of sheep and its products can potentially lead to better income and nutritional status of households, thus; positively impinging their living standard.
Sheep are small ruminants raised and marketed in Gombe State for their meat, skins and in some rare cases for milk among other purposes. It is clear, however, that over the last few decades, the supply of mutton failed to keep pace with increasing population. This calls for the adoption of all possible measures to accelerate the rate of production in the country. According to the National Livestock Project Division [NLPD]; (NLDP, 1992), the supply of sheep and its products has witnessed a decline while the demand has been increasing with the result being a shortfall in the supply. The high cost of marketing which leads to high retail price is often the commonly cited culprit for this situation. Owing to the considerable spatial separation of production area from consumption area and other ancillary factors, there is high handling cost especially in relation to transportation (Usman & Nasiru, 2005).
105
made to provide answers to the following research questions: (i) what are the costs and returns of sheep marketing in the study area? (ii) what is the marketing efficiency of sheep markets in the study area? The specific objectives therefore include to: (i) determine the costs and returns of sheep marketing in the study area; (ii) assess the marketing efficiency of sheep markets in the study area.
METHOD The Study Area
Gombe metropolis is the principal commercial and urban centre of Gombe State, serves as the state capital as well the Headquarters of Gombe Local Government Authority. Situated on longitude 11° 10´ E and latitude 10° 17´ N; and shares common boundaries with three local government areas of the state; Akko to the south-west, Yemaltu-Deba to the east and Kwami to the north-west covering an area of 5,200 km2 [Gombe State Government] (GSG, 2015). Moreover, Gombe is regarded a confluence city of economic activities, by its position as the meeting point for agro-business people from the surrounding States of Yobe, Borno, Taraba, Adamawa, and Bauchi. This advantage made the State vibrant in all respects (GSG, 2015). According to GSG (2015), Gombe metropolis had human population of 268,536 in 2006; with a projection of 363,061 people in 2017. The inhabitants of Gombe metropolis are mostly traders, civil servants, small-scale farmers and other non-agricultural service providers. Industrial and other agro-business activities in the study area are in the form of large, medium, small and cottage scales include; ginnery, oil seeds milling, rice milling, table water production, leather works, fish and meat processing etc. (GOSEED, 2007). The climate of the area is mainly controlled by the position of the inter-tropical discontinuity zone. It represents the interface between the dry tropical air originating from the Sahara Desert and moist Equatorial Ocean zones (GOSEED, 2007). The study area is characterised with a warm climate, having a mean diurnal temperatures of 35°C to 40°C during the hottest months of (March to May) and to about less than 30°C during harmattan (GSG, 2015). The area has two distinct seasons based on the amount of rainfall received; the dry season (November to April) and the wet/rainy season (May to October) with an average (850 mm) amount of rainfall received per annum in 110 to 125 days. GSG (2015) further added that Gombe metropolis is endowed with mineral resources such as silica, dolomite, talc, uranium, and kaolin. Climate change, flooding, deforestation, wastes management, and quarry works are emerging environmental challenges.
Sampling Techniques
A multi-stage sampling technique was used to select 91 sheep marketers. In stage I, Gombe metropolis was purposively selected because it is the commercial centre of the State, and also assumed to have contained majority of the target population for the study. In stage II the study area was delineated into two major sheep market districts; Gombe-north and Gombe-south and were purposively selected. In stage III, from each market district, two markets; Tike-babba and
Tike-jauro-abare; Tike-pantami and Tike-nasarawo were purposively selected from
106
proportionate to the number of marketers in each market. This ensures that every member of the population has an equal and independent chance of being selected (Ali & Denga, 1983).
Sample Size
A sample is a representation of the population of study (Otokiti, 2005). It is however a subset of the population on which observation is taken for obtaining information and to draw valid conclusions about the population. A major reason for sampling is that sometimes it is not very feasible to cover the entire population due to a number of constraints; time, resource, size of the population, inefficient control and inconsistency of the report, (Nnamdi, 2000). However, in determining the sample size appropriate for this study, the Alamu & Olukosi (2010) model was used, where 20% of the population was suggested. Therefore, according to this model, the appropriate sample size for this study was 91 traders. A proportional allocation technique was then used to determine the number of sample from each market. For the purpose of this study, the proportion of the respondents from each market was determined using the formula below, as adopted by (Saleh et al., 2015);
ni = (p)*n … (1)
N where;
ni = proportional ratio of each market;
N = estimated target population; n = sample size;
p = population of each market.
However, according to this model, the samples were randomly and proportionally selected based on the estimated population of traders in the selected markets. The distribution of the proportionately estimated sample size/sampling frame (91/456) of sheep marketers in Gombe metropolis were; Tike-babba (42/209); Tike-jauro-abare (15/74); Tike-pantami (23/116); Tike-nasarawo (11/57); obtained from the Gombe State Sheep and Goat Traders Association.
Data Collection
Data for this study were collected from the primary sources using structured questionnaire; this was supported with personal interview in situations where the respondents did not understand the questions. Also, an informal in situ interviews noting responses and observing the marketing process was conducted simultaneously with the formal questionnaire administration. This allowed for generation of qualitative information which was not captured in the questionnaire. The questionnaire modules consisted of coded questions made to collect information on sheep marketing variables, costs-returns, sources and variations in supply and demand. In addition to coded questions, there were also open-ended questions that allowed respondents discuss freely the particular marketing issues of concern to them.
Data Analysis
107
Olukosi, 2010). This section describes many techniques that were used in data analysis for this study. In this study, the descriptive such means and percentage, the farm budget model and maximisation of consumer satisfaction approach (MCSA) were used.
Models Specification
The mean model used for the study was therefore expressed as follows, as adopted by Girei et al. (2013);
x = ∑fxi … (2) ∑f
where;
x = Mean of grouped data;
∑fxi = Sum of products of variables and frequencies; ∑f = Sum of all frequencies of variables.
To achieve objective two of the study, the enterprise analytical approach called the farm budgeting model was employed to estimate costs, returns, marketing margin, net profit and financial ratios of sheep marketing in the study area. According to Adegeye & Dittoh (1985), profit is defined as the net flow of income. Thus, how profit is measured depends on what measure chosen to be used; in essence, profit indicates whether a business is worthwhile or not. Costs-return analysis as described by Olukosi & Erhabor (2005) was achieved by the following relationships;
TC = TVC + TFC … (3) TR = P x Q … (4) NR = TR – TC … (5) where;
TC = Total marketing costs (₦)/USD; TVC= Total variable costs (₦)/USD; TFC = Total fixed costs (₦)/USD; TR = Total return (₦)/USD; NR = Net return (₦)/USD; P = Unit price of sheep (₦)/USD; Q = Number of sheep sold per week.
Marketing margin analysis was also used to measure market performance of sheep marketing in terms of profitability and viability. Adekanye (1988) described marketing margin as the difference between the price consumers pay and the price the producers get. However, Sheep market margins in the study area can be determined by the difference between the sales price of the live animal and the cost incurred by the seller including acquisition price of the animal. Thus, the general formula for analysing total marketing margin as given by Iheanacho (2005) is as follows:
MM = CP – MP x 100 … (6) CP
where;
108 MP = Market Price (₦)/USD.
Moreover, the profitability indices such as the gross ratio, operating ratio and returns to naira invested, were used to further ascertain the profit level of each enterprise and in different markets. According to Daneji et al. (2006), the indices are specified as follows;
GR = TC: TR … (7)
OR = VC: TR … (8)
R/₦ = NI: TC … (9)
where;
GR = Gross Ratio; OR = Operating Ratio; R/₦ = Returns per naira
NI = Net Income (₦)/USD VC = Variable Cost (₦)/USD
Moreover, this study considered sheep marketing efficiency as the movement of live sheep from the producer to the buyer at the lowest cost possible consistent with the provision of the services that consumer is willing and able to pay for. According to Rangasamy & Dhaka (2008), agricultural marketing efficiency is the ratio of value addition (marketing margin) for goods to their marketing costs expressed in percentage. This model is also called maximisation of consumer satisfaction approach (MCSA). Efficiency is, therefore, the ratio of output to input; output here entails the price unit of sheep that satisfies the ultimate consumer, while input entails costs incurred in marketing of the sheep. The higher the ratio the more efficient the market is. According to Haliru & Ibitoye (2014), the MCSA model is however given in its explicit form as;
ME = TR x 100 … (10) TC
where;
ME = Marketing efficiency (%) TR = Total returns (₦)/USD TC = Total costs (₦)/USD
RESULT AND DISCUSSION
Costs-returns and Profitability Analysis of Sheep Marketing in Gombe Metropolis
109
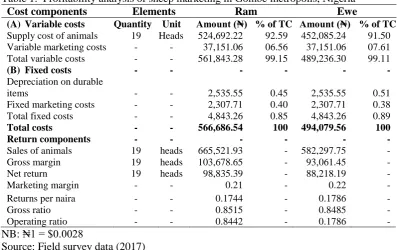
associated with moving live animals from the point of purchase/producer to the final consumer. However, Table 1 shows the average total costs and returns of trading average 19 heads of ram and/or ewe per trader per week. The results revealed the average total costs of marketing 19 heads of ram per week per trader were ₦566,686.54 ($1,586.72), and ₦494,079.56 ($1,383.42) for ewe. This was because the supply costs of rams were higher than that of ewe. The results further revealed the average variable costs accounted for 99.15% and 99.02% of the average total costs of the respective animals. This agrees with Makka (2009) who conceptualised that, small-scale entrepreneurs’ capital allocated to fixed inputs is low and sometimes negligible. Haruna et al. (2012) and Nasiru et al. (2013) further supported this idea, that the proportion of fixed cost components in small-scale agricultural marketing, mostly constituted < 1.0% of the total marketing costs in Bauchi State.
In terms of returns; the average gross margin (GM) of ₦103,687.65 ($290.33) and ₦93,061.45 ($260.57) were realised from the sales of 19 heads of ram and ewe respectively. This further revealed average net income of ₦5,201.86 ($14.57) and ₦4,643.06 ($13.0); per head of the respective animals. The result concurred with Mafimisebi et al. (2014), who found gross margins of ₦6,548.00 ($18.33); per head of cattle in south-west Nigeria. Also, Okewu & Iheanacho (2015), recorded similar results that ₦3,037 ($8.50) per head of goat was realised as net income in Benue State. These corroborate the assertion of Alkali & Saleh (2013) that, for any small-scale agro investment to optimally achieve profitability, at least 10% of the total variable costs should be realised as net firm income. However, this translates that sheep marketing in Gombe Metropolis was profitable, as further confirmed by the rate of returns to investment, where ₦0.17 ($0.00047) and ₦0.18 ($0.0005) were realised from every ₦1 ($1) invested on the respective animals. Iheanacho & Ali (2010) admitted that return per naira/USD of 0.14/0.00039 showed small ruminants’ marketing was a profitable venture in Maiduguri metropolis Borno State Nigeria. Also, in line with Kolo (2015) who found returns per naira/USD invested in sheep marketing in Dambam Local Government Area of Bauchi State was (0.15/0.00042); and concluded that the enterprise was profitable. According to Mafimisebi et al. (2014), another interesting observation is that profitability was highest among the livestock traders. This might not be unconnected with the distance over which the animals were transported to the point of sales and provided place utility; was the major value-adding activity in sheep marketing. Thus, findings from this study seem to suggest that the greater the distance covered to and fro the source of supply, the higher the chances of achieving optimum profit.
110
the relationship between the total revenues and the average total costs, and evaluates the performance of the business; such that lower ratio of < 1 is considered desirable, which entails higher returns per Naira/USD invested (Daneji et al., 2006). However, the results revealed gross ratio (0.8515) for ram and (0.8485) for ewe marketing. Meaning that 85.15% and 84.85% of the total revenues give to pay for the total costs of marketing ram and ewe respectively. Operating ratio is a ratio of a firm’s variable costs to its total revenue. A positive and lower ratio of < 1 is desirable, and indicates in the event of decline in sales or revenues; the firm will maintain its profitability status. The ratio does not guaranty debt repayment or expansion of the firm’s venture. Table 1 shows operating the ratio of 0.8442 and 0.8402 for ram and ewe respectively. Meaning that 84.42% and 84.02% of the total revenues were used up to pay for the variable costs of the respective animals. This indicates a moderate return to investment outlay. However, any enterprise having a moderate return to investment outlay is considered successful in terms of performance (Saleh et al., 2015). Only an enterprise with a ratio > 1 is disastrous because it is indicating overutilisation of certain resources (Olukosi & Abraham, 2008). Also, Table 1 shows the rate of return to investment (0.1744) and (0.1786) for ram and ewe respectively. This further confirmed the relative profitability of the enterprise as stated above. Baruwa (2013) had similar findings; that for every ₦1($1) expended on goat marketing in Osun State Nigeria; ₦0.13($0.00036) was realised as net income, and concluded that the business was profitable.
Table 1. Profitability analysis of sheep marketing in Gombe metropolis, Nigeria
Cost components Elements Ram Ewe
(A) Variable costs Quantity Unit Amount (₦) % of TC Amount (₦) % of TC Supply cost of animals 19 Heads 524,692.22 92.59 452,085.24 91.50 Variable marketing costs - - 37,151.06 06.56 37,151.06 07.61 Total variable costs - - 561,843.28 99.15 489,236.30 99.11
(B) Fixed costs - - - - - -
Depreciation on durable
items - - 2,535.55 0.45 2,535.55 0.51
Fixed marketing costs - - 2,307.71 0.40 2,307.71 0.38
Total fixed costs - - 4,843.26 0.85 4,843.26 0.89
Total costs - - 566,686.54 100 494,079.56 100
Return components - - - - - -
Sales of animals 19 heads 665,521.93 - 582,297.75 -
Gross margin 19 heads 103,678.65 - 93,061.45 -
Net return 19 heads 98,835.39 - 88,218.19 -
Marketing margin - - 0.21 - 0.22 -
Returns per naira - - 0.1744 - 0.1786 -
Gross ratio - - 0.8515 - 0.8485 -
Operating ratio - - 0.8442 - 0.1786 -
NB: ₦1 = $0.0028
Source: Field survey data (2017)
Marketing Efficiency of Sheep in Gombe Metropolis
111
A market that is efficient does not only bring sellers and buyers together but also enables them take advantage of opportunities to innovate and improve in response to demand and price changes (Fakayode et al., 2010). To determine the marketing efficiency of sheep markets in Gombe metropolis, the Maximisation of Consumer Satisfaction Approach (MCSA) model was used. This was because (Arene, 1998), considered this model as most accurate for measuring marketing efficiency of livestock markets. Table 2 shows market efficiency of 134.80% was estimated for
Tike-babba market (highest), and Tike-nasarawo market recorded marketing
coefficient of 126.75% (least). Other markets include Tike-jauro-Abare and
Tike-pantami having 130.23% and 128.87% marketing coefficients respectively.
Moreover, the mean marketing efficiency of sheep markets in the study area was 130.16%. Implying that, the marketing system had achieved 30.16% of the marketing costs. In other words, an average sheep marketer in Gombe metropolis could earn ₦ 30.16 ($0.08) as net income for every ₦100 ($retail price paid by the final consumer in the marketing process. This is an indication of the extent to which the price of sheep reflects the wishes of the consumers in the study area (Olukosi & Isitor, 2005). However, Maikasuwa & Jabo (2014) recorded marketing efficiencies of 133% and 146% for sheep and goat in Sokoto metropolis respectively; and concluded that marketing of sheep and goats overreact to market information. This could be as a result of too much speculation about the spatial and seasonal fluctuations in the prices of animals by the marketers. The result agrees with Tijjani
et al. (2014) that, the marketing efficiency (132.67%) was obtained in dried fish
markets in Maiduguri metropolis Borno State, Nigeria. Implying that, processed products marketers received ₦ 32.67 ($0.09) per ₦ 100 ($0.28) invested per carton as net profit. But, Sahib et al. (1997) posited that cattle markets in Nigeria were characterised by inefficiencies. Also, Okeke, (2007) reported marketing efficiency (<1) of cattle markets in Jos metropolis Plateau State, and concluded that the markets were inefficient. Haliru & Ibitoye (2014) reported the average marketing inefficiency of –40.86% which could be due to some errors in the operational activities, since marketing efficiency is a function of pricing and other operational activities. It thus implies that other factors, (probably in the allocation of variable inputs and fixed inputs in the business) were not optimally allocated, hence the deviation from 100%.
112
prices (RP) and producer prices (PP) are high the middlemen tried to control the market prices by reducing their marketing margin (MM). This may help to protect the consumers directly because RP and PP normally increase due to low supply of the production of farm produce and/or high demand for it. When the prices are low they try to get more benefits by increasing their marketing margin (MM) as rational entrepreneurs (Jongur & Ahmed, 2008). According to Ahmed & Rustagi (1985); and Ike & Chukwuji, (2005), very high percentage of marketing margin sometimes indicates inefficiency because a high cost is incurred in the provision of marketing services; and middlemen are often blamed for earning excessive profits (Collinson et al., 2002). This is not always so. However, an increase in absolute margin is not clearly an indicator of efficiency or inefficiency of the markets. It may mean that returns to factor inputs have increased rather than that the inputs are being wastefully utilized. Then again, the increase in margins may be due to an improvement in the services performed or the utilities created for the consumers (Afolabi, 2007). For instance, higher consumer prices as in Tike-babba market may not necessarily express high profit, but increased qualities and quantities of service, low labour, capital and management productivity, leaving producers and consumers better off. While lower consumer prices as in Tike-nasarawo market may co-exist with inefficient resource use, poor coordination and consumer satisfaction, and disproportionate profit elements due to low productivity (Adekanye, 2008).
Table 2. Efficiency of sheep markets in Gombe metropolis, Nigeria
Markets SC (₦) MC (₦) TC (₦) CP (₦) VA (₦)
Abare 377,000.0 40,352.10 417,352.10 543,500.0 166,500.0 0.3
1 130.23
Nasarawo 287,625.0 39,397.94 327,022.94 414,500.0 126,875.0 0.3
1 126.75
Pantami 573,125.0 38,751.05 611,876.05 788,500.0 215,375.0 0.2 NB: ₦1 = $0.0028; SC = Supply costs; MC = Marketing costs; Total costs; CP = Consumer price; VA = Value addition; MM = Marketing margin; ME = Marketing efficiency Source: Field survey data (2017)
CONCLUSION
113
sheep marketing in Gombe metropolis; Meat consumption still remains the major source of proteins; as shown by positive market margins; heavy and sustained investment by individuals and government in this sector is recommended, so that production and marketing of sheep will become a business away from its present subsistence state; Governments and other financial institutions should do more to extend funds in the form of soft loans to the marketers. This will help increase the capital base of the traders and also attract more people into the business, and will also enable them embark on large scale operations; thereby meeting up the gaps between demand and supply especially during festive periods; To ensure good marketing for small ruminants, the extension service units should encourage producers to target the festive periods when the animals would command good market prices due to seasonality in the demands; Governments and other stakeholders should provide favourable and functional market regulating framework that can eliminate illegal fees or taxes charged along marketing channels for small ruminants. Also, government should harmonise taxes paid by the marketers and producers so as to have a unified livestock taxing system.
REFERENCES
Adegeye, A. J., & Dittoh, J. S. (1985). Essentials of Agricultural Economics, Ibadan, Impact Publishers Limited.
Adejobi, A. O. (2005). Cowpea Marketing in Maiduguri, Borno State: Investigation on building a food Marketing Policy Evidence base in Nigeria. Scholarly
Journal of Agricultural Science,4(8), 449–459.
Adekanye, T. O. (1988). A Rice Grading Scheme for Nigeria, In Adekanye T. O. (eds): Readings in Agricultural Marketing (1988), Lagos, Longman Group Limited.
Adekanye, T. O. (2008). Marketing Margins for Food: Some Methodological Issues and Empirical Findings for Nigeria. Canadian Journal of Agricultural
Economics, 30(3), 333-344.
Afolabi, J. A. (2007). Evaluation of Poultry Egg Marketing in South Western Nigeria. International Journal of Poultry Science,6(5), 362–366.
Alamu, J. F., & Olukosi, J. O. (2010). Simplified Research Methodology:Principles
and Practices: (revised edition), Zaria, Great Glory Publishers.
Ali, A., & Denga, I. D. (1983). An Introduction to Research Methods and Statistics
in Education and Social Sciences, Jos, Savannah Publishers Limited.
Alkali, H. A., & Saleh, A. (2013). Socio-economic Profile of Camel Herders in Sokoto State, Nigeria. International Journal of Food and Agricultural
Research, 10(1&2), 105–108.
Awotide, D. O. & Ajala, S. O. (2007). Performance and Determinants of Maize Grain Marketing in Northern Nigeria. Proceedings of the 9th Annual National Conference of the Nigerian Association of Agricultural Economics (NAAE), Abubakar Tafawa Balewa University Bauchi. 5th– 8th November, Pp 329 – 335.
Baruwa, O. I. (2013). Empirical Analysis of Costs and Returns to Goat Production under Tropical Conditions. Journal of Livestock Science, 4(1),44–50. Bipradas, R. (2014). Studies on Marketing Efficiency of Agricultural Products in
India: A Critical Evaluation. International Journal of Multidisciplinary
114
Central Bank of Nigeria Annual report; C.B.N. (1999). Lagos, Nigeria, December, 99pp.
Collinson, C. D., Kleih, U., Burnett, D. G., Ferris, R. S. B., Jagwe, J. N., & Muganga, A. K. (2002). Transaction Costs Analysis: Plan for the Modernisation of Agriculture. The Natural Resources Institute and the International Institute of Tropical Agriculture (FoodNet). Consultative Group on International Agricultural Research (CGIAR). Washington DC, USA
Daneji, M. I., Malumfashi, A. I., & Muhammed, S. G. (2006). Profitability Analysis of Groundnut Production in Bauchi L.G.A. of Bauchi State, Nigeria.
Savannah Journal of Agriculture, 1(2), 165-170.
Fakayode, S. B., Omotesho, O. A., Babatunde, R. O., & Momoh, A. A. (2010). The Sweet Orange Market in Nigeria - How Viable? Research Journal of
Agriculture and Biological Science,6(9), 395–400.
Food and Agriculture Organisation; F.A.O. (2006). Addressing Marketing and Processing Constraints that Inhibit Agri-food exports: A guide for policy analysts and planners. Agricultural Service Bulletin No. 160. Rome. Italy. 109pp.
Giroh, D. Y., Umar, H. Y. & Yakubu, W. (2010). Structure, Conduct and Performance of Farm Gate Marketing of Natural Rubber in Edo and Delta States, Nigeria. African Journal of Agricultural Research, 5(14), 1780– 1783.
GOSEEDS. (2007). Gombe State Economic Empowerment and Development Strategy: Handbook, Abuja, Dandafid Nig. Ltd.
G.S.G. (2015). Gombe State Government: Profile. Retrieved on 15/03/2017; from: http://www.tiptopglobe.com/cities-nigeria?region=55&n=Gombe&a=G. Haliru, Y. U., & Ibitoye, S. J. (2014). Evaluation of Market Structure and
Efficiency of Gum Arabic Marketers in North-Eastern Nigeria. Asian
Journal of Management Sciences and Economics, 1(1), 1–11.
Haruna, U., Sani, M. H., Danwanka, H. A., & Adejo, E. (2012). Economic Analysis of Fresh Tomato Marketers in Bauchi Metropolis of Bauchi State, Nigeria.
Nigerian Journal of Agriculture, Food and Environment, 8(3), 1–8.
Iheanacho, A. C. (2005). Structural Characteristics and Performance of Retail Marketing of Egg in Maidugri Metropolis of Borno State Nigeria. Journal
of Sustainable Development in Agriculture and Environment, 1(4), 70–76.
Iheanacho, A. C., & Ali, E. A. (2010). Economics of Sahelian Goat marketing: A case study of Maiduguri Metropolis Borno State. Journal of Veterinary
Science, 9(1), 234-246.
Ike, P. C. & Chukwuji, C. O. (2005). Efficiency Measurement of Cashew nut marketing in Enugu State, Nigeria. Journal of Agriculture, Food,
Environment and Extension,4(1), 46-49.
Issahaku, H., Paul, K. N., & Yazidu, U. (2012). Structure, Conduct and Performance of Tomato Marketing in Ghana. Journal of Economics and
Sustainable Development, 3(10), 222-235.
115
Kolo, A. (2015). Economics of Sheep Marketing in Dambam Local Government Area of Bauchi State, Nigeria. Unpublished M.Sc. Thesis; Department of Agricultural Economics and Extension, Abubakar Tafawa Balewa University Bauchi.
Mafimisebi, T. E. (2012). Spatial Equilibrium, Market Integration and Price Exogeneity in Dry Fish Marketing in Nigeria: A Vector Auto-regressive (VAR) Approach. Journal of Economics, Finance and Administrative
Sciences,17(33), 31-37.
Mafimisebi, T. E., Bobola, O. M., & Mafimisebi, O. E. (2014). Fundamentals of Cattle Marketing in Southwest, Nigeria: Analyzing Market Intermediaries, Price Formation and Yield Performance. Journal of Applied Tropical
Agriculture,19(1), 30-38.
Maikasuwa, M. A., & Jabo, M. S. (2014). Analysis of Sheep and Goats Marketing in Sokoto Metropolis, Sokoto State, Nigeria. International Journal of
Agricultural Sciences and Veterinary Medicine, 2(1), 185-198.
Makka, B. T. (2009). Economic Analysis of Tomato Production in Yamalta-Deba LGA, Gombe State, Nigeria. Unpublished M.Sc. Thesis; Department of Agricultural Economics and Extension, ATBU, Bauchi.
Nasiru, M., Haruna, U. & Garba, A. (2013). Economics of Livestock Marketing in Gamawa Local Government Area, Bauchi State, Nigeria: Repositioning Africa Agriculture by Enhancing Productivity Market Access Policy Dialogue and Adapting to Climate Change. 8th AFMA Conference, Moi University press, Pp 411 – 424.
Nigerian National Livestock Project Division, NLPD: (1992): Survey in Kaduna, Nigeria, Vol. 58, Pp 175 – 177.
Nnamdi, A. (2000). Research Methodology in the Behavioural Sciences, Lagos,
Longman Nigeria Plc.
Olagbaju, J. & Falola, T. (1996). Post-Independence Economic Changes and Development in West Africa”: An Economic History of West Africa since
1750, Ibadan, Rex Charles
Olaoye, J. O. & Rotimi, A. O. (2010). Measurement of Agricultural Mechanization Index and Analysis of Agricultural Productivity of some Farm Settlements in South West, Nigeria”.Agricultural Engineering International: the CIGR Manuscript, Vol. XII, No. 1372.
Olukosi, J. O. & Erhabor, P. O. (2005). Introduction to Farm Management
Economics: Principles and Applications, Zaria: Agitab Publishers
Company.
Olukosi, J. O. & Isitor, S. U. (2005). Introduction to Agricultural Marketing and
Prices: Principles and Applications, Abuja, Living Books Publishers
Company.
Olukosi, J. O. & Abraham, O. O. (2008). Introduction to Agricultural Production
Economics: Principles and Application, (3rd eds.), Abuja, Nigeria, G. U.
Publications.
Okeke, K. I. (2007). Economics of Cattle Marketing in Jos Plateau State Nigeria, Implications for Efficient Market Development and Sustenance in Nigeria. Proceedings of the 9th Annual National Conference of the Nigerian
116
Okewu, J., & Iheanacho, A. C. (2015a). Socio-economic Characteristics of Goat Marketers in Benue State, Nigeria. ARC Journal of Social Sciences and
Humanities,1(1), 54-66.
Okonkwo, K. N. (2013). Analysis of Poultry Feeds Marketing in Ahiazu-Mbaise LocalGovernment Area of Imo State. Journal of Marketing and Consumer
Research, 1(2): 76-82.
Osinowo, O. A. (1999). Strategies towards Enhancement of small ruminant Productivity by small scale farmers in the Sahelo – Sudan Savanna areas of Nigeria. Proceedings of the International Seminar; on promoting sustainable small-scale livestock production towards reduction of
malnutrition and poverty in rural and sub-urban families in Nigeria. Held
in Zaranda Hotel, Bauchi, March, 7th – 11th, Pp 42 – 53.
Otokiti, S. O. (2005). International Business: How to Get Started in International
Business Environment, Lagos, Pumark Publishers Nigeria Limited.
Rangasamy, N., & Dhaka, J. P. (2008). Marketing Efficiency of Dairy Products for Co-operative and Private Dairy Plants in Tamil Nadu. A Comparative Analysis. Journal of Agricultural Economic Research,2(1): 235-242. Sahib, B., Aliyu, A., & Bakoshi, J. S. (1997). National Agricultural Research Plan,
1998-2010: Federal Ministry of Agriculture, Abuja, Nigeria. Pp. 3 – 35. Saleh, A., Kolo, A., Idi, S., Sani, M. H. & Ochi, J. E. (2015). Profitability and
Marketing Efficiency of Small-scale Groundnut Oil Processing in Gombe Metropolis Gombe State, Nigeria. Proceedings of the 29th Annual conference of the Farm Management Association of Nigeria (FAMAN), held at the Faculty of Agriculture, Federal University Dutse, Jigawa State, Nigeria.” 23rd – 26th November, Pp 237 – 248.
Sandika, A. L. (2011). Impact of Middlemen on Vegetable Marketing Channels in Sri Lanka. Tropical Agricultural Research & Extension,14(3), 2514 – 2523. Tijjani, B. A., Ismail, A., Goni, M., & Fannami, A. M. (2014). Analysis of Conduct and Performance of Dried Fish Market in Maiduguri Metropolis of Borno State, Nigeria. Journal of Economics and Sustainable Development, 5(5), 38-46.
Umar, H. Y., Otitolaiye, J. O., & Opaluwa, H. I. (2011). Evaluation of Acacia spp (Gum Arabic) Market Structure, Conduct and Performance in Borno State, Nigeria. Journal of Agriculture and Social Science, 7(1), 17-20.