MEASURING LEAF WATER CONTENT USING MULTISPECTRAL TERRESTRIAL
LASER SCANNING
S. Junttila 1,2,*, M. Vastaranta 1,2, R. Linnakoski 1,3, J. Sugano 1, H. Kaartinen 4, A. Kukko 2,4, M. Holopainen 1,2, H. Hyyppä 2,5, J. Hyyppä 2,4
1
Department of Forest Sciences, University of Helsinki, 00014 Helsinki, Finland - (samuli.juntttila, mikko.vastaranta, junko.sugano, markus.holopainen)@helsinki.fi
2 Centre of Excellence in Laser Scanning Research, Finnish Geospatial Research Institute FGI, 02431 Masala, Finland. 3
Natural Resources Institute Finland (Luke), Latokartanonkaari 9, 00790 Helsinki, Finland - riikka.linnakoski@luke.fi 4 Department of Remote Sensing and Photogrammetry, Finnish Geospatial Research Institute FGI, 02431 Masala, Finland -
(harri.kaartinen, antero.kukko, juha.hyyppa)@nls.fi
5 Department of Built Environment, Aalto University, P.O.Box 15800, 00076 Aalto, Finland - hannu.hyyppa@aalto.fi Commission ΙΙI, WG III/4
KEY WORDS: Tree health, drought, multispectral laser scanning, terrestrial laser scanning, forestry, leaf water content, Endoconidiophora polonica.
ABSTRACT:
Climate change is increasing the amount and intensity of disturbance events, i.e. drought, pest insect outbreaks and fungal pathogens, in forests worldwide. Leaf water content (LWC) is an early indicator of tree stress that can be measured remotely using multispectral terrestrial laser scanning (MS-TLS). LWC affects leaf reflectance in the shortwave infrared spectrum which can be used to predict LWC from spatially explicit MS-TLS intensity data. Here, we investigated the relationship between LWC and MS-TLS intensity features at 690 nm, 905 nm and 1550 nm wavelengths with Norway spruce seedlings in greenhouse conditions. We found that a simple ratio of 905 nm and 1550 nm wavelengths was able to explain 84% of the variation (R2) in LWC with a respective prediction accuracy of 0.0041 g/cm2. Our results showed that MS-TLS can be used to estimate LWC with a reasonable accuracy in environmentally stable conditions.
1. INTRODUCTION
Measuring tree health is an increasingly important topic as the world’s climate is warming and growing human population puts the environment and forests on more stress (Williams et al., 2013). Forests provide many ecosystem services, such as carbon storage, recreational activities, timber and non-timber forest products, which are jeopardized due to declined forest health and increased forest mortality (Hanewinkel et al., 2013). Managing declining forests efficiently in the face of climate change requires new information on the condition of forests (Allen et al., 2010); thus, new methods for mapping and monitoring of forest health are needed.
The healthiness of a tree is a fuzzy concept not easy to define, but it could be referred as vigour, i.e. a tree that is defined as healthy is growing at a pace typical to its environmental conditions.
Tree health assessments have been typically based on visual estimation of crown colour, the amount foliage and bark condition. The subjective nature of these measures can lead to bias and require high expertise. The health of a tree is closely linked to its biochemical properties, i.e. does it have enough chlorophyll, water, and nutrients to maintain photosynthesis and growth. These properties have been difficult to measure remotely due to the subtle nature of their response in spectral properties but recent advances in active remote sensing methods could provide new tools for tree health measurements.
Leaf water content (LWC) is an early indicator of tree health that can be measured objectively (Skakun et al., 2003; White et al., 2007). LWC affects leaf reflectance in the shortwave infrared spectrum due to the absorbing nature of water at these
wavelengths which can be used to estimate LWC remotely (Ceccato et al., 2001). The estimation of LWC in terms of equivalent water thickness (EWT, the ratio of the weight of water and leaf area) and drought has been recently studied using single wavelength terrestrial laser scanning (TLS) and multispectral terrestrial laser scanning (MS-TLS) (Junttila et al., 2015; Junttila et al., 2016; Zhu et al., 2015). Single wavelength TLS has been shown to be able to explain 76% of the variation in EWT after radiometric correction including incidence angle correction (Zhu et al., 2015). Zhu et al. (2017) have investigated the estimation of canopy EWT with a full-waveform single wavelength TLS resulting in a significant correlation between canopy EWT and TLS intensity backscatter (R2=0.66). The estimation of leaf EWT with a dual-wavelength terrestrial laser scanner has been studied resulting in R2 of 0.8, but the study used a low number of samples and species (Gaulton et al., 2013). These studies have used a limited number of samples and wavelengths to estimate EWT, thus, more investigations are needed to verify the applicability of laser scanning in EWT estimation.
examined in order to find laser intensity-derived features for during the growing season between May and August 2016. The seedlings were subjected to different treatments to induce drought and variation in EWT. The seedlings were divided into five groups for different treatments. Three of the groups received 75%, 50%, and 25% of “normal” watering amount (groups D75, D50 and D25). The watering amount of the groups was adjusted during the experiment to ensure a decrease in EWT. The fourth group was grown with a sufficient amount of water for 10 weeks until irrigation was completely stopped, and the seedlings were for two weeks without watering (group D_tot). The fifth group of seedlings were inoculated with Endoconidiophora polonica, a fungal pathogen that disturbs the flow of water and nutrients in the phloem and sap wood (group F). The amount of water given to the seedlings was adjusted according to the temperature inside the greenhouse during the experiment. During the 12 weeks 8-14 seedlings were randomly collected from each treatment for TLS measurements at eight time intervals.
2.2 TLS instruments and data processing
The seedlings were scanned with three different TLS instruments consequentially from the same position from a distance of 5.2 m inside the greenhouse. The TLS instruments used were: a Leica HDS6100 (Leica Geosystems AG, Heerbrugg, Switzerland), a FARO S120 (FARO Europe GmbH & Co. KG, Korntal-Münchingen, Germany), and a FARO X330, utilizing wavelengths at 690 nm, 905 nm, and 1550 nm, respectively. Three white spheres were used as common targets to register the scans with each other facilitating the segmentation of point clouds in the processing of the data. Measuring vegetation with a TLS that utilizes phase-shifting measurement technique for range determination tends to produce a high number of “ghost” points (Balduzzi et al., 2011). The number of ghost points was reduced by filtering the data with a statistical outlier algorithm in the CloudCompare software package (Girardeau-Montaut, 2011). Then, cloud-to-cloud distances were calculated for the point cloud-to-clouds where the distance of a point is calculated to the nearest point in the reference cloud (FARO X330). The maximum distance was set to 2 mm which is the ranging error announced by the manufacturers of the TLSs.
Points from each seedling were detached manually from the scans for further processing. Since the FARO laser scanners showed non-linearity in their intensity response, a four-grade Spectralon panel, with nominal reflectances of 99%, 50%, 25% and 12%, was used to calibrate the intensity data (I) to relative reflectance (ρ690, ρ905, and ρ1550) by fitting the intensity of the detached points from the panel to reflectance measurements from an ASD spectrophotometer at each wavelength. No normalization of the intensity data was conducted, thus, temperature and humidity could have affected the intensity measurements. weighed (with a precision of 0.0001 g) to measure fresh weight, scanned with a Epson V370 Photo flatbed scanner (Epson mass of water with leaf area for each sample with the following equation: weight of the dried needles (g), and A is the surface area of the fresh needles (cm2).
A set of statistical features were calculated from the intensity data from each point cloud representing a seedling at each wavelength. Intensity features were calculated from the calibrated intensity data for each seedling at each wavelength. These features were the mean, minimum, maximum, standard deviation of the intensity values. Based on these features, a set of spectral indices were calculated for each point cloud based on ratio and normalization operations. The indices are referred with the abbreviation, feature name and a subscript describing the wavelengths used for the calculation (e.g. NDVI690,1550).
� ,� = �� , (2)
����� ,� = � −�� +� , (3)
where ρ1 and ρ2 are the mean of calibrated intensity at wavelengths ρ1 and ρ2.
The relationship between ecophysiological parameters and laser intensity features was investigated using simple linear regression. We used coefficient of determination (R2) and root mean square error (RMSE) to assess the goodness of the fit between the variables with the following equations:
3. RESULTS AND VALIDATION
3.1 The treatments effects on EWT
All the treatments affected EWT during the experiment (Figure 1). The inoculated seedlings infected with the pathogen showed a rapid decrease in EWT during the first 2-4 weeks of the experiment. The seedlings in the drought treatment groups showed resistance to drought and a longer time interval was necessary for a significant decrease in EWT.
Figure 1. Equivalent water thickness (EWT) in the treatment groups during the experiment.
3.2 The MS-TLS intensity response to varying EWT
The single wavelength laser intensity features explained the variation in EWT only moderately, the 1550mean being the best explanatory intensity feature explaining 53% of the variation in EWT (Table 1). The 1550mean increased with decreasing leaf EWT as less water was present to absorb the reflectance at this wavelength. The 1550std feature showed to explain 47% and the 1550max feature 24% of the variation in EWT while other single wavelength intensity features at 690 nm and 905 nm wavelengths were able to explain only 2-15% of the variation in EWT.
Intensity feature R2 RMSE
1550mean 0.53 0.0071
1550std 0.47 0.0075
1550min 0.02 0.010
1550max 0.24 0.0090
905mean 0.12 0.0097
905std 0.15 0.0095
905min 0.15 0.0095
905max 0.14 0.0096
690mean 0.12 0.0097
690std 0.07 0.010
690min 0.13 0.0096
690max 0.02 0.010
Table 1. Coefficients of determination (R2) and root mean square error values (RMSE) for the regression models between single wavelength laser intensity features and equivalent water
thickness.
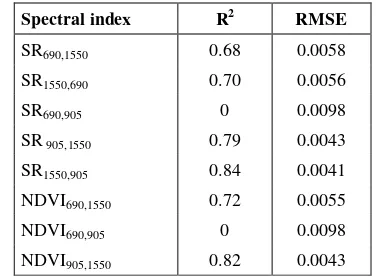
Strong correlations between laser intensity based spectral indices and EWT were found (Table 2). Spectral indices calculated from the 690 nm and 1550 nm wavelengths explained 68-72% of the variation in EWT, NDVI690,1550 showing the best explanatory power with R2 of 0.72. Spectral indices based on 905 nm and 1550 nm wavelengths were able to explain 79-84% of the variation in EWT. The SR1550,905 index showed the highest R2 with a value of 0.84 and a respective prediction accuracy of 0.0041 g/cm2 (Figure 2).
Spectral index R2 RMSE
SR690,1550 0.68 0.0058 SR1550,690 0.70 0.0056
SR690,905 0 0.0098
SR 905,1550 0.79 0.0043 SR1550,905 0.84 0.0041 NDVI690,1550 0.72 0.0055 NDVI690,905 0 0.0098 NDVI905,1550 0.82 0.0043
Table 2. Coefficients of determination (R2) and root mean square error (RMSE) for the linear regression models between
spectral indices and EWT.
Figure 2. Relationship between the best explanatory laser intensity variable and equivalent water thickness (EWT).
4. DISCUSSION
The use of MS-TLS based spectral indices showed potential for estimating EWT in tree seedlings. Relatively high prediction accuracy with R2 of 0.84 was achieved although no normalization of intensity data for individual scans was conducted indicating that the intensity measurements were rather consistent in these environmental conditions. The combination of 905 nm and 1550 nm wavelengths was able to explain more of the variation in EWT than the combination of 690 nm and 1550 nm which is in accordance with previous research (Ceccato et al., 2001). A wavelength in the near-infrared spectrum is needed for normalizing leaf structural effects such as specific leaf area rather than one in the visible spectrum (Ceccato et al., 2001). Thus, the wavelength at 690 nm used here was found redundant for estimating EWT.
Here, the study was conducted in greenhouse conditions where background illumination was low and other environmental variables such as humidity and temperature were constant. The studied method needs to be investigated in a forest environment to validate the applicability of the method for mature tree canopies. A forest environment is expected to be challenging for using several laser scanners due to wind which moves the tree canopies during data collection, thus, data correction pipelines that are able to improve poor data quality due to wind are needed.
Separating laser returns between woody and foliage parts is also a challenge that needs investigation to be able to measure EWT of mature tree canopies. Scanning trees below the canopy targets
particularly the lower part of the canopy; thus, the response of the tree canopies to drought and other factors that affect EWT, and how the alterations in EWT are distributed along the vertical profile of the canopies is of interest in developing methods for estimating EWT with MS-TLS. Furthermore, dry and dying branches below the vigorous part of the canopy may affect the measurements.
5. CONCLUSIONS
The utilization of MS-TLS intensity data in estimating EWT in Norway spruce seedlings showed high potential in this study. In environmentally stable conditions a strong correlation (R2=0.84) between EWT and a laser intensity based spectral index (SR1550,905) was observed with a prediction accuracy of 0.0041 g/cm2. Based on our results, the use of MS-TLS can greatly improve the estimation of EWT for coniferous species compared to using single wavelength TLS.
6. ACKNOWLEDGEMENT
This research has been co-financed by Center of Excellence in Laser Scanning Research (CoE-LaSR), Niemi-foundation and Finnish Cultural Foundation.
REFERENCES
Allen, C.D., Macalady, A.K., Chenchouni, H., Bachelet, D., McDowell, N., Vennetier, M., Kitzberger, T., Rigling, A., Breshears, D.D., Hogg, E., 2010. A global overview of drought and heat-induced tree mortality reveals emerging climate change risks for forests. For. Ecol. Manage. 259, pp. 660-684.
Balduzzi, M.A., Van der Zande, D., Stuckens, J., Verstraeten, W.W., Coppin, P., 2011. The properties of terrestrial laser system intensity for measuring leaf geometries: A case study
with conference pear trees (Pyrus Communis). Sensors 11, pp. 1657-1681.
Ceccato, P., Flasse, S., Tarantola, S., Jacquemoud, S., Grégoire, J.-M., 2001. Detecting vegetation leaf water content using reflectance in the optical domain. Remote Sens. Environ. 77, pp. 22-33.
Danson, F., Steven, M., Malthus, T., Clark, J., 1992. High-spectral resolution data for determining leaf water content. Int. J. Remote Sens. 13, pp. 461-470.
Easlon, H.M., Bloom, A.J., 2014. Easy Leaf Area: Automated digital image analysis for rapid and accurate measurement of leaf area. Appl. Plant Sci. 2.
Gaulton, R., Danson, F., Ramirez, F., Gunawan, O., 2013. The potential of dual-wavelength laser scanning for estimating vegetation moisture content. Remote Sens. Environ. 132, pp. 32-39.
Girardeau-Montaut, D., 2011. Cloudcompare-open source project. OpenSource Project.
Hanewinkel, M., Cullmann, D.A., Schelhaas, M.-J., Nabuurs, G.-J., Zimmermann, N.E., 2013. Climate change may cause severe loss in the economic value of European forest land. Nature Climate Change 3, pp. 203-207.
Junttila, S., Kaasalainen, S., Vastaranta, M., Hakala, T., Nevalainen, O., Holopainen, M., 2015. Investigating Bi-Temporal Hyperspectral Lidar Measurements from Declined Trees—Experiences from Laboratory Test. Remote Sens. 7, pp. 13863-13877.
Junttila, S., Vastaranta, M., Liang, X., Kaartinen, H., Kukko, A., Kaasalainen, S., Holopainen, M., Hyyppä, H., Hyyppä, J., 2016. Measuring Leaf Water Content with Dual-Wavelength Intensity Data from Terrestrial Laser Scanners. Remote Sens. 9.
Kaasalainen, S., Nevalainen, O., Hakala, T., Anttila, K., 2016. Incidence Angle Dependency of Leaf Vegetation Indices from Hyperspectral Lidar Measurements. Photogramm. Fernerkun. 2016, pp. 75-84.
Skakun, R.S., Wulder, M.A., Franklin, S.E., 2003. Sensitivity of the thematic mapper enhanced wetness difference index to detect mountain pine beetle red-attack damage. Remote Sens. Environ. 86, pp. 433-443.
Team, R.C., 2013. A language and environment for statistical computing. R Foundation for Statistical Computing, Vienna, Austria.
White, J., Coops, N., Hilker, T., Wulder, M., Carroll, A., 2007. Detecting mountain pine beetle red attack damage with EO‐1 Hyperion moisture indices. Int. J. Remote Sens. 28, pp. 2111-2121.
Williams, A.P., Allen, C.D., Macalady, A.K., Griffin, D., Woodhouse, C.A., Meko, D.M., Swetnam, T.W., Rauscher, S.A., Seager, R., Grissino-Mayer, H.D., 2013. Temperature as a potent driver of regional forest drought stress and tree mortality. Nat. Clim. Change 3, pp. 292-297.
terrestrial laser scanner backscatter intensity with radiometric correction. ISPRS J. Photogramm. 110, pp. 14-23.