Crystal
Reports
®
10
FOR
by Allen G. Taylor
Crystal
Reports
®
10
FOR
111 River Street Hoboken, NJ 07030-5774
Copyright © 2004 by Wiley Publishing, Inc., Indianapolis, Indiana Published by Wiley Publishing, Inc., Indianapolis, Indiana Published simultaneously in Canada
No part of this publication may be reproduced, stored in a retrieval system or transmitted in any form or by any means, electronic, mechanical, photocopying, recording, scanning or otherwise, except as per-mitted under Sections 107 or 108 of the 1976 United States Copyright Act, without either the prior written permission of the Publisher, or authorization through payment of the appropriate per-copy fee to the Copyright Clearance Center, 222 Rosewood Drive, Danvers, MA 01923, (978) 750-8400, fax (978) 646-8600. Requests to the Publisher for permission should be addressed to the Legal Department, Wiley
Publishing, Inc., 10475 Crosspoint Blvd., Indianapolis, IN 46256, (317) 572-3447, fax (317) 572-4447, e-mail: [email protected].
Trademarks:Wiley, the Wiley Publishing logo, For Dummies, the Dummies Man logo, A Reference for the Rest of Us!, The Dummies Way, Dummies Daily, The Fun and Easy Way, Dummies.com, and related trade dress are trademarks or registered trademarks of John Wiley & Sons, Inc., and/or its affiliates in the United States and other countries, and may not be used without written permission. Crystal Reports is a regis-tered trademark of Seagate Software, Inc. All other trademarks are the property of their respective owners. Wiley Publishing, Inc., is not associated with any product or vendor mentioned in this book.
LIMIT OF LIABILITY/DISCLAIMER OF WARRANTY: THE PUBLISHER AND THE AUTHOR MAKE NO REP-RESENTATIONS OR WARRANTIES WITH RESPECT TO THE ACCURACY OR COMPLETENESS OF THE CON-TENTS OF THIS WORK AND SPECIFICALLY DISCLAIM ALL WARRANTIES, INCLUDING WITHOUT LIMITATION WARRANTIES OF FITNESS FOR A PARTICULAR PURPOSE. NO WARRANTY MAY BE CRE-ATED OR EXTENDED BY SALES OR PROMOTIONAL MATERIALS. THE ADVICE AND STRATEGIES CON-TAINED HEREIN MAY NOT BE SUITABLE FOR EVERY SITUATION. THIS WORK IS SOLD WITH THE UNDERSTANDING THAT THE PUBLISHER IS NOT ENGAGED IN RENDERING LEGAL, ACCOUNTING, OR OTHER PROFESSIONAL SERVICES. IF PROFESSIONAL ASSISTANCE IS REQUIRED, THE SERVICES OF A COMPETENT PROFESSIONAL PERSON SHOULD BE SOUGHT. NEITHER THE PUBLISHER NOR THE AUTHOR SHALL BE LIABLE FOR DAMAGES ARISING HEREFROM. THE FACT THAT AN ORGANIZATION OR WEBSITE IS REFERRED TO IN THIS WORK AS A CITATION AND/OR A POTENTIAL SOURCE OF FUR-THER INFORMATION DOES NOT MEAN THAT THE AUTHOR OR THE PUBLISHER ENDORSES THE INFOR-MATION THE ORGANIZATION OR WEBSITE MAY PROVIDE OR RECOMMENDATIONS IT MAY MAKE. FURTHER, READERS SHOULD BE AWARE THAT INTERNET WEBSITES LISTED IN THIS WORK MAY HAVE CHANGED OR DISAPPEARED BETWEEN WHEN THIS WORK WAS WRITTEN AND WHEN IT IS READ. For general information on our other products and services or to obtain technical support, please contact our Customer Care Department within the U.S. at 800-762-2974, outside the U.S. at 317-572-3993, or fax 317-572-4002.
Wiley also publishes its books in a variety of electronic formats. Some content that appears in print may not be available in electronic books.
Library of Congress Control Number: 2004104560 ISBN: 0-7645-7137-0
Manufactured in the United States of America 10 9 8 7 6 5 4 3 2 1
Many people have contributed to the quality and content of this book. I would particularly like to recognize Jaylene Crick of Business Objects for her help-fulness, my acquisitions editor, Terri Varveris, for her overall management of the project, and my editor, Nicole Sholly, for keeping me honest.
Some of the people who helped bring this book to market include the following:
Acquisitions, Editorial, and Media Development
Associate Project Editor:Nicole Sholly Acquisitions Editor:Terri Varveris Senior Copy Editor:Barry Childs-Helton Technical Editor:Wiley-Dreamtech India Pvt Ltd Editorial Manager:Kevin Kirschner
Media Development Manager: Laura VanWinkle
Media Development Supervisor: Richard Graves
Editorial Assistant:Amanda Foxworth
Cartoons:Rich Tennant, www.the5thwave.com
Composition
Project Coordinator: Courtney MacIntyre Layout and Graphics: Andrea Dahl,
Carrie Foster, Denny Hager, Joyce Haughey, Kristin McMullan, Lynsey Osborn, Heather Ryan Proofreaders: Andy Hollandbeck,
Carl William Pierce;
TECHBOOKS Production Services Indexer: TECHBOOKS Production Services
Publishing and Editorial for Technology Dummies
Richard Swadley,Vice President and Executive Group Publisher Andy Cummings,Vice President and Publisher
Mary C. Corder,Editorial Director Publishing for Consumer Dummies
Diane Graves Steele,Vice President and Publisher Joyce Pepple,Acquisitions Director
Composition Services
Introduction ...1
Part I: Reporting Basics ...7
Chapter 1: Transforming Raw Data into Usable Information...9
Chapter 2: Create a Simple Report Right Now! ...17
Chapter 3: Report Design Guidelines...33
Chapter 4: Reporting Overview ...43
Part II: Moving Up to Professional Quality Reports ...55
Chapter 5: Pulling Specific Data from a Database ...57
Chapter 6: Sorting, Grouping, and Totaling Result Sets ...73
Chapter 7: Mastering Report Sections...93
Chapter 8: Formatting Your Reports...111
Part III: Advanced Report Types and Features ...131
Chapter 9: Displaying Your Favorite Hit Parade with Group Sort...133
Chapter 10: Making Correlations with Cross-Tab Reports...149
Chapter 11: Adding Formulas to Reports...161
Chapter 12: Creating Reports within a Report ...181
Chapter 13: Combining Report Elements with OLE ...195
Chapter 14: Creating and Updating OLAP Reports ...201
Chapter 15: Enhancing Reports with Charts ...211
Chapter 16: Adding Geographic Detail with Maps ...235
Part IV: Crystal Reports in the Enterprise ...245
Chapter 17: Crystal Enterprise Components ...247
Chapter 18: Crystal Repository ...269
Chapter 19: Maintaining Security ...279
Chapter 20: Navigating with Report Parts...285
Chapter 21: Crystal Analysis 10...295
Part V: Publishing Your Reports...305
Chapter 22: Distributing and Viewing Reports ...307
Chapter 23: Displaying Reports Online ...311
Chapter 26: Ten Ways to Give Your Reports More Pizzaz ...331
Introduction...1
About This Book...1
Conventions Used in This Book ...2
What You’re Not to Read...2
Foolish Assumptions ...2
How This Book Is Organized...3
Part I: Reporting Basics ...3
Part II: Moving Up to Professional Quality Reports ...3
Part III: Advanced Report Types and Features ...3
Part IV: Crystal Reports in the Enterprise ...4
Part V: Publishing Your Reports...4
Part VI: The Part of Tens ...4
About the Web Site...5
Icons Used in This Book...5
Where to Go from Here...5
Part I: Reporting Basics...7
Chapter 1: Transforming Raw Data into Usable Information . . . .9
Major Features of Crystal Reports 10...10
Formatting a report...10
Enhancing a report with formulas and custom functions...11
Getting visual with charts and maps ...11
Displaying a report...11
Distributing a report ...12
Supplying Crystal Reports with data ...12
The Four Editions of Crystal Reports 10...12
The Standard Edition ...13
The Professional Edition ...13
The Developer Edition ...13
The Advanced Edition ...14
Viewing a Report ...14
Reading a printed report ...14
Viewing a report with Crystal Reports ...14
Chapter 2: Create a Simple Report Right Now! . . . .17
Starting Crystal Reports 10...18
Creating a Report with the Blank Report Option...19
Allocating more space to the layout ...22
Giving the report a title ...23
Choosing the fields that will appear in your report...25
Improving the readability of page headers ...26
Previewing the report ...27
Page footers carry useful information ...29
Wrap things up with a report footer ...30
Recording helpful information about your report ...31
Troubleshooting a Report That Doesn’t Look Quite Right ...32
Printing a Report ...32
Chapter 3: Report Design Guidelines . . . .33
Audience...33
Purpose ...34
Content ...35
Interfacing the Report to a Database...35
Connecting to Microsoft Access...36
Connecting to other data sources...37
What Should the Report Look Like? ...38
Making a good first impression ...39
Deciding how best to present the information...39
Should the report include graphs, charts, or pictures? ...40
Style communicates meaning, too ...40
Does the report convey the message?...41
Chapter 4: Reporting Overview . . . .43
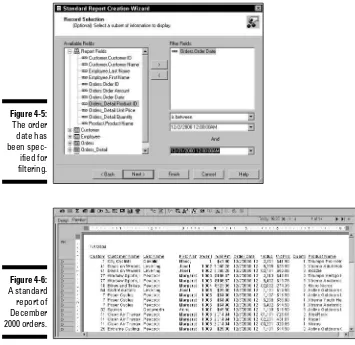
Creating a Report with Report Creation Wizard ...43
Creating a standard report...44
The rest of the Report Creation wizards ...49
Starting with a Blank Report...49
Connecting Your Report to Its Data Source...50
Accessing database files directly ...51
Linking to ODBC data sources ...51
Retrieving data from Crystal SQL Designer files ...52
Reporting on data in OLE DB data sources...53
Creating customized data access with Crystal Dictionaries ...53
Part II: Moving Up to Professional Quality Reports ...55
Chapter 5: Pulling Specific Data from a Database . . . .57
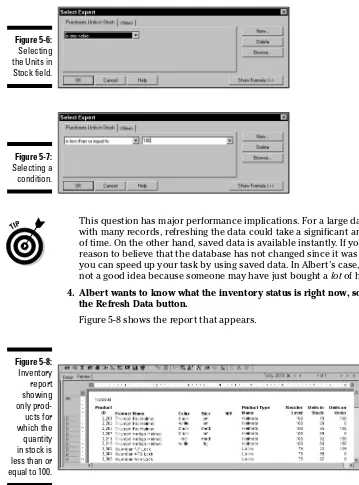
Get Data Quickly with Select Expert...57
Using Formulas to Retrieve Data...63
Using Parameter Fields to Retrieve Data at Runtime ...65
Troubleshooting Tips ...71
Chapter 6: Sorting, Grouping, and Totaling Result Sets . . . .73
Sorting Report Data ...73
Sorting based on multiple fields...75
Sorting and performance...78
Grouping Related Items...79
Calculating Percentages ...82
Drilling Down for Detail ...84
Keeping Track of Things with Running Totals...86
Troubleshooting Sorting, Grouping, and Totaling Problems...90
Sorting problems and how to solve them ...90
Unusual grouping options ...91
Getting the right totals ...92
Chapter 7: Mastering Report Sections . . . .93
Changing the Size of a Section...93
Vertical spacing between lines ...93
The Section Formatting menu ...96
Common tab of Section Expert...98
Color tab of Section Expert ...100
Placing Groups Where You Want Them...103
Starting each group at the top of its own page ...103
Printing totals at the bottom of a page...104
Restarting page numbering at the beginning of each group...105
Hiding Details with Summary and Drill-Down Reports ...105
Creating Mailing Labels ...106
Saving Money on Postage by Doing a Zip Sort ...109
Chapter 8: Formatting Your Reports . . . .111
Absolute Formatting and Conditional Formatting ...111
Absolute formatting overview ...112
Conditional formatting ...116
Adding Pictures to a Report ...119
A Trick for Aligning Preprinted Forms ...120
Adding Text from a File ...121
Formatting Options...121
Special Fields Contain Report Metadata ...123
Raising a Red Flag with Report Alerts ...123
Report Templates Save Time and Effort ...127
What’s a template? ...127
How do you use a template in a report?...127
Applying a template to an existing report...128
Applying a template to a report you’re creating ...129
Part III: Advanced Report Types and Features ...131
Chapter 9: Displaying Your Favorite Hit Parade with Group Sort . . .133
Sorting Groups Based on Performance ...133
Going with the Percentages ...142
What if you want the top seventeen instead of the top five? ...144
A Choice of Group Sorts...146
Troubleshooting Group Sort Problems ...147
Chapter 10: Making Correlations with Cross-Tab Reports . . . .149
Creating a Cross-Tab Object to Summarize All Report Data ...149
Summarizing the Contents of a Group with a Cross-Tab ...153
Enhancing the Appearance and Readability of a Cross-Tab Object ...157
Changing the width and height of cross-tab cells ...158
Formatting entire rows and columns...158
Formatting individual fields ...159
Suppressing selected cross-tab data ...159
Printing cross-tabs that span multiple pages ...160
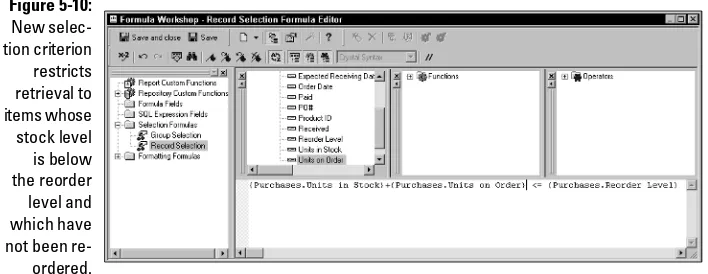
Chapter 11: Adding Formulas to Reports . . . .161
Formula Overview and Syntax ...161
Lessening the Workload with Functions ...162
Creating a Custom Function Using Formula Workshop ...162
Formula Editor ...165
Formula Expert ...166
SQL Expression Editor ...168
Selection formulas...169
Formatting formulas...171
Changing and Deleting Formulas ...172
Data Types ...173
Simple data types ...173
Range data types ...175
Variables in Formulas ...176
Declaring a variable ...176
Assigning a value to a variable ...176
Control Structures...177
If-Then-Else...177
Select Case ...178
For loop...178
While Do loop ...179
Do While loop ...180
Chapter 12: Creating Reports within a Report . . . .181
Combining Unrelated Reports ...181
Underlay formatting for side-by-side location of subreport...185
Drilling down in a subreport ...186
Linking a Subreport to a Primary Report...187
On-Demand Subreports Boost Efficiency...191
Passing Data Between Reports...192
Troubleshooting Subreport Problems...193
Chapter 13: Combining Report Elements with OLE . . . .195
Overview of OLE...195
Static OLE objects ...196
Embedded objects and linked objects ...196
Embedding or Linking a File as an OLE Object ...197
Embedding or Linking an Object Taken from a File ...199
Editing OLE Objects ...199
Chapter 14: Creating and Updating OLAP Reports . . . .201
What’s OLAP, and Why Might I Need It?...201
Who uses OLAP?...201
Creating multidimensional views ...202
OLAP Reporting with Crystal Reports ...203
Creating a three-dimensional report...203
Updating an OLAP report ...209
Chapter 15: Enhancing Reports with Charts . . . .211
Choosing the Best Chart Type for Your Data ...211
Side-by-side bar chart ...211
Stacked bar chart ...213
Line chart ...213
Area chart...213
Pie chart ...214
Doughnut chart...215
3-D riser chart ...216
3-D surface chart ...216
Radar chart ...217
Bubble chart ...218
Stock chart ...218
Numeric axis chart ...219
Gauge chart ...221
Gantt chart ...221
Funnel chart ...222
Different Chart Layouts for Different Data Types ...223
A Chart’s Placement Affects the Data It Can Represent...224
Using Chart Expert...225
Whirlwind tour of the Chart Expert dialog box...225
Creating a chart ...229
Drilling down from a chart ...231
Changing a chart...232
Troubleshooting Chart Problems ...232
Selecting data to make a chart readable and meaningful ...232
The placement of chart elements matters ...233
Chapter 16: Adding Geographic Detail with Maps . . . .235
Crystal Reports Maps ...235
Map layouts...236
Map types ...236
Map placement ...238
Creating a Map Step by Step...238
Creating an advanced layout map...238
Creating a Group layout map ...240
Creating a Cross-Tab layout map ...241
Creating an OLAP layout map...242
Including maps in subreports...243
Changing maps ...243
Troubleshooting Map Problems...243
Part IV: Crystal Reports in the Enterprise ...245
Chapter 17: Crystal Enterprise Components . . . .247
Understanding Business Views ...247
The Three Muska-Tiers...248
Crystal Enterprise Admin Launchpad ...260
Crystal Enterprise User Launchpad ...263
Crystal Enterprise Web Desktop ...263
Crystal Configuration Manager ...264
Crystal Import Wizard ...265
Crystal Publishing Wizard...265
Chapter 18: Crystal Repository . . . .269
Storing Your Valuables in Crystal Repository ...270
Adding folders to your Repository ...270
Adding text and bitmapped objects to the Repository...270
Adding custom functions to the Repository...273
Adding SQL commands to the Repository...273
Using Repository Objects in a Report ...273
Modifying a Repository Object ...274
Updating Reports Automatically Using Connected Repository Objects ...275
Deleting Objects from the Repository...277
Chapter 19: Maintaining Security . . . .279
Restricting Access...279
Logon tokens...280
Sessions and session tracking ...280
Primary authentication...281
Secondary authentication and authorization...281
Protecting the environment ...282
Web activity auditing ...282
Combating malicious logon attempts ...282
Easing the Security Burden...283
Single Sign-On ...283
Active trust relationship...283
Controlling Access to Specific Reports ...283
Creating groups to control access ...283
Granting rights to control access...284
Chapter 20: Navigating with Report Parts . . . .285
Understanding Report Parts Navigation ...285
Using Report Parts to Navigate ...287
Using the Report Parts Drill-down method...287
Using the Another Report Object method ...293
Chapter 21: Crystal Analysis 10 . . . .295
Digging Deeper into OLAP...295
Creating a Crystal Analysis Report...296
Using a blank application ...296
Part V: Publishing Your Reports ...305
Chapter 22: Distributing and Viewing Reports . . . .307
Printing Your Report...307
Faxing a Report...308
Exporting a Report...309
Troubleshooting Output Problems ...310
Chapter 23: Displaying Reports Online . . . .311
Exporting to a Static HTML Page ...311
Adding a Hyperlink to a Report...314
Chapter 24: SQL Commands . . . .317
Creating an SQL Statement ...318
Adding an SQL Statement to a Repository...321
Modifying an SQL Statement...322
Part VI: The Part of Tens...325
Chapter 25: Ten Things to Do Before You Create a Report . . . .327
Identify the Users ...327
Interview the Users...328
Arbitrate Conflicting Demands...328
Nail Down the Project’s Scope...328
Nail Down the Project’s Schedule ...328
Verify That the Necessary Data Is in the Database...329
Determine How the Report Will Be Viewed ...329
Determine the Best Report Type for the Users’ Needs ...329
Get Agreement on the Report’s Appearance ...330
Decide Whether to Include Charts or Maps ...330
Chapter 26: Ten Ways to Give Your Reports More Pizzaz . . . .331
Use the Correct Fonts...331
Use Color Tastefully...332
Enclose Text in Boxes...332
Emphasize Objects with Drop Shadows...332
Produce a Consistent Appearance with Templates...333
Add an Image ...333
Add a Chart ...333
Add a Map ...333
Combine Two Objects with an Underlay...334
Separate the Summary from the Details with Drill-Down ...334
C
rystal Reports 10 is the latest in a long and celebrated series of report writers for personal computers. Crystal Reports is by far the best-selling report writer package in the world, even though you may have never heard of it. In the past, it has been bundled with many of the most popular applica-tions without being acknowledged by name. (A version of Crystal Reports is currently bundled into Microsoft’s Visual Studio .NET, and Crystal Reports 10 is sold as a standalone product.) If you want to produce a high-quality report quickly, Crystal Reports is the top choice to do the job.About This Book
Crystal Reports 10 For Dummiesis an introductory level book that gets you using Crystal Reports quickly and effectively. It covers all the major capabilities of Crystal Reports but doesn’t bog you down in intricate detail. The objective is to give you the information you need to produce the types of reports that most people need most of the time. I also get into some out-of-the-ordinary report types that you might be called upon to generate on occasion.
Use this book as a handy reference guide. Each chapter deals with an individ-ual feature that you may need at one time or another. Pull out the book, read the chapter, and then do what you need to do. In many cases, step-by-step procedures walk you through commonly needed operations. You might find it worthwhile to put the book beside your computer and perform the opera-tions as you read about them.
Conventions Used in This Book
When an instruction in the book says, for instance, File➪Save, it means to click the left mouse button on File in the main menu, and then click Save on the submenu that drops down from it.
Anything you see that is printed in a monospaced font is code, or something you’ll run across in the course of programming a database (field names, for example). This is a monospaced font.Crystal Reports executes code that you enter as formulas or SQL statements.
What You’re Not to Read
You can read the book through from cover to cover, working through the examples, although you don’t have to. Whether you read it all the way through or not, you can use it as a quick reference when you want to perform a partic-ular operation that you have not used in a while.
There’s another whole section of this introduction that explains the icons you’ll normally run across, and there is a good reason for paying attention to each of them. There is, however, one icon that you get to skip: Consider yourself exempted from the requirement to read anything that appears by a Technical Stuff icon.
Material next to one of these icons may be interesting to techies like me (there must be some of you out there) but generally is not necessary for a full under-standing of how to use Crystal Reports.
Foolish Assumptions
I’ve never met you, but because we’re going to be together for a while, I’ll make a few assumptions about you and what you know. I assume that you know how to use a personal computer and that you’re somewhat familiar with Microsoft Word. If you know how to navigate around Microsoft Word, you already know almost all there is to know about navigating around Crystal Reports. The user interfaces of the two products are similar.
sign to expand that node, to see what the node contains. Crystal Reports treats directory trees in a similar way.
I assume you know how to perform a drag-and-drop operation with your mouse. In Crystal Reports, when you click an object and start dragging it, your progress is shown by a rectangular placement frame. When you release the mouse button to drop the item, the placement frame is replaced by a duplicate of the item that you dragged.
How This Book Is Organized
This book contains six major parts. Each part contains several chapters.
Part I: Reporting Basics
Part I introduces you to Crystal Reports and the art of report creation. You find out what a report should accomplish and what it should look like. Then you fire up Crystal Reports and use it to create a simple report based on data held in a database.
Part II: Moving Up to Professional
Quality Reports
You can do many things beyond the basics to make reports more focused, more readable, and easier on the eye. This part gives you the information you need to do all those things.
Part III: Advanced Report
Types and Features
Part IV: Crystal Reports in the Enterprise
Crystal Enterprise is a companion product to Crystal Reports that controls and secures the distribution of reports. With it you can make your reports accessible to people on your local area network, or on the World Wide Web. Crystal Enterprise’s new Business Views capability enables report developers to custom tailor a report based on the interests of the people who will be viewing it. There can be multiple different Business Views of a single report. Crystal Enterprise is also the home of the Crystal Repository, which is a great place to store formulas, custom functions, or Business Views, so they can be used again later.Part V: Publishing Your Reports
After you create a report, you’ll want to make it available to the people who need it. Crystal Reports makes it easy for you to distribute your report for viewing, whether to colleagues in your organization or to Internet users around the world. In addition, you can publish your reports using traditional meth-ods. You can print it; export it to a file, or fax it to people far away. After you complete report development, distribution is easy.
Although Crystal Reports does a great job when used all by itself, you can also incorporate it into applications written in a computer language. Crystal Reports’ SQL Commands facility gives you direct control over the data in a report’s underlying database. Because a version of Crystal Reports is included as an integral part of Microsoft’s .NET application development environment, you can incorporate the power of Crystal Reports into applications you write in Visual Basic, Visual C++, Visual C#, or any language compatible with the .NET framework. This gives the applications you write the sophistication of the world’s leading report writer.
Part VI: The Part of Tens
About the Web Site
This book has an accompanying Web site where you can find sample reports from the book, some exercises related to the sample reports, and links to sites for related information. To access the Web site, go to www.dummies.com/go/ crystalfd.
Icons Used in This Book
Tips save you a lot of time and keep you out of trouble.
Pay attention to the information marked by this icon — you may need it later.
As mentioned earlier, Technical Stuff is detail that I find interesting and you may also. But if you don’t, no big deal. It is not essential to gain an under-standing of the topic being discussed. Skip it if you like.
Heeding the advice that this icon points to can save you from major grief. Ignore it at your peril.
Where to Go from Here
T
here’s data in the database, where it’s not doing anyone any good. Your manager wants coherent infor-mation, based on that data, on her desk by the close of business today. What should you do? Panic? Consider joining the Foreign Legion?Transforming Raw Data
into Usable Information
In This Chapter
䊳Outlining the major features of Crystal Reports 10
䊳Discussing the four editions
䊳Viewing an existing report
C
omputers can store and process enormous amounts of data, and with the relentless advance of technology, those capabilities will soon become even more mind-boggling. Even now, the major challenge of getting value from computer systems is not to make them more powerful but to harness the power they already have — in a way that delivers useful information to people.Megabytes or gigabytes of raw data are neither meaningful nor useful to people. Instead, we need organized information, distilled and focused on answering specific questions. In businesses and enterprises of all kinds, orga-nizing and presenting information has traditionally been the job of documents called reports.These documents generally consist of multiple pages that can include text, numbers, charts, maps, and illustrations. The best reports convey the facts needed to make the best decisions, unobscured by a clutter of data irrelevant to the task at hand.
Major Features of Crystal Reports 10
Crystal Reports 10 includes all the features that made Crystal Reports 9 a worldwide best-seller, plus exciting new features that save you time and effort as you develop your reports. Crystal Reports 10 is tightly integrated, so all the individual components of the system work together seamlessly to support the creation, modification, distribution, and viewing of reports. The tight inte-gration extends beyond Crystal Reports 10 to Crystal Enterprise 10, making the sharing of reports across large enterprises not just feasible, but downright convenient.Data Explorer and Report Experts provide highly intuitive visual tools that step you through the process of creating a report. Features such as the Crystal Repository (which now can be shared across the enterprise) and report tem-plates allow users throughout the organization to reuse components or entire reports. There is never any need to reinvent the wheel. If a component in the Repository or a report template comes close to meeting your requirements but doesn’t meet them exactly, you can make minor modifications and have a usable report quickly — a vast improvement over creating an equivalent component or report from scratch.
Formatting a report
The primary job of a report writer such as Crystal Reports is to take data from a database and put it into a pleasing, logical, and understandable format for view-ing by users. With Crystal Reports, you are well equipped to give your reports the appearance you want — without having to become a formatting guru.
Crystal Reports offers both absolute and conditional formatting:
⻬Absolute formattingenables you to put text, titles, charts, maps, columns of figures, cross-tabs, and graphics pretty much anywhere you want on the screen. You can handle preprinted forms. You can optimize for screen display or for printing on paper. This is close to the ultimate freedom in report creation — but not quite.
⻬Conditional formattingtakes you one step further toward the ultimate: Using it, you can change the format of the data you’re displaying in response to the content of the data itself. With conditional formatting, every time the data in a report changes, a formula that you include in the report can make the appearance of the report change accordingly.
Format Painter is a new feature of Crystal Reports 10. It saves you a lot of work if you have numerous objects in a report that all require the same for-matting. You simply format the first of those objects and then — with one click — “clone” that formatting onto another object.
Another labor-saving feature is the Template Expert, which enables you to create and save a report template for later use. Imagine how much time you’ll save if you have to quickly format multiple reports with a common look.
Enhancing a report with formulas
and custom functions
Did I mention that conditional formatting makes use of formulas to change the format of a report? Well, you can use formulas for far more than that. A formula is like a little computer program that can do computations or other manipulations of data before displaying the result. This makes Crystal Reports more than merely a report writer that puts your data in a nice format. By using formulas, you can make it select specific records (or groups of records) and display them the way you want, controlling that process by declaring and using variables in your formulas. All the common flow-control structures (If-Then-Else, Select Case, For, While Do, and Do While) are available.
After you create a useful formula that you might want to use again later, you can save it as a custom function. Custom functions are added to the standard functions that come with Crystal Reports, keeping them available in one place.
Getting visual with charts and maps
Crystal Reports has excellent capabilities for the graphical display of data. All the most commonly used chart types are available, so you can display your data in the most meaningful way. If you have geographical data, Crystal Reports can display it in maps that show countries, regions, provinces, or cities. A variety of methods are available to associate values with specific regions, including colors, symbols of various sorts, and even charts.
Displaying a report
old-fashioned way, printing them on paper and putting them on the target readers’ desks.
Distributing a report
You can get your report into the hands of its intended recipients in many ways — print it and deliver it by hand, fax it directly from your computer to a fax machine anywhere in the world, or export the report to a file.
If you choose the latter approach, Crystal Reports supports many output file formats, including HTML for viewing over the Web. At least one of these for-mats is bound to be readable by the people in your audience. The one caveat here is that if you export a report to any format other than the Crystal Reports native format (.rpt), you may lose some of the report’s formatting in the process. You can even export directly to an application such as Microsoft Word or Lotus Domino. In such a case, Crystal Reports launches the target application and opens your report in it.
A major new distribution mechanism in Crystal 10 is the Business Views fea-ture (actually a component of Crystal Enterprise, a companion product to Crystal Reports that enables users on client machines to view, schedule, and keep track of published reports). As discussed in Chapter 17, Business Views offer a new data-abstraction layer that simplifies the process of connecting to enterprise data sources. At that layer, you can combine data from multiple data sources of different kinds into a single data source.
Supplying Crystal Reports with data
As important as the output formats of a report are, the inputs to the report are equally important. Crystal Reports shines in this area too. It accepts data from a wide variety of data sources, including both personal computer databases such as Microsoft Access and enterprise-wide client/server databases such as Oracle, IBM’s DB2, and Microsoft’s SQL Server. In fact, Crystal Reports can accept data from any ODBC-compliant database or any data source that complies with Microsoft’s OLE DB standard. Essentially, if your data exists in a commonly used modern data source, Crystal Reports can use it.
The Four Editions of Crystal Reports 10
Crystal Reports 10 comes in four editions that differ in their target audiences and their capabilities. The four editions are the Standard Edition, theThe Standard Edition
The Standard Edition of Crystal Reports 10 is the least capable of the four, but that is not to say that it is deficient in any way. It is designed to be used by business professionals rather than information technology professionals. The Standard Edition contains nearly all the functionality I cover in this book. Rather than try to enumerate the features it contains, I’ll save a lot of space by listing the few things it doesn’t do:
⻬It won’t create reports designed to be displayed on the Web. If you intend to develop reports for display on the Web, you need at least the Professional Edition.
⻬It won’t integrate reports into application programs. Because the target audience for the Standard Edition consists of people who are not typically programmers, application integration tools would be more confusing than useful.
⻬It won’t support XML or OLAP (discussed in Chapter 14), and it doesn’t include the Repository (covered in Chapter 18).
⻬It doesn’t include native drivers for client/server databases such as Oracle, DB2, Hyperion Essbase, and SQL Server. If you want to draw data from those databases, use ODBC or move up to the Professional Edition.
The Professional Edition
The Professional Edition is aimed at IT and MIS professionals, such as database administrators, report designers, and systems analysts. It’s the product you need to publish reports on the Web. It also gives you more flexibility in using SQL than the Standard Edition does. The Professional Edition also allows you to draw data from client/server databases. The Repository is available in the Professional Edition and above.
The Developer Edition
The Developer Edition is for guru-class, heavy-duty application developers. It is designed to be used by programmers who want to incorporate reports in the applications they develop.
The Advanced Edition
The Advanced Edition is targeted at people who want to develop Enterprise Web applications using Java, COM, or .NET. It has essentially the same func-tionality as the Developer Edition, but it also has a license structure that accommodates more simultaneous users. People who receive Crystal Reports .NET as a part of Visual Studio .NET may want to upgrade to the Advanced Edition of Crystal Reports 10 when they’re ready to deploy their applications on the Web.
Viewing a Report
The majority of this book tells you how to create a new report from data in a database file, using Crystal Reports. It also tells you how to modify a report so you can create a new report (similar to, but distinct from, the existing one). These are concerns of the report designer. But what if you just want to viewa report that has already been designed?
The world has many more people viewing reports than creating such reports. You may be one of the former. No problem. Before I launch into telling you how to create reports in subsequent chapters of this book, I briefly describe the simple process of viewing reports that already exist.
Reading a printed report
Reading a report that you had Crystal Reports print on paper is the simplest (but also the most limited) way to get the information you want. It doesn’t take a lot of technical sophistication to read text and view charts and maps on a sheet of paper. People were doing so long before computers came along.
For some kinds of information, however, printed reports are not as valuable as those you can view online. Printed reports are not updated when the data-base from which they were derived is updated. They may contain obsolete — thus misleading — information. This is a factor you must always bear in mind when basing decisions on printed reports.
⻬The report is connected to the source database while the report is being viewed.That’s an obvious advantage. If the data in the database has changed since the last time you viewed it, you can refresh the report before you view it again by pulling current information from the data-base. Crystal Reports automatically checks the database to see whether it has been updated since the last time your report was run. If so, it asks whether you want to refresh the report with current data.
⻬You can use the drill-down capability of Crystal Reports to selectively view the detail underlying summary reports.This enables you to get an overview of the subject by viewing the summary, and then drill down into the specific parts that interest you for more detail. (For more on drill-down, see Chapter 6.)
⻬Viewing a “live” report gives you access to the way Crystal Reports uses hyperlinks.You can follow a hyperlink from one part of a report to another part, from one report to another report on the same computer, or from one report to a report on another computer on your network.
⻬You can view reports that include color graphics or text that uses font colors other than black.For the many people who don’t have high-speed color printers, this provides a way to access the full richness of a report’s contents.
To view an existing report on a computer that has Crystal Reports installed on it, follow these steps:
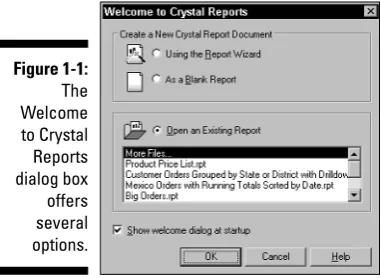
1. Launch Crystal Reports from your computer’s Start menu.
Crystal Reports appears, displaying the Welcome to Crystal Reports dialog box, as shown in Figure 1-1. You can choose to create a new report or open an existing report. The dialog box lists several existing reports that may be on your system, or gives you the option of looking at more report files if you don’t see the one you want in the list.
2. Select the report that you want to view and click OK.
If you don’t see the report you want, click More Files, click OK, and use the Open dialog box to select any report available on the system.
Crystal Reports retrieves and displays the report, as shown in Figure 1-2.
3. Move through the report.
Scroll around the report, and move back and forth among its pages. You can drill down into any summary report that supports drilldown. If the report contains hyperlinks, you can follow them to other locations in the report or in other reports
4. When you are finished viewing the report, choose File➪Close to close it.
Viewing a report on your local
area network or the Web
The Crystal Enterprise Web Desktop can display your reports to thousands of users on your local area network, or millions of users on the World Wide Web. Whether your users are on a local area network that’s directly con-nected to a server running the administrative part of Crystal Enterprise, or on a remote connection via the Web, they can use the Crystal Enterprise Web Desktop to access the reports they need. The user interface is a standard Web browser, such as Internet Explorer or Netscape.
Figure 1-2:
Create a Simple Report
Right Now!
In This Chapter
䊳Starting the program
䊳Creating your first report
䊳Troubleshooting your report
䊳Printing your report
W
hen you start Crystal Reports, generally you want to do one of three things: create a report, modify a report, or run a report against the data in your database. Reports take data from a database, process it, format it, and then output it to a printer, computer screen, or Web site.Crystal Reports comes with a sample database you can use for practice. It’s a Microsoft Access database for a fictitious company named Xtreme Mountain Bikes Inc. You might be able to buy one of their fictitious bikes with fictitious money, if you ever find a fictitious bike shop — and the Treasury Department doesn’t nab you first.
The xtreme.mdbdatabase contains a number of database tables that are rep-resentative of the tables a real bike manufacturer might maintain. The tables are filled with sample data that you can manipulate and display with Crystal Reports. You can use this sample data as the basis for your first report.
To create a report, you need to know a few things:
⻬Which tables in the database contain the data you want
⻬Which data items you want in those tables
⻬What manipulations of the data must be performed to give you the infor-mation you want
⻬How you want your report to be formatted
For the purposes of this introduction (and for now), imagine you already know all those things.
Starting Crystal Reports 10
You’ve probably chosen Crystal Reports because you have a database that contains information that’s important to you. In all likelihood, the data in that database changes with time, and you want to be able to keep up with its current status. You couldretrieve the information you want by making SQL queries, but that would be too much like work. It’s far better to create a report with Crystal Reports, and then run the report whenever you want the latest status of the information of interest. You have to create the report only once, but you can run it many times, getting the latest results with each successive run. You don’t have to learn SQL or any other method of pulling data out of databases. Reports created with Crystal Reports are easy to build, easy to read, and easy to understand. What could be better?
SQL is the international standard language for communicating with databases. It differs from most common computer languages in that it’s nonprocedural. It deals with data a set at a time rather than a record at a time. Database devel-opers use SQL. If you’re a database user (rather than a developer), Crystal Reports may give you everything you need to get what you want out of your databases.
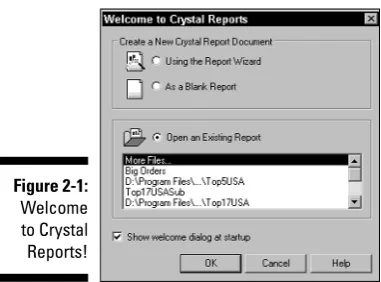
The first step to creating a report is to launch Crystal Reports from the Windows Start menu. When you do, the Crystal Reports main window appears, displaying the dialog box shown in Figure 2-1.
Figure 2-1:
Welcome to Crystal
You are invited to choose from three options. You can create a Crystal Reports document using Report Wizard or by starting with a blank report. Alternatively (as I demonstrate in Chapter 1), you can open a report that already exists, either to change it or to run it.
Although Report Wizard can be a time- and labor-saver, it does constrain the form of the report. So this chapter takes you right to the point and shows you how to create a report yourway, starting from a blank report instead of using Report Wizard.
Creating a Report with the
Blank Report Option
To create a report from scratch, starting with the blank report option, follow these steps:
1. Start Crystal Reports.
The Welcome to Crystal Reports dialog box appears.
2. Select the As a Blank Report option, and then click the OK button.
The Database Expert dialog box appears, as shown in Figure 2-2.
Figure 2-2:
3. In the Available Data Sources pane, click the plus sign to the left of the Create New Connection folder to expand it.
This is the folder you choose whenever you’re creating a report from scratch. When you have connected to a database, Crystal Reports remembers where it is.
4. Double-click the database type that matches your data source.
Crystal Reports recognizes a variety of different database types. You must select the right one. If you don’t know which type is correct, ask someone familiar with the data source. To follow along with the example, double-click Access/Excel (DAO). The Access/Excel (DAO) dialog box appears, as shown in Figure 2-3.
5. Click the ellipsis (...) button to the right of the Database Name box.
The Access and Excel files on your system appear. For the example, I selected an Access database file named xtreme. This may not be as easy as it sounds. Mine was located at D:\Program Files\Crystal Decisions\Crystal Reports 10\Samples\En\Databases\ xtreme.mdb.
You may have to browse to find this file on your system.
6. Click the Finish button.
Database Expert reappears, as shown in Figure 2-4, with the xtreme data-base connected.
7. Expand the Tables node, and then double-click the table on which you want to base your report.
Figure 2-3:
The tree in the Available Data Sources pane consists of a number of nodes, some of which branch off from others. Every data source has four of these nodes branching off from it: Add Command, Tables, Views, and Stored Procedures.
8. To follow along with the example, expand the Tables node and then double-click Product.
Doing so copies the Product table from the Available Data Sources pane to the Selected Tables pane.
9. Click the OK button to close Database Expert.
A blank report fills the window, as shown in Figure 2-5.
Figure 2-5:
A blank report.
Figure 2-4:
The Design tab (on the left edge) shows five sections of the report:
⻬Report Header:Appears only at the top of the report and is the first thing that a viewer sees.
⻬Page Header:Appears below the report header and at the top of all the other pages in the report.
⻬Details:The actual content of the report.
⻬Report Footer section:Appears after the last detailed information in the report.
⻬Page Footer:Appears at the bottom of every page of the report.
Allocating more space to the layout
Depending on the resolution of your computer screen, the Crystal Reports window may not display the full width of your report. You can give yourself a little more width in the display by changing one of the display options. Follow these simple steps:
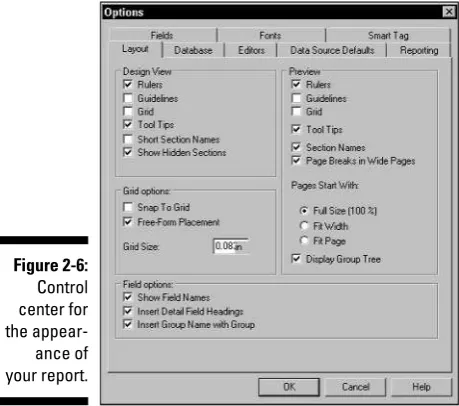
1. Choose File➪Options.
The Layout tab of the Options dialog box appears, as shown in Figure 2-6.
Figure 2-6:
2. In the Design View section, click to select the Short Section Names option.
This reduces the section names on the left edge of the window to one- or two-letter abbreviations, freeing up a little horizontal real estate.
3. Click the OK button.
4. Drag the left edge of the Field Explorer farther to the right, to allocate more horizontal space to the work area.
You can now view more of the report without resorting to horizontal scrolling.
Giving the report a title
The Report Header area (at the top of the first page of the report) is the ideal place to tell the reader exactly what the report contains. However, this forces you, right here at the beginning, to decidewhat the report is to contain. No problem: Start by considering who your target audience is and what they want to know.
If you are Xtreme Mountain Bikes, the target audience for your Products report is potential customers. They surely will want to know what products you carry, including information on color and size, where appropriate. They probably also want price information. They’ll also need to know the stock number of an item so they can specify it properly when they decide to purchase a bike.
Placing your company logo in the report header also makes sense. The Xtreme logo is not available conveniently on the Crystal Reports distribution CD. For the purposes of this demonstration, any logo-sized image file will do. You can add one to the report header along with a title, such as Product Price List.
To add a logo to a report, do the following:
1. Dismiss Field Explorer, if necessary, by clicking the X in its upper-right corner.
2. With the Design tab selected, click the Insert Picture icon in the Insert toolbar.
A dialog box appears, displaying the image files in the Databases folder. There were no image files in my database folder, so I looked around for a substitute. I found one here:
E:\Program Files\Crystal Decisions\Crystal Reports
Wow! That is one long URL. Perhaps you’ll find a suitable image some-where else. Your organization’s own logo would do fine.
3. Click the picture’s filename to select it (an outline of the logo appears on the report layout), place it in the upper-left corner of the report header with the mouse, and then click to fix it in place.
Figure 2-7 shows the result.
My substitute logo was mlb.bmp. It is a baseball logo. I have loved base-ball ever since I played in the farm league in Belleville, New Jersey. I played in the farm league almost my whole career, only moving up to Little League a few weeks before I became too old to play in Little League any more. You can use whatever you want for your substitute logo.
You can find out the names of the toolbar icons such as the Insert Picture icon by hovering the cursor over them. After a few seconds, a tooltip appears, telling you the name of the tool you’re looking at.
Next, you put a report title into the Report Header section as well. To do this, you will have to use several of the tools in the Insert toolbar.
1. Pull down the dividing line between the Report Header section and the Page Header section so that you can place the report title below the level of the logo.
To pull down a dividing line, hover the cursor over it until the cursor changes shape, depress the left mouse button and drag the line to the position you want it to be in, and then release the mouse button.
2. Click the Insert Text Object icon in the Insert Tools toolbar.
A text object rectangle appears.
3. Drag the rectangle into the Report Header section, and drop it.
To drag and drop the rectangle: Put the mouse pointer over the rectangle, press and hold down the mouse button to select it, move it to the desired location, and then release the mouse button to drop the rectangle. A text cursor starts to blink inside the rectangle.
Figure 2-7:
4. At the blinking cursor’s location, type the report title.
For the example, type Product Price List.
5. Select the title you just typed, and then increase its size by clicking the Increase Font Size icon.
6. Make the title bold by clicking the Bold icon.
7. Move the left and right edges of the text object to the left and right edges of the report, respectively, and then click the Align Center icon to locate the title in the center of the page.
At this point, your report should look similar to Figure 2-8.
Choosing the fields that will
appear in your report
The next logical step is to place in the Details section the fields you want the report to display. Simply follow these steps:
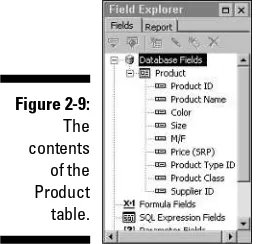
1. If the Field Explorer is not currently visible, display it by clicking View➪Field Explorer on the main menu.
2. In Field Explorer, click the plus sign to the left of Database Fields; click the plus sign to the left of Product to display its fields (because the Product table is the only available data source, it is the only one listed).
Field Explorer displays the fields in the Producttable, as shown in Figure 2-9.
3. Click the first field that you want to include in the report, and then drag it to the left edge of the Detail section.
For the example, click the Product IDfield. When you drag the field, a rectangle appears. The field name appears in the rectangle in the Detail section and also above it in the Page Header section. Later, you may want to change the column titles in the Page Header section for cosmetic rea-sons. For now, just leave the default column titles.
Figure 2-8:
4. Repeat Step 3 for any other fields that you want to include in the report.
For the example, place the Product Name, Color, Size, and Price (SRP)fields in order in the Detail section, leaving just a little space between them.
Crystal Reports 10 automatically adjusts the fields displayed to match the field sizes you chose, and spaces them out proportionally. You can manually adjust the field sizes by grasping the handles on the left and right edges of the fields and moving them. You can resize the fields and move them back and forth until you arrive at a good balanced appear-ance. At this point, your report layout should look similar to the one shown in Figure 2-10.
Improving the readability of page headers
Everything in the Page Header section appears just below the Report Header on the first page of the report and at the top of all following pages. By default, the field names in the Page Header section are displayed in a normal font andFigure 2-10:
All fields have been placed in the Detail section.
Figure 2-9:
The contents
underlined. I think they’d look better in a bold font and not underlined, so I select the Bold attribute for each of them and deselect the Underline attribute. I’ll wait to see what the report looks like before deciding whether I want to change the font size as well. Figure 2-11 shows the layout with the enhanced column headings.
Previewing the report
So far, you’ve been able to see the layout of your report only in the sectioned structure of Design mode. To get a better idea of what the report looks like at this point, you can switch to Preview mode. To do so, click the Print Preview icon in the Standard toolbar. This displays the Preview tab in the upper-left corner of the work area and displays the report, complete with data pulled from the Products table. Figure 2-12 shows as much of the report as the screen can hold.
Figure 2-12:
A preview of the Product Price List report.
Figure 2-11:
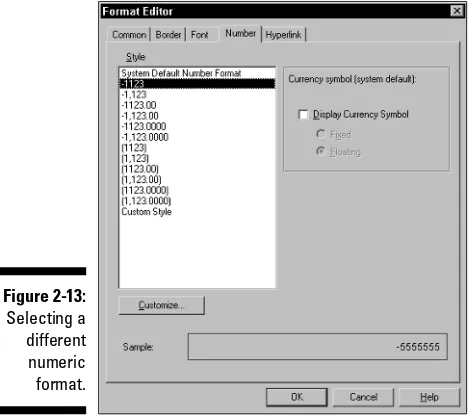
You can notice a couple of things about the report at this point. First, Crystal Reports apparently automatically inserts commas between groups of three digits in number fields, such as the Product ID field. This is not what you want. Second, the color attribute must not apply to gloves because no color information is shown for the glove products that we can see.
The fact that gloves have no color is not a problem, but the comma in the middle of the Product ID is a problem. You can correct this as follows:
1. Click the Design tab to return to Design mode.
2. In the Details section, select the field whose number format you want to change.
For the example, select the Product ID field.
3. Choose Format➪Format Field.
Format Editor appears.
4. Click the numeric format that you want, and then click the OK button.
For the example, you want the format with no commas, as shown in Figure 2-13. This changes the format of the Product ID field to eliminate the unwanted commas.
You can verify the change by returning to Preview mode and noting that the commas are gone. By moving the sliders at the right and bottom edges of the report window, you can verify that all columns and rows are as they should be.
Figure 2-13:
Page footers carry useful information
At the bottom of each page, you might want to display some useful informa-tion, such as the page number. If you ever drop a stack of reports off your desk, page footers can be a valuable aid to putting them back together again in the proper order.
For the Product Price List, the page number, date printed, and report title are valuable additions to the page footer. (Prices tend to change frequently in a fast moving industry such as the mountain bike business, so the date of a price list is very important.) In Design mode, follow these steps to create a page footer for your report that includes all three of these items:
1. In the Insert toolbar, click the Insert Text Object icon.
You click this icon because all the items you want to place in the page footer are text items.
2. Drag the text object rectangle to the Page Footer section and place it by clicking the left mouse button.
3. Drag the handles on the left and right sides of the rectangle until it spans the full width of the page.
4. Click the Align Center icon.
There isn’t any text there yet, but there will be.
5. Right-click the text rectangle and choose Edit Text.
6. At the blinking cursor in the rectangle, type the report title, followed by a comma.
Type Product Price List, for this example.
Next, place the current date and page number into the page footer:
1. In Field Explorer, scroll down to Special Fields and expand it.
Remember, you expand a node by clicking the plus sign to its left.
2. Click the Print Date icon or the Print Date name next to it, and drag it to the Page Footer area, right after the comma.
3. After the Print Date field is in position, type a comma after it, and then type Page followed by a hyphen.
4. Click the Page Number icon or the name next to it, and drag it to the right of the hyphen.
5. Click the Preview tab at the top of the screen to switch to Preview mode.
The field names are replaced by actual values, as shown in Figure 2-15.
Wrap things up with a report footer
For some types of reports, it’s appropriate to have a final item to close out the report. This would appear after the last of the data on the last page. Items such as this go into the Report Footer section in Design mode. Remember, the report footer comes immediately after the last line of detail information and beforethe final page footer.
To illustrate this feature of Crystal Reports, put a company slogan at the bottom of the Product Price List. Place the slogan “Xtreme Mountain Bikes Take You to the Limit”into the Report Footer section in the same way that you put the report title into the Page Footer section. The result, in Preview mode, looks like Figure 2-16.
Figure 2-15:
Page footer in Preview mode.
Figure 2-14:
Recording helpful information
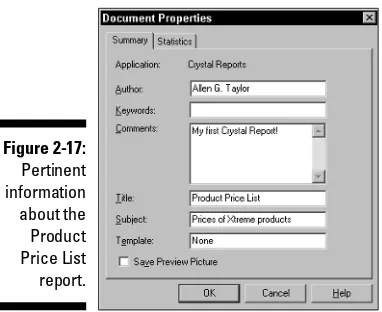
about your report
Now that the Product Price List report is essentially complete, you may want to generate some descriptive information about the report that’s associated with the report but not normally printed or displayed. To do this, follow these steps:
1. Choose File➪Summary Info.
The Document Properties dialog box appears.
2. Fill in the boxes with whatever information you want to associate with your report.
I added the information shown in Figure 2-17.
3. Click the OK button.
The document properties you entered are stored along with the report; they can be retrieved whenever anyone views the report with Crystal Reports.
Figure 2-17:
Pertinent information about the Product Price List report.
Figure 2-16:
Troubleshooting a Report That
Doesn’t Look Quite Right
Sometimes the vision you have in your mind is not adequately reflected in the report you produce. There are various reasons why this might be true. Perhaps your vision is not something that can be built in the real world. You can’t do much about that. But you can do something about other reasons, such as not using Crystal Reports properly or not being aware of all its capabilities.
Crystal Reports gives you tremendous freedom in how you can lay out your report. It also gives you great latitude in what you include in the report. In addition to text and columns of numbers, you can include graphical images, charts, graphs, and maps. You could even crank out a full-length science fic-tion novel with Crystal Reports if you wanted to, although other tools are better suited to that task.
The bottom line is this: If you feel sure that a report ought to be able to include something, you can almost certainly do it with Crystal Reports. This book tells you about many of the most powerful and useful features of Crystal Reports. If I don’t mention a feature or capability that you’d like to use, it may nonethe-less be available. Check the Crystal Reports User’s Guideand online help for additional information on advanced features. Crystal Reports is a product of Business Objects SA. More information on Crystal Reports can be found at www.businessobjects.com.
Printing a Report
Report Design Guidelines
In This Chapter
䊳Defining the purpose of the report
䊳Deciding what the report should include
䊳Linking the report to a database
䊳Laying out the report
䊳Conveying the right message
N
o book can tell you in a step-by-step manner exactly how to build the report you want. However, this book gets you into some general princi-ples of good report design — and shows you some common types of reports. From those general principles and examples, you can decide how best to design reports that meet the needs of your organization.An effective report design depends on many factors:
⻬The data that the report draws from the database
⻬The way the database is structured
⻬The level of detail that the users of the report require
⻬The purpose of the report
⻬The capabilities of the computer that displays or prints the report
⻬What the users of the report really need (understanding this is critical)
Audience
Some potential audience members may be familiar with the information that the report contains — and old hands at the naming conventions used for objects in the database. These people may prefer a streamlined presentation of the data. Other audience members might be unfamiliar with the report content — so you may have to translate terms, use graphical devices (such as charts), and include explanatory text. If you have two such divergent audi-ences, you may need to produce two reports. Both would contain the same information, presented in different ways.
Another question to ask is, “What information does the audience need and in what form should it be delivered?” If they need several unrelated things, you may serve them better by creating several reports, each one focused on one specific purpose.
Although it’s best to write a report with one consistent audience in mind, sometimes you have to design a report for multiple audiences, each with its own needs. The challenge is to give the members of each audience the infor-mation they need in a form they can easily understand, without handicapping the members of other audiences by subjecting them to irrelevant material. The key is to organize the information so members of each audience can quickly and easily find and understand the information of interest to them.
Purpose
In addition to having a specific audience, the report should be restricted to one specific purpose — and accomplish that purpose by providing thorough, accurate, timely information to the target audience. This information, more often than not, is the basis for important decisions that the readers of the report will make.
Restricting a report to serving a single purpose does everyone a favor. Reports that cover multiple topics generally don’t do justice to any one of them and tend to confuse readers. A good report covers a single topic and conveys a message that the reader can easily comprehend and act upon.
Knowing how important the report is to its audience may affect the amount of time and effort you put into creating it. Is the report likely to be a basis for “bet-the-business” decisions? Or does it simply make visible some facts that are nice to know but not earth-shattering?
the latest information in the database every time. Reports that are run multi-ple times, by multimulti-ple peomulti-ple, deserve more attention to detail than reports run only once.
Content
After you know who the report is for, and the kinds of decisions they want to base on the information in the report, it’s time to decide exactly what infor-mation should bein the report. Leaving out distracting, irrelevant material is just as important as including material of interest.
The best reports are succinct and to the point, offering readers the information they want right away, minus the clutter of information they don’t care about. Keeping in mind the audience and the purpose of the report, also consider what level of formality or informality is most appropriate.
If your report has to meet the needs of several audiences, shape its content along these lines:
⻬Determine which audience is the most critical.
⻬Determine which information is the most important to that audience.
⻬Display the most important information most prominently in the report.
⻬Put other, less important information for the most critical audience in a nearby but subordinate position.
⻬For the other audiences, cluster the information in such a way that each group reading the report can find all the information it needs within a single area of the report.
Connecting to Microsoft Access
Suppose you want to create a report based on data in a Microsoft Access database. Follow these steps:
1. Start Crystal Reports.
You are greeted by the Welcome to Crystal Reports dialog box.
2. Choose the As a Blank Report option, and then click OK.
Database Expert is displayed.
3. Expand the Create New Connection node by clicking the plus sign (+) next to it.
As shown in Figure 3-1, various data sources are available.
4. Connect to the appropriate database and display its tables in the Available Data Sources pane of Database Expert, as shown in Figure 3-2.
For more information on this process, see Chapter 2. To follow along with this example, connect to the xtremel.mdbdatabase.
5. Select the tables in the database that contain the data you want to include in the report.
Figure 3-1:
The Data-base Expert dialog box shows possible locations