BACHELOR THESIS – ME 141502
DECISION MAKING BETWEEN FULL SPEED, SLOW STEAMING, EXTRA
SLOW STEAMING AND SUPER SLOW STEAMING BY USING TOPSIS
MIZAN LUBNAN NRP. 4213 101 027
Supervisor :
Raja Oloan Saut Gurning, ST., M.Sc, Ph.D. Co-Supervisor :
Dr.-Ing. Wolfgang Busse
DOUBLE DEGREE PROGRAM OF MARINE ENGINEERING DEPARTMENT Faculty of Marine Technology
Institut Teknologi Sepuluh Nopember Surabaya
SKRIPSI – ME 141502
PENGAMBILAN KEPUTUSAN ANTARA KECEPATAN PENUH,
SLOW
STEAMING, EXTRA SLOW STEAMING DAN SUPER SLOW STEAMING
DENGAN MENGGUNAKAN METODE TOPSIS
MIZAN LUBNAN NRP. 4213 101 027
Dosen Pembimbing 1 :
Raja Oloan Saut Gurning, ST., M.Sc, Ph.D. Dosen Pembimbing 2 :
Dr.-Ing. Wolfgang Busse
PROGRAM DOUBLE DEGREE
DEPARTEMEN TEKNIK SISTEM PERKAPALAN Fakultas Teknologi Kelautan
Institut Teknologi Sepuluh Nopember Surabaya
ii
iv
vi
vii
DECLARATION OF HONOR
I, who signed below hereby confirm that:
This bachelor thesis report has written without any plagiarism act, and confirm consciously that all the data, concepts, design, references, and material in this report own by Reliability, Availability and Management (RAMS) in Department of Marine Engineering ITS which are the product of research study and reserve the right to use for further research study and its development.
Name : Mizan Lubnan NRP : 4213 101 027
Bachelor Thesis Title : Decision Making Between Full Speed, Slow Steaming, Extra Slow Steaming and Super Slow Steaming by Using TOPSIS
Department : Double Degree Program in Marine Engineering If there is plagiarism act in the future, I will fully responsible and receive the penalty given by ITS according to the regulation applied.
Surabaya, July 2017
viii
ix
DECISION MAKING BETWEEN FULL SPEED, SLOW STEAMING, EXTRA SLOW STEAMING AND SUPER SLOW STEAMING BY USING TOPSIS
Name : Mizan Lubnan
NRP : 4213101027
Department : Double Degree Program of Marine Engineering Supervisor : Raja Oloan Saut Gurning, ST., M.Sc, Ph.D. Co-Supervisor : Dr.-Ing. Wolfgang Busse
ABSTRACT
Many shipping companies were trying to deliver their cargoes as quickly and reliably as possible. But in the beginning of the latest economic crisis on 2007, the containership fleet is slowing down. Even though world oil prices are now declining, but based on the prediction of World Bank, the price of oil will rise again in 2017.
Nowadays shipping company implements slow steaming method on the operation of their ships. But they do not know whether these methods are effective or not due to any negative effects arising from an implement of slow steaming like increased sailing time so may result in losses to the shippers.
In this thesis will discuss the decision-making process between full speed, slow steaming, extra slow steaming and super slow steaming. This study aims to give suggestions on which ship speed is most optimal for shipping companies by considering technical and operational, financial and also environmental factors. Then, will be selected one the most optimal by using Technique for Order of Preference by Similarity to Ideal Solution (TOPSIS) method. While for criteria and sub criteria weighting are calculated by Analytic Hierarchy Process (AHP) method using Expert Choice software.
From the TOPSIS method, super slow steaming is chosen to be the first rank with a value of 0,8625 while the second rank is extra slow steaming with a value of 0,5455; then slow steaming with a value of 0,3587; and finally followed by full speed with a value of 0,1283.
x
xi
PENGAMBILAN KEPUTUSAN ANTARA KECEPATAN PENUH, SLOW STEAMING, EXTRA SLOW STEAMING DAN SUPER SLOW STEAMING
DENGAN MENGGUNAKAN METODE TOPSIS
Nama : Mizan Lubnan
NRP : 4213101027
Departemen : Teknik Sistem Perkapalan Double Degree Dosen Pembimbing : Raja Oloan Saut Gurning, ST., M.Sc, Ph.D.
Dr.-Ing. Wolfgang Busse
ABSTRAK
Banyak perusahaan pelayaran mencoba mengirimkan kargo mereka secepat dan seaman mungkin. Namun pada awal krisis ekonomi di tahun 2007, armada kapal kontainer melambat. Meski harga minyak dunia kini turun, namun berdasarkan prediksi Bank Dunia, harga minyak dunia akan naik kembali di tahun 2017.
Saat ini perusahaan pelayaran menerapkan metode slow steaming pada pengoperasian kapal mereka. Tapi mereka tidak tahu apakah metode ini efektif atau tidak karena efek negatif yang timbul dari penerapan slow steaming seperti waktu pelayaran yang meningkat sehingga dapat menyebabkan kerugian pada pengirim barang.
Dalam skripsi ini akan dibahas proses pengambilan keputusan antara kecepatan penuh, slow steaming, extra slow steaming dan super slow steaming.
Penelitian ini bertujuan untuk memberikan saran mengenai kecepatan kapal yang paling optimal untuk perusahaan pelayaran dengan mempertimbangkan faktor teknis dan operasional, keuangan dan juga lingkungan. Kemudian, akan dipilih yang paling optimal dengan menggunakan metode Technique for Order of
Preference by Similarity to Ideal Solution (TOPSIS). Sedangkan untuk pembobotan
kriteria dan sub kriteria menggunakan metode Analytic Hierarchy Process (AHP) yang dihitung dengan menggunakan program komputer Expert Choice.
Dari metode TOPSIS, super slow steaming terpilih menjadi peringkat pertama dengan nilai 0,8625 sedangkan peringkat kedua adalah extra slow
steaming dengan nilai 0,5455; Kemudian slow steaming dengan nilai 0,3587; dan
peringkat terakhir adalah kecepatan penuh dengan nilai 0,1283.
xii
xiii
PREFACE
Alhamdulillahirobilalamin huge thanks to Allah SWT the Almighty for giving me the chance, health, and prosperity so the author finally can make it to finish this Bachelor Thesis.
This thesis report entitled “Decision Making Between Full Speed, Slow Steaming, Extra Slow Steaming and Super Slow Steaming by Using TOPSIS” is submitted to fulfill one of the requirements in accomplishing the bachelor degree program at Marine Engineering Department, Faculty of Marine Technology, Institut Teknologi Sepuluh Nopember Surabaya. Conducting this research study is not possible without all helps and supports from various parties. Therefore, the author would like to thank to all people who has support the author for accomplishing this bachelor thesis, among others:
1. Firstly, to my parents, Mr. Lubnan Umar and Mrs. Lubnah who always give their loves, prayers, supports, and encouragements for every single path the author chooses. In addition, my beloved brother Zaidan Lubnan and my beloved sister Milza Lubnan.
2. Mr. Raja Oloan Saut Gurning, ST., M.Sc, Ph.D. and Mr. Dr.-Ing. Wolfgang Busse as supervisor in this Bachelor Thesis, who provide assistance, knowledge, guidance, and motivation through the completion of this Bachelor Thesis. 3. Mr. Dr. Eng. Muhammad Badrus Zaman, ST., MT. as the Head of Marine
Engineering Department FTK-ITS.
4. Mr. Prof. Semin, ST., MT., Ph.D as the Secretary of Marine Engineering Department.
5. Mr. Sutopo Purwono Fitri, ST., M.Eng., Ph.D as Author’s Lecturer Advisor since first semester until eighth semester.
6. Mr. Ir. Dwi Priyanta, M.SE as Secretary of Double Degree Program in Marine Engineering Department who has giving the motivation and every necessary information to help finish the bachelor thesis.
7. Mr. A.A. Bagus Dinariyana Dwi P., ST., MES., Ph.D as the Head of RAMS Laboratory who has giving permission to do any activities inside the lab and provides place during the working of bachelor thesis.
8. Mr. Aldrin Dewabrata ST. as Assistant Superintendent and Mr. Henman Nugroho as Data Analyst at PT. Meratus Line, who provide the data and advisory during the completion of this Bachelor Thesis.
10. All of BARAKUDA 13 members for all the cooperation during author’s 4 year
xiv
The author realizes that this Bachelor Thesis still far from perfect. Therfore, every constructive and supportive suggestion and idea to to improve this Bachelor Thesis are highly expected by the author so that the better version of this Bachelor Thesis can be reach in the future.
Finally last but not least may Allah SWT bestow his grace, mercy, and blessing to all of us and hopefully this Bachelor Thesis can be advantegeous to corresponding parties who may concern.
Surabaya, July 2017
xv
TABLE OF CONTENTS
PREFACE ... xiii
TABLE OF CONTENTS ... xv
LIST OF TABLES ... xix
LIST OF FIGURES ... xxi
CHAPTER I INTRODUCTION ... 1
I.1 Background ... 1
I.2 Statement Of Problems ... 2
I.3 Research Limitation ... 2
I.4 Research Objectives ... 2
I.5 Research Benefits ... 2
CHAPTER II BASIC THEORY ... 3
II.1 Overview ... 3
II.2 Slow Steaming Impact ... 6
II.3 Engine Efficiency ... 6
II.4 Profit Optimizing Speed ... 7
II.3.1 Total Operating Cost ... 7
II.3.2 Vessel Income ... 10
II.4 Air Pollution ... 11
II.4.1 Carbon Dioxide (CO2) ... 11
II.4.2 Nitrogen Oxide (NOx) ... 11
II.4.3 Sulfur Dioxide (SO2) ... 12
II.5 Calculation of Ship Emissions ... 12
II.5.1 Energy ... 12
II.5.2 Load factor (LF) ... 13
II.5.3 Activity ... 13
II.5.4 Emission Factors (EF) ... 13
xvi
II.6 Multiple Criteria Decision Making (MCDM) ... 14
II.6.1 Analytic Hierarchy Process (AHP) Method ... 15
II.6.2 Technique for Order of Preference by Similarity to Ideal Solution (TOPSIS) Method ... 16
CHAPTER III RESEARCH PROCESS ... 19
III.1 General ... 19
III.2 Flow Chart ... 19
CHAPTER IV DATA ANALYSIS ... 25
IV.1 Deciding Criteria for Selection of Ship Speed ... 25
IV.2 The Alternative ... 27
IV.3 Ship Data Identification ... 28
IV.3.1 Ship Particular ... 28
IV.3.2 Engine Test Bed ... 29
IV.3.3 Ship Summary Report ... 29
IV.3.4 Auxiliary Engine Test Record... 30
V.3.5 Ship Speed Calculation... 30
IV.3.6 Sailing Time Calculation... 30
IV.4 Sub-Criteria Calculation ... 31
IV.4.1 Engine Efficiency Calculation ... 31
IV.4.2 Auxiliary Consumption Calculation ... 33
IV.4.4 Operational Cost... 33
IV.4.5 Ship Revenue ... 43
IV.4.6 Ship Emissions Calculation ... 45
IV.5 Planning of Questionnaires ... 46
IV.5.1 Distribution of Questionnaires ... 48
IV.5.2 Processing Questionnaire Data ... 48
IV.6 Selection Decisions ... 55
IV.6.1 Construct the Normalized Decision Matrix (rij) ... 55
xvii
IV.6.3 Determine the Positive Ideal Solution (PIS) and Negative Ideal Solution
(NIS) ... 56
IV.6.4 Calculate the Distance of Positive Ideal Solution (D+) and Negative Ideal Solution (D-) ... 57
IV.6.5 Calculate the Relative closeness to the Ideal Solution ... 58
IV.6.6 Rank the Preference Alternatives ... 59
IV.7 Implemantation Strategy ... 59
CHAPTER V CONCLUSION ... 61
V.1 Conclusion ... 61
V.2 Suggestion ... 61
REFERENCES ... 63
ATTACHMENT 1 ... 65
ATTACHMENT 2 ... 69
ATTACHMENT 3 ... 73
ATTACHMENT 4 ... 81
xviii
xix
LIST OF TABLES
xx
xxi
LIST OF FIGURES
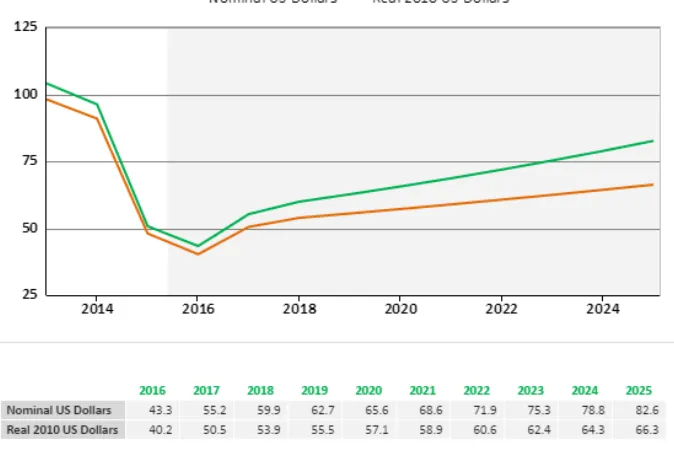
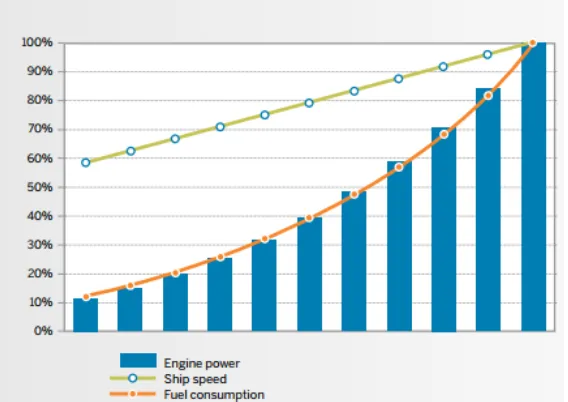
Figure 2.1 World Bank oil price forecast 2013-2025 ... 3 Figure 2.2 Correlation between ship speed, required engine power and
fuel consumption ... 4 Figure 2.3 Fuel consumption by containership size and speed ... 5 Figure 2.6 Illustration of distance to positive ideal solution and negative
ideal solution ... 16 Figure 3.1 General Flowchart ... 19 Figure 3.2 Selection Flowchart ... 20 Figure 4.1 Criteria and sub criteria that insert to expert choice software...48 Figure 4.2 Weighted comparison between criteria ... 49 Figure 4.3 Result of weighted calculation between criteria ... 49 Figure 4.4 Weighted comparison between technical and operational sub
criteria ... 50 Figure 4.5 Result of weighted calculation between technical and operational
xxii
1
CHAPTER I
INTRODUCTION
I.1 Background
Bunker fuel is a considerable expense to shipping lines. Especially in 2007, when bunker costs soared (July 2007 to July 2008: 350-700 USD/ton) ship operational cost becomes higher, the liner shipping industry decreases the commercial speed of their ships to save bunker cost (‘Slow Steaming’ 2017). Maersk Line and CMA-CGM was the first liner shipping industry that introduces slow steaming to their commercial speeds for Europe- Far-East services. It aims to reduce fuel consumption, so they can competitive in such market (Elswijk 2011).
In shipping, the best method to decrease the operational costs are by reducing the fuel consumption. The reasons for this because fuel consumption costs make up approximately 47% of a ship’s total operating expense (Valentito et al. 2012). One of strategy to reduce fuel consumption by using slow steaming. In slow steaming, container ship usually sails at speed 20-24 knots lowered to be only 12-19 knots only. At lower speeds, less fuel is consumed by ship, which has also its effect on the emission.
It is expected that the liner shipping industry in Indonesia can save considerable costs by implementing slow steaming, by calculating how many operating costs can be saved by reducing speed of the ship. 20.63% reduction in ship speed causes the fuel consumption savings approximately 49.01% (Anye et al. 2013). Slow steaming has a positive effect for ship owners and operators as benefit from savings on fuel costs and also causes a reduction in a number of emissions. However, slow steaming has a negative impact like reducing the number of ship trips in one year that can reduce the company's income.
In this thesis, author makes a selection of the most efficient ship speed by using decision support system or a system that can help in decision-making by applying method in accordance with the decisions selected. It can be assumed with comparing ship speed at full speed, slow steaming, extra slow steaming and super slow steaming by considering the elements of technical, financial and also environmental aspects.
I.2 Statement Of Problems
Based on the description above the statement problem of this thesis are: a. What criteria are selected in determining the method of ship speed? b. Which are the most efficient full speed, slow steaming, extra slow
steaming and super slow steaming in terms of corporate profit?
c. How many shipments of cargo that can be delivered by the ship in a month at full speed, slow steaming, extra slow steaming and super slow steaming?
I.3 Research Limitation
a. Focuses on the technical, operational, financial and environmental aspects to consider of full speed, slow steaming, extra slow steaming and super slow steaming on container shipping industry.
b. Did not discuss the specifics effect main engine after applying slow steaming.
I.4 Research Objectives
a. To conduct technical studies comparing the most efficient ship speed in accordance with established criteria.
b. Determine any criteria priority before applying slow steaming method. c. Determine the lowest fuel consumption cost could be obtained from four
ship speed scenarios.
d. Determine the highest engine efficiency values could be obtained from four ship speed scenarios.
e. Determine the highest revenue could be obtained from four ship speed scenarios.
f. Determine the lowest emissions could be generated from four ship speed scenarios.
I.5 Research Benefits
a. Knowing one of the methods to reduce fuel consumption by using slow steaming.
b. Knowing effects that can occur when applying slow steaming.
c. Knowing the technical analysis resulting from propulsion power produced by ship engine.
d. Knowing the financial analysis resulting from fuel consumption cost savings.
3
CHAPTER II
BASIC THEORY
II.1 Overview
Slow steaming is increasingly used by ship-owners in times of high fuel prices, low shipping demand and high shipping supply to reduce operational costs. In slow steaming, ships usually sail at speed of around 24-20 knots lowered only be 19-12 knots. The impact of speed reduction are reducing engine power so causes lower fuel consumption needed for the operation and also causes a decrease in carbon emissions.
Reference: World Bank Commodities Price Forecast 2016
Since the last few years, container shipping companies were trying to deliver their goods as quickly and reliably as possible. But when fuel price soared in 2008, Maersk Line was the first liner shipping industry that introduces slow steaming and became the standard operating procedure in their fleet. In the figure 2.1 can be seen even though world oil prices dropped dramatically in 2013-2016 but predicted by the World Bank if the oil price will rise again in 2017 until 2025. This
is the consideration of whether its slow steaming method is required for operation of the ship in the shipping industry.
Reference: Wiesman 2010
As figure 2.2 presents, by increasing speed of ship will result fuel consumptions are increased. The power produced by the engine is comparable to the speed of the ship. So change of ship speed can affect to engine power and lead to changes in fuel consumption. There are several factors to reduce fuel consumption, such as ship capacity, type of engine, auxiliary engine usage and weather conditions as well as other technical conditions that affect fuel consumption. Therefore, more and more companies are now trying use slow steaming method to save fuel costs at available opportunities.
Reference: Dagkinis & Nikitakos 2015
Most of ship are designed to sail at full speeds which around 85-90% of maximum enginen load. Based on figure 2.3 there are several ship speed when ships are sailing, there are full speed, slow steaming, extra slow steaming and super slow steaming.
a. Full speed
Full speed is the maximum speed of the ship that has been designed by engine manufacture (Rahman 2012). Can be seen in Figure 2.3 the speed range for full speed is abfigureout 20 up to 25 knots.
b. Slow steaming
The operation of ship below the normal speed capacity, about 15% from normal speed (Zanne et al. 2013). Can be seen in Figure 2.3 the speed range for slow steaming is about 18 up to 20 knots.
c. Extra slow steaming
The operation of ship below the slow steaming speed capacity, about 25% from normal speed (Zanne et al. 2013). It can be seen in Figure 2.3 also, the speed range for extra slow steaming is about 17 up to 18 knots.
d. Super slow steaming
This method also known as economic speed because it has a very significant change on fuel saving. Super slow steaming can use for higher reductions in operational ship speed. ((Zanne et al. 2013)
II.2 Slow Steaming Impact
Slow steaming has advantages in reducing fuel consumption and also lowers emissions produced by the engine. But slow steaming also cause new problems such as shippers had to wait a long time till their goods arrive at the destination due to a decrease of ship speed.
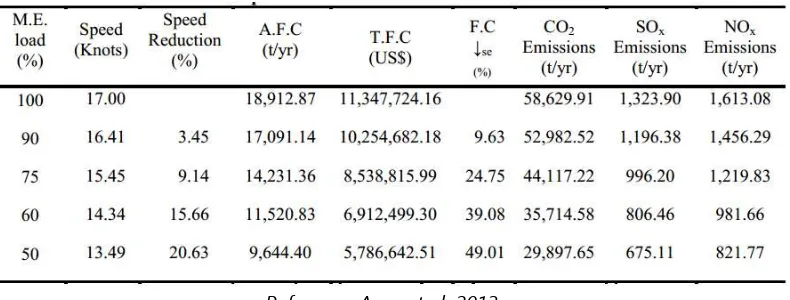
Reference: Anye et al. 2013
Based on Table 2.1, 20.63% reduction in ship speed causes the fuel consumption savings approximately 49.01%. Slow steaming has a positive effect for ship owners and operators as benefit from savings on fuel costs. However, slow steaming is also reducing the number of ship trips in one year that can reduce the company's income.
In the shipping process, there are two inter-related parties, namely carriers and shippers. The shipping line is the party who has implemented a lower speed on their vessels and the consequences on shore are present for the shipper because it will take more time before he will receive his freight. (Elswijk 2011)
Schedule timeliness represents a fourth primary benefit of slow steaming. Delays in ocean shipping can arise from a broad spectrum of sources such as port congestion, terminal productivity, weather and mechanical issues. (Notteboom 2006). For shippers, better schedule reliability can reduce uncertainty and subsequent safety stock needs. (Maloni, Paul & Gligor 2013)
II.3 Engine Efficiency
The efficiency of a machine is a measure of how well a machine can convert available energy from fuel to mechanical output energy. The percentage difference of the input power and the output power are efficiency values. For example, the electric power used to turn on the lights is not all converted into light energy, some of electrical power turned into heat.
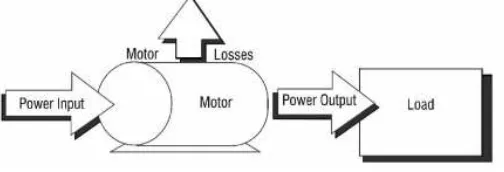
Figure 2.4 Input power and output power diagram Reference: Ghazali 2011
From Figure 2.4 efficiency can be defined as ratio between the amount of power required and the amount of power generated. Then the efficiency value can be determined by the following equation:
𝜂 = 𝑃𝑜𝑢𝑡
𝑃𝑖𝑛 𝑥 100% ...(2.1) Where;
η = Efficiency (%) Pout = Output power Pin = Input power
II.4 Profit Optimizing Speed
The calculation of profit made in order to know at what speed that most optimal so shipping company obtain maximum profit. Profit is the difference between vessel income or total revenue that obtained, minus total operating cost that incurred. Here is the formula for calculating profit (Meyer 2012):
PV = IV - CV ...(2.2) Where;
PV = Profit Function IV = Vessel Income CV = Total Operating Cost
II.3.1 Total Operating Cost
Operating costs are costs that should be spent for the need of daily operations with the goal of keeping the ship is always in a ready condition to sail. Cost elements that are part of the total operating cost are as follows:
a. Consumption Cost b. Port Cost
c. Usage Cost
CV = Total Operating Cost CU = Usage Cost
CH = Harbor Cost CC = Consumption Cost
II.3.1.1 Consumption Cost
Consumption cost is a combination of fuel oil consumption cost and lubricating oil consumption cost and then multiplied by the number of roundtrips. Consumption costs for shipping are the largest and most important part of the total operating costs, with fuel costs being the largest part of the consumption costs (Meyer 2012). Ship fuel consumption are determined by several variables such as size of the ship, shipping distance, speed and weather (waves, currents, wind). The formula used to calculate the consumption cost are (Meyer 2012): CC = fT . (CF + CL) ...(2.4) Where;
CC = Consumption Cost
fT = Maximum Number of Roundtrips CF = Fuel Cost
CL = Lubricating Cost
To calculate the amount of fuel consumption on ship, it should be known how the amount of power that produced by the engine. And then can be calculated by measure mass of fuel consumed per unit time to produce per kilowatt (KWH).
SFOC (g/kwh) = Mass of fuel consumed per hour
Power developed in kilowatt ...(2.5) II.3.1.2 Port Cost
Port is a place consisting of land and surrounding waters with certain limits as a place of government activity and economic activity which is used as a place for mooring, anchorage, docking, loading and unloading of passengers or goods equipped with shipping safety facilities and supporting activities (UU 17/2008 Tentang Pelayaran). While the port cost is cost that should incurred by shipowner for continued use of the port such as anchorage services, pilotage services, tugboat services and mooring services.
a. Anchorage Services
provided for each subsequent 10 days as the base rate. In the determination of ships anchored in the port of Tanjung Perak, the service fee is Rp.112,-/GT and for foreign is US $ 0,1 / GT (tariff at Port of Tanjung Perak, 2014).
b. Pilotage Services
Ships with gross tonnage 150 or more, are required to use pilotage services while on sail in port area that mandatory of pilotage services. Tariff charged in pilotage services are fixed rates Rp. 225.000,- ship/movement and variable rates Rp. 45,- GT/movement (tariff at Port of Tanjung Perak, 2014). Then calculated using the following formula: PSC = (Fr x movement )+ (Vr x GT x movement)...(2.6) Where;
PSC = Pilotage Services Cost Fr = Fixed Rates
Vr = Variable Rates GT = Gross Tonnage
Ships that use the pilotage services at the time of entry is charged 1 times the tariff of pilotage services at the time of entry, while leaving the port is charged 1 times the tariff of pilotage services at the time of exit. The rate set for pilotage service is calculated based on the number of moves. c. Tugboat Services
Tugboat is a small ship that operating at the port to help manoeuvre large ships that will berth at the port, even though the tugboat is small but have a great thrust to be able to steer the berthing ships. Tugboats are created to pull or push ships or anything that floating. Tariff charged for tugboat services are fixed rates Rp. 1.443.149,- ship/hour and variable rates Rp. 30,- GT/ship (tariff at Port of Tanjung Perak, 2014). Then calculated using the following formula:
TSC = (Fr x unit x t) + (Vr x GT x t)...(2.7) Where;
TSC = Tugboat Services Cost Fr = Fixed Rates
d. Mooring Services
The mooring services tariff calculation for domestic ship is Rp. 116,- GT/etmal and for foreign ships US $ 0.131 GT/etmal. Where 1 etmal = 24 hours.
MSC = Fr x GT x etmal...(2.8) Where;
MSC = Mooring Services Cost
Fr = Fixed Rates (Rp. 116,- GT/etmal) GT = Gross Tonnage
Etmal = (1 etmal = 24 hour)
II.3.1.3 Usage Cost
Usage cost are those costs incurred for insurance, labor costs and maintenance. Usage costs can be considered as more or less fixed with respect to
the vessel’s speed (Meyer 2012). For the sake of simplicity, in this thesis are assumed fixed usage cost (does not depend on the speed of ship).
II.3.2 Vessel Income
Vessel income is the amount of money received by shipping company from their activities of carrying out the delivery services to customers. To calculate the vessel income by multiplying the freight rate with a maximum transport performance. In this thesis assumed vessel capacity is fully utilized. The formula used to calculate the vessel income are (Meyer 2012):
IV = ∑ƤFR,i . FS ...(2.9) Where;
IV = Vessel Income
ƤFR,i = Freights Rates Fs = Service Performance
Ship transport performance has become a critical aspect of ship’s operation. In determining service performance is required effective capacity or the actual usable cargo space which is further multiplied by the maximum number of roundtrips during the operation time period. The formula used to calculate the service performance are (Meyer 2012):
Fs = capeff . fT
Fs = capeff . TO / (TH + TS) ...(2.10) Where;
Fs = Service Performance
fT = Maximum Number of Roundtrips TO = Operating Time
TH = Harbor Waiting Time TS = Sea (Shipping) Time
II.4 Air Pollution
Marine transportation, especially those use motor as the engine driving, is one source of air pollution. Pollution or air pollution is the mixing of substance, energy or other components into the atmosphere or changing composition of the air by human activities or natural processes, so that the air quality drops to a certain level which causes air to be less or may not work according the puRp.ose (MENKLH 1988).
In Indonesia today approximately 70% of air pollution caused by vehicle emissions that produce harmful substances that can cause negative effects, both to human health and the environment (Sugiarti 2009). Burning of fossil fuels produces carbon dioxide, nitrogen oxide, and sulfur dioxide compounds. The sources of emissions and the effects on environment are listed in the Table 2.2.
Tabel 2.2 Emissions of fuel combustion and the effect on environment
Emission Source Influence
Carbon dioxide (CO2) Perfect burning of carbon fuels
Global warming Nitrogen oxide (NOx) By-product of most
combustion processes
Acid rain Sulfur dioxide (SO2) Fuel burning that
contain sulfur
Smoke/fog, acid rain
Reference: Pinontoan 2012
II.4.1 Carbon Dioxide (CO2)
Carbon dioxide is basically a natural product of a combustion reaction. Burning fossil fuels become the main source emitters of CO2 in the earth (Kamal 2015). CO2 is produced from gas which comprises one carbon atom and two oxygen atoms. Here is the reaction (Jaya 2014):
C + O2 = CO2
II.4.2 Nitrogen Oxide (NOx)
N2 + O2 = 2NO 2NO+ O2 = NO2
II.4.3 Sulfur Dioxide (SO2)
Sulfur dioxide is one type of sulfur oxide gases (SOx). SO2 is formed during a combustion of fossil fuels containing sulfur (Kamal 2015). Sulfur contained in almost all the crude material that unprocessed such as crude oil, coal and ores containing metals such as aluminum, copper, zinc, lead and iron (Yuligawati 2014). SO2 formation mechanism can be written as follows (Wardhana 2001):
S + O2 = SO2
II.5 Calculation of Ship Emissions
CO2 emissions are increasingly showing an increase from year to year, so it needed a strategy to reduce emissions. One of the strategy is apply slow steaming method. The advantage of slow steaming is to decrease the amount of CO2 emissions that are proportional with the amount of fuel combustion (Cariou 2011). To calculate an estimate of the ship's emissions, it can use the method of Puget Sound Maritime Air Emission Inventory that published in 2012. The formula used to calculate the emissions from the engine are (Puget Sound Maritime Air Emission Inventory 2012):
E = Energy x EF x FCF...(2.11) Where;
E = Emissions from the engine Energy = Energy demand (kWh) EF = Emission factor (g/kWh) FCF = Fuel Correction Factor
II.5.1 Energy
Energy output of the engine over the period of time. To calculate the energy can be used formula as follows (Puget Sound Maritime Air Emission Inventory 2012):
Energy = MCR x LF x A ...(2.12) Where;
Energy = Energy output of the engine over the period of time (kWh) MCR = Maximum continuous rated engine power (kW)
II.5.2 Load factor (LF)
Load factor is expressed as the ratio of a vessel’s power output at a given
speed to the vessel’s MCR power. To calculate the load factor can be used formula as follows (Puget Sound Maritime Air Emission Inventory 2012):
LF = (SpeedActual / SpeedMaximum)3...(2.13) Where;
LF =load factor
SpeedAct = actual speed (knots) SpeedMax = maximum speed (knots)
II.5.3 Activity
Time in mode or activity is measured in hours of operation. To calculate the activity can be used formula as follows (Puget Sound Maritime Air Emission Inventory 2012):
A = D / Speedactual...(2.14) Where;
A = activity (hours)
D = distance (nautical miles) SpeedAct= actual ship speed (knots)
II.5.4 Emission Factors (EF)
The emission factors are listed by model year for slow and medium speed engines on the Table 2.3 and Table 2.4
Tabel 2.3 Fuel Correction Factors for NOx and SO2
Engine Model Year NOx SO2
Slow Speed Diesel ≤ 1999 18.1 10.5 Medium Speed Diesel ≤ 1999 14.0 11.5 Slow Speed Diesel 2000-2010 17.0 10.5 Medium Speed Diesel 2000-2010 13.0 11.5 Slow Speed Diesel 2011-2015 14.4 10.5 Medium Speed Diesel 2011-2015 10.5 11.5
Gas Turbine All 6.1 16.5
Steamship All 2.1 16.5
Tabel 2.4 Fuel Correction Factors for CO2
Engine Model Year CO2
Slow Speed Diesel All 620
Medium Speed Diesel All 683
Gas Turbine All 970
Steamship All 970
Reference: Puget Sound Maritime Air Emission Inventory 2012
II.5.5 Fuel Correction Factors (FCF)
Fuel correction factors are used to account for variations in fuel parameters between different types of fuel, so these variations can be accounted for in the emission estimates. Can be seen in the table 2.5 lists the fuel correction factors.
Tabel 2.5 Fuel Correction Factors Fuel Used NOx SO2 CO2
HFO (2.7 % S) 1 1 1 HFO (1.5 % S) 1 0.555 1 MGO (0.5 % S) 0.94 0.185 1 MDO (1.5 % S) 0.94 0.555 1 MGO (0.1 % S) 0.94 0.037 1 MGO (0.3 % S) 0.94 0.111 1 MGO (0.4 % S) 0.94 0.148 1
Reference: Puget Sound Maritime Air Emission Inventory 2012
II.6 Multiple Criteria Decision Making (MCDM)
Multiple criteria decision making is a decision making method to establish the best alternative from a number of alternatives based on certain criteria. The criteria usually measures or rules or standards used in decision making. In general, it can be said that the MCDM selecting the best alternative from a number of alternatives. (Kusumadewi et al, 2006). For solve multiple criteria decision making problem, there are five basic method:
a. Simple Additive Weighting Method (SAW) b. ELECTRE
c. Weighted Product (WP)
d. Analytic Hierarchy Process (AHP)
In this thesis, will using AHP (Analytic Hierarchy Process) and TOPSIS (Technique for Order of Preference by Similarity to Ideal Solution) method to solve the decision making problem. The reasons for using TOPSIS method are conceptually simple, efficiency computational process that can be easily programmed into a spreadsheet and has the ability to measure relative performance of the alternatives in decision of a simple mathematical form (Murnawan & Siddiq 2012). Another advantage of TOPSIS method are have sound logic that represents rationale of human choice and has proven to be one of the best methods for dealing with ranking issue (Sarraf et al, 2013). However on TOPSIS method, there are no formula to calculate weight of criteria, so that TOPSIS method needs another method to help weighting part in this process. So AHP method will be used on this thesis for weighting criteria then the weight of criteria will be used for deciding the best alternative with TOPSIS method.
II.6.1 Analytic Hierarchy Process (AHP) Method
AHP is a method has been developed by Thomas L. Saaty since 1970 and still developing until now. The advantages of this method is AHP gives us comprehensive hierarchy to solve the problem. The AHP simplifying complex problems into a hierarchy.
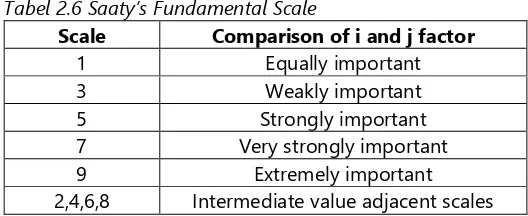
AHP method lets many people or group to build an idea and give definition for the problems to solve them. While for AHP method the weight of every component (criteria and alternatives) should know before. The weight of criteria will show us, how important every components each other. For weighting the component, this Saaty scale with 1-9 as the range number will use:
Tabel 2.6 Saaty’s Fundamental Scale
Scale Comparison of i and j factor
1 Equally important
3 Weakly important
5 Strongly important
7 Very strongly important
9 Extremely important
2,4,6,8 Intermediate value adjacent scales
II.6.2 Technique for Order of Preference by Similarity to Ideal Solution
(TOPSIS) Method
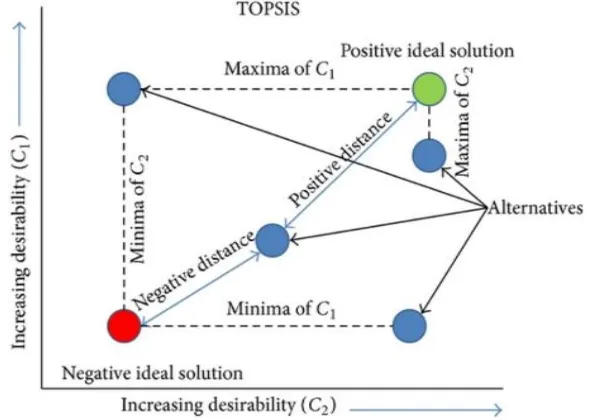
TOPSIS method is a decision-making techniques from several alternative options available. TOPSIS aims to determine the positive ideal solution and negative ideal solution. Can be seen in Figure 2.4, there are two criteria goals namely positive ideal solution to maximize the benefits criteria and minimize the cost criteria, while the negative ideal solution to maximize cost criteria and minimize benefit criteria.
Benefits criteria is the criteria when the value of these criteria more greater, so these criteria is more feasible as well to been selected. While the cost criteria is opposite of the criteria benefits, the smaller value of these criteria will be more feasible to been selected.
Reference: Chauhan & Vaish 2013
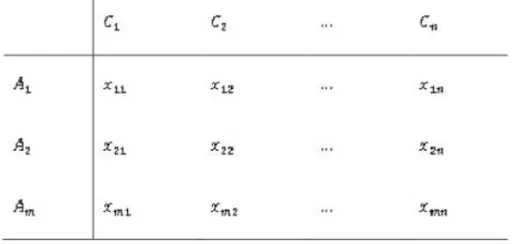
In TOPSIS method, the optimal alternative is closest to the positive ideal solution and farthest from the negative ideal solution. Based on Rahman, A. (2012), TOPSIS method can be expressed as Table 2.7, where A is an alternative that can be selected by the shipping company and C is the evaluation criteria that can be measured. While X is a value indicating the working rank of each alternative against the criteria.
Tabel 2.7 A decision matrix form in TOPSIS method
Steps to solve a problem using TOPSIS method are as follows:
a. Describe the alternatives and the criteria into a matrix, where Xij is a measurement of choice of alternatives to i and j criteria (Lotfi et al. 2011): 𝐷 = [𝑋𝑋2111 𝑋𝑋22..12.. 𝑋𝑋2313
𝑋𝑖1 𝑋𝑖2.. 𝑋𝑖3
]...(2.15)
b. Make matrix D that is normalized decision matrix. Every normalization of the rij values can be done by calculation using the following equation. rij = 𝑥𝑖𝑗
√Σ𝑖=1𝑚 𝑥𝑖𝑗2
...(2.16)
c. Make weighting on the normalized matrix. After normalized, each column of the matrix D multiplied by the criteria weight (Wi) to produce matrix.
yij = Wi .rij...(2.17) d. Determining the value of a positive ideal solution (PIS) and negative ideal solution (NIS). The ideal solution is denoted A+, while the negative ideal solution denoted A-. The equation for determining the ideal solution can be seen in the following equation.
A+ = y1+ ,y2+,…,y
j+ ...(2.18) A- = y1- ,y2-,…,y
j- ...(2.19) Where;
e. Calculating separation measure. Separation of this measure is measuring the distance of an alternative to the positive ideal solution and the negative ideal solution.
𝐷𝑖+= √Σ𝑖=1𝑛 (𝑦𝑖+− 𝑦𝑖𝑗)2...(2.20) 𝐷𝑖−= √Σ𝑖=1𝑛 (𝑦𝑖𝑗− 𝑦𝑖−)2...(2.21) Where;
i = 1,2,3,....,m
f. Calculating the value of preference for each alternative. To determine the ranking of each alternative it is necessary to first calculated preference value of each alternative.
𝑉𝑖+= 𝐷𝑖−
𝐷𝑖++𝐷𝑖− ...(2.22) Where;
0 < Vi+ < 1 i = 1,2,3,....,m
19
CHAPTER III
RESEARCH PROCESS
III.1 General
Based on the statement of problems, the methodology has been arranged. Methodology has function to make this research can be done easily. Methodolgy show us the steps of all process in this bachelor thesis.
III.2 Flow Chart
For this bachelor thesis, the methodology will be devided into two flowcharts. They are general flowchart and selection flowchart. General flowchart show us the general step of this research, then the following is selection flowchart to show us the step of selection process.
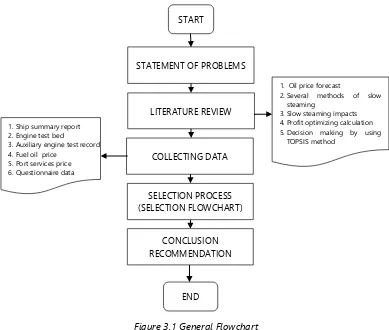
Figure 3.1 General Flowchart
START
STATEMENT OF PROBLEMS
LITERATURE REVIEW
COLLECTING DATA
SELECTION PROCESS (SELECTION FLOWCHART)
1. Oil price forecast
2. Several methods of slow steaming
3. Slow steaming impacts 4. Profit optimizing calculation 5. Decision making by using
TOPSIS method 1. Ship summary report
2. Engine test bed
3. Auxiliary engine test record 4. Fuel oil price
5. Port services price 6. Questionnaire data
CONCLUSION RECOMMENDATION
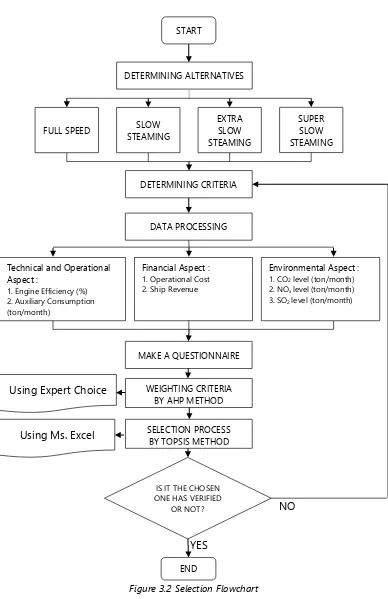
Figure 3.2 Selection Flowchart START SLOW STEAMING DETERMINING CRITERIA DETERMINING ALTERNATIVES SUPER SLOW STEAMING EXTRA SLOW STEAMING FULL SPEED
MAKE A QUESTIONNAIRE
WEIGHTING CRITERIA BY AHP METHOD
IS IT THE CHOSEN ONE HAS VERIFIED
OR NOT? Financial Aspect : 1. Operational Cost 2. Ship Revenue Technical and Operational
Aspect :
1. Engine Efficiency (%) 2. Auxiliary Consumption (ton/month)
Environmental Aspect : 1. CO2 level (ton/month) 2. NOx level (ton/month) 3. SO2 level (ton/month)
SELECTION PROCESS BY TOPSIS METHOD
END YES
NO DATA PROCESSING
Using Expert Choice
Based on the general flowchart, we can describe all of steps as below: 1. Statement of Problems
Identifying the problems is to determine what problem formulation to be taken. Formulation of the problem is an early stage in the implementation of the final project. This stage is a very important stage, which at this stage is why there is a problem that should be solved so worthy to be used as ingredients in the final work. Problem formulation is done by digging information about problems that occur at this time. From this stage, the purpose of why this thesis done is knowable.
2. Literature Review
Once a problem is already known, the next step is to collect reference materials related to the final project from many sources about oil price forecast, correlation between ship speed, required engine power and fuel consumption, several methods of slow steaming, slow steaming impacts on ocean carriers and shippers, profit optimizing calculation, decision making by using TOPSIS method and weighting by using AHP method. Those references taken from:
a. Paper b. Text Book c. Bachelor Thesis d. Article
e. Information from the internet 3. Data Collection
To support the thesis, needed to collect some ship operational data and also various cost for the ship operational. The detail of data will mention below:
f. Ship particular g. Engine test bed h. Ship summary report i. Auxiliary engine test record j. Fuel oil price
4. Data Processing
At this stage there are three points which should have done to process the data and will be analysed, there are:
a. Calculating the main engine efficiency.
b. Calculating the auxiliary consumption (ton/month). c. Calculating the amount of operational cost.
d. Calculating the amount of ship revenue.
e. Calculating the amount of carbon dioxide emissions (ton/month) that generated by the ship.
f. Calculating the amount of nitrogen oxide emissions (ton/month) that generated by the ship.
g. Calculating the amount of sulfur dioxide emissions (ton/month) that generated by the ship.
h. Questionnaire data processing. 5. Selection Decision
The selection process doing by two selection methods, these are AHP and TOPSIS. The AHP method using for weighting the criteria by using expert choice software. Then the TOPSIS method used for selecting the most optimal speed. These are some questions that will use for determining the criteria:
a. How much the engine efficiency when applying slow steaming on ship engines?
b. Is slow steaming can lower ship operating costs?
c. How much fuel consumption for main engine can be reduced by slow steaming?
d. How much fuel consumption for auxiliary engine can be reduced by slow steaming?
e. By applying slow steaming, can it reduce the amount of cargoes delivered in a month?
f. How big the effect of slow steaming on ship emission reduction? 6. Results of the Selection Decisions Based on Highest Ranked
7. Conclusion and Recommendation
25
CHAPTER IV
DATA ANALYSIS
In chapter IV will contain the analysis and discussion of decision-making process to determine the optimal speed of the ship, based on the data obtained. The data required to do this thesis are ship summary report, engine test bed, main engine and auxilary engine project guides and ship particulars. These data are necessary for the calculations of each criteria in determining the most optimal ship speed.
After getting all data that will be used in the process of this thesis, then the next step is to calculate value of the sub-criteria to each load engine. After getting value for each sub-criteria can be continued by selecting the most optimal speed of ship. Selection of these speed will be conducted by using TOPSIS method.
In accordance with the formulation of the problem that had been predetermined, the subject is in this thesis include:
a. Determine the speed alternative.
b. Determine the criteria and sub-criteria that can be used in the selection of the most optimal speed.
c. Data collection process of all the criteria and sub-criteria.
d. Calculate the value on each criteria in determining the most optimal ship speed.
e. Performing the weighting vector calculation process using pairwise comparison.
f. Ranking the preference order of all the alternatives using the TOPSIS method.
IV.1 Deciding Criteria for Selection of Ship Speed
TOPSIS is one of method to select some alternatives based on same criteria. For this case, the criteria divided into 3 criteria and 7 sub-criteria. These criteria have to decide carefully, because the criteria will influence the selected alternative mostly.
possible goals for each sub criteria which are benefit or cost goal. The benefit goal are sub criteria that are profitable or advantageous such as a vessel's profits, while the cost goal are sub criteria that are disadvantageous such as the amount of emissions incurred by ship engine. Detail explanation of these will describe in Table 4.1 (Rahman 2012):
Table 4.1 The list of criteria and sub-criteria associated with the goal
Main Criteria Sub Criteria Goal
Technical and Operational Aspect
Engine Efficiency Benefit Auxiliary Consumption Cost
Financial Aspect Operational Cost Cost
Ship Revenue Benefit
Environmental Aspect
Carbon Dioxide (CO2) Cost Nitrogen Oxide (NOx) Cost Sulfur Dioxide (SO2) Cost
Here is an explanation of each of the criteria and sub-criteria in table 4.1 are used in the selection of the ship's speed. This explanation is also included in the questionnaire so that the respondent be able more easily in providing an assessment in the questionnaire.
1. Technical and Operational Aspect
Which is the speed considerations that can work most optimally. The following sub criteria in the technical and operational aspect:
a. Engine Efficiency
Decreased engine efficiency due to low load operation of the engine. The efficiency of a machine is a measure of how well a machine can convert available energy from fuel to mechanical output energy.
b. Auxiliary Consumption
With increasing shipping time because the speed reduction will have an impact on the amount of fuel consumed by the auxiliary machinery.
2. Financial Aspect
Costs become a very important component for the management of companies involved in the implementation of activities to accomplish goals, including the ship's speed decisions. The following sub-criteria in financial calculations:
a. Operational Cost
Costs are included in ship operating expenses are fuel cost, lubricant cost and also port cost.
b. Ship Revenue
Fee income earned from the shipment of goods from the origin port to destination port. The negative impact of the engine load reduction will cause reduced of the ship revenue.
3. Environmental Aspect
Environmental aspect is a consideration the effect from ship emissions on the surrounding environment. The following sub criteria of environmental aspects were taken into consideration in measuring the emissions caused by the combustion of fuel:
a. Carbon Dioxide (CO2)
Carbon dioxide emissions during voyage activity is caused by fuel combustion in the engine of the ship. The amount of carbon dioxide levels can result in causing the hot air trapped on earth and eventually becomes hot environment. b. Nitrogen Oxide (NOx)
Nitrogen oxide compounds come from the combustion of the fossil fuels. The air has been polluted by nitrogen oxide gas is not only harmful to humans and animals, but also dangerous for the life of the plant.
c. Sulfur Dioxide (SO2)
Sulfur dioxide compounds formed during a combustion of fossil fuels containing sulfur. High levels of Sulfur dioxide in the air is one of the causes of acid rain.
IV.2 The Alternative
The alternative was determined based on the literature study. From the literature study that have been described before (Rahman 2012; Zanne et al. 2013), there are four alternative speed of the ship which will be evaluated to choose the method most appropriate speed. The four methods are:
a. Full speed
Full speed is the maximum speed of the ship that has been designed by engine manufacture (Rahman 2012). The engine load at full engine speed conditions is 100% of engine load.
b. Slow steaming
c. Extra slow steaming
Extra slow steaming is process of reducing the speed of cargo ships to save more money on fuel consumption and also cut down the emissions that produced by the engine. The operation of extra slow steaming below the slow steaming speed capacity, about 25% from normal load (Zanne et al. 2013). d. Super slow steaming
Super slow steaming method also known as economic speed because it has a very significant change on fuel saving. Super slow steaming can use for higher reductions in operational ship speed (Zanne et al. 2013). In this thesis the operation of super slow steaming is 50% from the full load.
IV.3 Ship Data Identification
In this discussion, the ship data that used as a calculation to determine the decision-making is a container ship owned by PT. Meratus Line, with the name MV. Meratus Medan 1. The following are various data required for a calculation, such as ship particular, engine test bed, ship summary report, and also auxiliary engine test record.
IV.3.1 Ship Particular
Table 4.2 Ship Particular
Ship’s Name MV. MERATUS MEDAN 1 Flag / Port of Registry Indonesia / Surabaya
Owner PT. Meratus Line
Built Japan, 1996
Kind of Ship Container Ship
L.O.A. 161,85 M
Draft 8,92 M
Pitch Propeller 4,789 M
Gross Tonnage 13853 Tons
DWT 17476
Vs 18,5 Knots
Main Engine Hitachi B&W 7S50MC Auxiliary Engine Yanmar M220AL-UN X
Source: PT. Meratus Line
tonnage, the amount of ship length overall, service speed, main engine series and auxiliary engine series. This data was taken from the PT. Meratus Line.
IV.3.2 Engine Test Bed
Engine test bed is a test result of an engine which contains engine revolutions per minute (RPM) and fuel consumption. Furthermore, the engine test bed is used to find the engine speed and fuel consumption at each load. Table 4.3 contains engine test bed from MV. Meratus Medan 1 that obtained from PT. Meratus Line.
Table 4.3 Engine Test Bed
Load (%) 50% 75% 85% 100%
Power (KW) 4994 7491 8498,8 9988
Engine Speed (RPM) 115,3 115,3 120,37 127,14 FO Consump. (kg/h) MGO 1276,9 1276,9 1445,7 1739,8
Source: PT. Meratus Line
IV.3.3 Ship Summary Report
Ship summary report is a report that containing operational data such as the number of vessel routes, voyage distance, voyage time, anchorage time, activity time port and total mass of cargo for one month. Here is a list of activities MV. Meratus Medan 1 owned PT. Meratus Line for one month, in February 2017.
Table 4.4 Ship Summary Report
Vessel Route
Total Manouvering
Sea Passage
(BOSV to EOSV) Anchorage Time (hours) Port Activity Time (hours) Total Mass of Cargo (Tons) Distance (NM) Time (hours) Distance (NM) Time (hours)
SUB-JKT 25 2,4 377 266,6 0 22,9 5712
JKT-SUB 4 0,9 372 24,1 33,3 27 6644
SUB-BIT 25 2,7 1066 70,5 0 42,1 11388
BIT-GTO 12 0,7 197 13,3 1,4 52 8433
GTO-SUB 3 0,8 863 58,6 8,5 117,3 8708
SUB-JKT 24 2,8 375 24,4 3,9 12,6 5314
JKT-SUB 4 0,6 376 24,7 17,1 35,3 6797
TOTAL 97 NM 11 hrs 3626 NM
242
hrs 64 hrs 309 hrs
52996 Tons
IV.3.4 Auxiliary Engine Test Record
Table 4.5 contains auxiliary engine test records data such as the amount of output (kW) and SFOC (gr/kWh) at each load that carried out on 21 May 1996. The series of the auxiliary engine in MV. Meratus Medan 1 is Yanmar M220AL-UN X.
Table 4.5 Auxiliary Engine Test Report
Load (%)
Time (H.M. - H.M.)
Output
(kW) SFOC (gr/kWh)
25 09.00-09.20 170 274
50 09.20-09.40 340 219,2
75 09.40-10.00 510 209,5
100 10.00-10.30 680 202,8
Source: PT. Meratus Line
V.3.5 Ship Speed Calculation
Before calculating the value of each sub criteria, It should be first complete the various data required, such as the ship speed at each load and also the length of sailing time that ship needed to sail at each speed. To calculate the engine speed at each load are by using the following formula:
Speed = (Pitch x RP.M x 60) 1852 Where,
Pitch = The distance a propeller would move in one revolution
RPM = (Revolutions Per Minute) The number of rounds done in a minute The result of the calculation speed of the ship at each load by using the above formula are obtained in Table 4.6.
Table 4.6 Ship Speed Calculation
Load % 50% 75% 85% 100%
Power (KW) 4994 7491 8489,8 9988 Engine Speed (RPM) 100,87 115,30 120,37 127,14 Speed (knot) 15,65 17,89 18,68 19,73
IV.3.6 Sailing Time Calculation
Table 4.7 Sailing Time Calculation
Vessel Route
Distance (NM)
SSS ESS SS FS
15,65 knot 17,89 knot 18,68 knot 19,73 knot
SUB-JKT 377 24,09 21,07 20,19 19,11
JKT-SUB 372 23,77 20,79 19,92 18,86
SUB-BIT 1066 68,11 59,59 57,08 54,04
BIT-GTO 197 12,59 11,01 10,55 9,99
GTO-SUB 863 55,14 48,24 46,21 43,75
SUB-JKT 375 23,96 20,96 20,08 19,01
JKT-SUB 376 24,03 21,02 20,13 19,06
TOTAL (hours) 231,7 202,7 194,2 183,8
It can be seen in the table above that slow steaming greatly affects the amount of shipping time by adding time up to 100 hours from normal operational time. After getting the value of sailing time on each engine load, then the next will be calculated auxiliary consumption, service performance and bunker consumption at each engine load.
IV.4 Sub-Criteria Calculation
After obtaining the required data to calculate each sub criteria value, the next step is to calculate the value of all sub criteria that have been determined on each alternatives that are engine efficiency, auxiliary consumption, operational cost, ship revenue, carbon dioxide, nitrogen oxide and sulfur dioxide.
IV.4.1 Engine Efficiency Calculation
To calculate the percentage value of engine efficiency, needed SFOC (specific fuel oil consumption) data at each load using the formula:
𝜂 = 𝑃𝑃𝑜𝑢𝑡
𝑖𝑛 𝑥 100% Where,
η = Efficiency (%) Pout = Output power Pin = Input power
are the amount of energy required by the engine to produce 1 KW output. To get the engine efficiency value by calculating the following steps:
a. Calculating the input power
In this calculation using 50% engine load that requiring 180 g/kWh of SFOC. However, the SFOC in the data using marine gas oil (MGO), but while sailing MV. Meratus Medan 1 using heavy fuel oil (HFO), then it should be changed first by using HFO heating value, amount 41.00 kJ/kg. Here is an example of the calculation:
Power In = 200 𝑔𝑟/𝑘𝑊ℎ
1.000 𝑥 41.000 𝑘𝐽/𝑘𝑔 = 0,2 𝑘𝑔/𝑘𝑊ℎ 𝑥 41.000 𝑘𝐽/𝑘𝑔
3.600 = 2,05 kJ/sec = 2,05 KW
b. Calculates engine efficiency
By comparing between 1 KW of output power with the input power that has been calculated before, and then multiplied by 100%. Here is an example of the calculation:
𝜂 = 𝑃𝑜𝑢𝑡
𝑃𝑖𝑛 𝑥 100%
= 1 𝐾𝑊
2,05 𝐾𝑊 𝑥 100% = 48,8%
From the above calculation can be concluded that to produce 1 KW output power required 2,05 KW of input power. While the percentage value of the engine efficiency when the load condition 50% is 48,8%. By calculating as the same steps in the above calculation, Table 4.8 contains the percentage value of engine efficiency on each engine load.
Table 4.8 Engine Efficiency Calculation
SSS ESS SS FS
Load 50% 75% 85% 100%
Power (KW) 4994 7491 8489,8 9988
FO Consump. (kg/h) MGO 876,6 1276,9 1445,7 1739,8 FO Consump. (kg/h) HFO 962,1 1401,5 1586,7 1909,5
SFOC (g/KWh) MGO 180 174,03 173 176
Input Power (KW) 2,05 1,98 1,97 2,00
Can be seen the calculation results in the table above, the largest engine efficiency is at the time of slow steaming or 85% load from the normal load that is equal to 50.8%.
IV.4.2 Auxiliary Consumption Calculation
To calculate the total of auxiliary engine fuel consumption for each engine load are by using the following formula:
FC = P x SFOC x t Where,
FC = Fuel Consumption
P = Power developed in kilowatt
SFOC = Specific fuel oil consumption (gr/kwh) t = Auxiliary engine operation time
When sailing conditions, auxiliary engine load is at 75%. The first step to calculate the consumption of auxiliary engines in February 2017 by multiplying the number of auxiliary engine output at 75% load with the specific fuel oil consumption (SFOC) on the auxiliary engine test record and also by multiplying with the total time spent when shipping and at port.
Table 4.9 Auxiliary Consumption Calculation
SSS ESS SS FS
Shipping time (hours) 231,7 202,7 194,1 183,8
Port Time (hours) 384 384 384 384
1 AE. FC (g/month) 65783749,65 62684151,88 61768307,09 60664565,66 2 AE. FC (g/month) 131567499,3 125368303,8 123536614,2 121329131,3
FC (ton/month) 131,57 125,37 123,54 121,33
IV.4.4 Operational Cost
IV.4.4.1 Port Cost
In this thesis the port cost calculation using two port pricing reference. For the port of Tanjung Priok and port of Tanjung Perak are using port of Tanjung Perak rates because it is assumed to be the same as including part of Pelindo III. Whereas for the port of Bitung and port of Gorontalo are using port of Makassar rates because it is assumed to be the same as including part of Pelindo IV. For rate service at port of Tanjung Perak Surabaya and rate service at port of Makassar are contained on Attachment A. at the end of this thesis.
To get the total port cost is by summing the rate of anchorage service, pilotage services, tugboat services and mooring services at each ports. As for the time of anchorage and port activity are contained in Table 4.10. Then in the calculation of port cost for MV. Meratus Medan 1 in February 2017 there are 7 ports that visited are :
a. Port of Jakarta (1701S/SUB-JKT) b. Port of Surabaya (1702N/JKT-SUB) c. Port of Bitung (1702N/SUB-BIT) d. Port of Gorontalo (1702S/BIT-GTO) e. Port of Surabaya (1702S/GTO-SUB) f. Port of Jakarta (1702S/SUB-JKT) g. Port of Surabaya (1703N/JKT-SUB)
Table 4.10 Port activities summary report in February 2017
No. Voyage Number Vessel
Route Port
Anchorage Time (hours) Port Activity Time (hours)
1 (1701S/SUB-JKT) SUB-JKT Port of Jakarta 0 22,9 2 (1702N/JKT-SUB) JKT-SUB Port of Surabaya 33,3 27 3 (1702N/SUB-BIT) SUB-BIT Port of Bitung 0 42,1 4 (1702S/BIT-GTO) BIT-GTO Port of Gorontalo 1,4 52 5 (1702S/GTO-SUB) GTO-SUB Port of Surabaya 8,5 117,3 6 (1702S/SUB-JKT) SUB-JKT Port of Jakarta 3,9 12,6 7 (1703N/JKT-SUB) JKT-SUB Port of Surabaya 17,1 35,3
Source: PT. Meratus Line
1. Port of Jakarta (1701S/SUB-JKT)
Jakarta is 0 hour then no anchorage service fee. While the length of time for mooring services is 22.9 hours which means included in 1 etmal (1 etmal = 24 hours). For pilotage services, 4 times movement to enter the port and 4 times the movement to get out from the port area. While for the tugboat services use 2 units of tugboat for 1 hour.
Table 4.11 Calculation of cost at Port of Jakarta (1701S/SUB-JKT)
1. Anchorage Services
Rates Rp. 112,00 GT/10 days
Rp. -
2. Pilotage Services
Fixed Rates Rp. 225.000 ship/movement Rp. 900.000 Variable Rates Rp. 45 GT/movement Rp. 2.390.580 Total (225.000 x 4 + (45 x 13281 x 4)) x 2 Rp. 6.581.160
3. Tugboat Services
Fixed Rates Rp. 1.443.149,00 unit / hour Rp. 2.886.298,00 Variable Rates Rp. 30,00 GT/hour Rp. 398.430,00 (1.443.149 x 2unit x1hour+(30 x 13281 x 1)x2 Rp. 6.569.456
4. Mooring Services
Rates Rp. 116 GT/Etmal
116 x 13281 x 1 Rp. 1.540.596
TOTAL Rp. 14.691.212
Can be seen the port services cost calculation in the table above, the total port cost at port of Tanjung Priuk Jakarta is Rp. 14.691.21 . The total cost in port of Tanjung Priuk Jakarta is the total sum of pilotage service Rp.6.581.160, tugboat service Rp. 6.569.456 and mooring service RP.6.569.456 while for anchorage service there is no anchorage service in this voyage.
2. Port of Surabaya (1702N/JKT-SUB)
port area. While for the tugboat services use 2 units of tugboat for 1 hour. The following table is the calculation for port cost at Port of Surabaya:
Table 4.12 Calculation of cost at Port of Surabaya (1702N/JKT-SUB)
1. Anchorage Services
Rates Rp. 112,00 GT/10 days
112 x 13281 Rp. 1.487.472
2. Pilotage Services
Fixed Rates p. Rp. 225.000 ship/movement Rp. 900.000 Variable Rates Rp. 45 GT/movement Rp. 2.390.580 Total (225.000 x 4 + (45 x 13281 x 4)) x 2 Rp. 6.581.160
3. Tugboat Services
Fixed Rates Rp. 1.443.149,00 unit / hour Rp. 2.886.298,00 Variable Rates Rp. 30,00 GT/hour Rp. 398.430,00 (1.443.149 x 2unit x1hour+(30 x 13281 x 1)x2 Rp. 6.569.456
4. Mooring Services
Rates Rp. 116 GT/Etmal
116 x 13281 x 2 Rp. 3.081.192
TOTAL Rp. 17.719.280
From the above table can be concluded that, the total port cost at port of Tanjung Perak Surabaya is Rp. 17.719.280 . The total cost of port of Tanjung Perak Surabaya is the total sum of anchorage services Rp. 1.478.472, pilotage services Rp 6.581.160, tugboat services Rp. 6.569.456 and mooring services RP. 3.081.192.
3. Port of Bitung (1702N/SUB-BIT)
Table 4.13 Calculation of cost at Port of Bitung (1702N/SUB-BIT)
1. Anchorage Services
Rates Rp. 85,36 GT/10 days
Rp. -
2. Pilotage Services
Fixed Rates Rp. 67.265 ship/movement Rp. 269.060 Variable Rates Rp. 20,638 GT/movement Rp. 1.096.373 Total (67.265 x 4 + (20,638x 13281 x 4)) x 2 Rp. 2.730.866
3. Tugboat Services
Fixed Rates Rp. 1.299.100,00 unit / hour Rp. 2.598.200,00 Variable Rates Rp. 10,00 GT/hour Rp. 132.810,00 (1.299.100 x 2unit x1hour+(10 x 13281 x 1)x2 Rp. 5.462.020
4. Mooring Services
Rates Rp. 92,84 GT/Etmal
92,84 x 13281 x 2 Rp. 2.466.016
TOTAL Rp. 10.658.902
Can be seen the port services cost calculation in the table above, the total port cost at port of Bitung is Rp. 10.658.902. The total cost in port of Bitung is the total sum of pilotage service Rp. 2.730.866, tugboat service Rp.5.462.000 and mooring service RP. 2.466.016 while for anchorage service there is no anchorage service in this voyage.
4. Port of Gorontalo (1702S/BIT-GTO)
Table 4.14 Calculation of cost at Port of Gorontalo (1702S/BIT-GTO)
1. Anchorage Services
Rates Rp. 85,36 GT/10 days
85,36 x 13281 Rp. 1.133.666
2. Pilotage Services
Fixed Rates Rp. 67.265 ship/movement Rp. 269.060 Variable Rates Rp. 20,638 GT/movement Rp. 1.096.373 Total (67.265 x 4 + (20,638 x 13281 x 4)) x 2 Rp. 2.730.866
3. Tugboat Services
Fixed Rates Rp. 1.299.100,00 unit / hour Rp. 2.598.200,00 Variable Rates Rp. 10,00 GT/hour Rp. 132.810,00 (1.299.100 x 2unit x1hour+(10 x 13281 x 1)x2 Rp. 5.462.020
4. Mooring Services
Rates Rp. 92,84 GT/Etmal
92,84 x 13281 x 3 Rp. 3.699.024
TOTAL Rp. 13.025.577
From the above table can be concluded that, the total port cost at port of Gorontalo is Rp. 13.025.577. The total cost of port of Tanjung Perak Surabaya is the total sum of anchorage services Rp. 1.133.666, pilotage services Rp 2.730.866, tugboat services Rp. 5.462.020 and mooring services RP. 13.025.577.
5. Port of Surabaya (1702S/GTO-SUB)
Table 4.15 Calculation of cost at Port of Surabaya (1702S/GTO-SUB)
1. Anchorage Services
Rates Rp. 112,00 GT/10 days
112 x 13281 Rp. 1.487.472
2. Pilotage Services
Fixed Rates p. Rp. 225.000 ship/movement Rp. 900.000 Variable Rates Rp. 45 GT/movement Rp. 2.390.580 Total (225.000 x 4 + (45 x 13281 x 4)) x 2 Rp. 6.581.160
3. Tugboat Services
Fixed Rates Rp. 1.443.149,00 unit / hour Rp. 2.886.298,00 Variable Rates Rp. 30,00 GT/hour Rp. 398.430,00 (1.443.149 x 2unit x1hour+(30 x 13281 x 1)x2 Rp. 6.569.456
4. Mooring Services
Rates Rp. 116 GT/Etmal
116 x 13281 x 5 Rp. 7.702.980
TOTAL Rp. 22.341.068
Can be seen the port services cost calculation in the table above, the total port cost at port of Tanjung Perak Surabaya is Rp. 22.341.068 . The total cost at port of Tanjung Perak Surabaya is the total sum of anchorage services Rp. 1.478.472, pilotage services Rp 6.581.160, tugboat services Rp. 6.569.456 and mooring services RP. 7.702.980.
6. Port of Jakarta (1702S/SUB-JKT)
Table 4.16 Calculation of cost at Port of Jakarta (1702S/SUB-JKT)
1. Anchorage Services
Rates Rp. 112,00 GT/10 days
112 x 13281 Rp. 1.487.472
2. Pilotage Services
Fixed Rates p. Rp. 225.000 ship/movement Rp. 900.000 Variable Rates Rp. 45 GT/movement Rp. 2.390.580 Total (225.000 x 4 + (45 x 13281 x 4)) x 2 Rp. 6.581.160
3. Tugboat Services
Fixed Rates Rp. 1.443.149,00 unit / hour Rp. 2.886.298,00 Variable Rates Rp. 30,00 GT/hour Rp. 398.430,00 (1.443.149 x 2unit x1hour+(30 x 13281 x 1)x2 Rp. 6.569.456
4. Mooring Services
Rates Rp.