HOW TO SOLVE SUPPLY BOTTLENECK IN AGRICULTURAL SECTOR Pantjar Simatupang, I Wayan
HOW TO SOLVE SUPPLY BOTTLENECK IN
AGRICULTURAL SECTOR
1)Pantjar Simatupang, I Wayan Rusastra, and Mohamad Maulana
Center for Agro Socioeconomic Research and Development (ICASERD) Jl. A. Yani 70 Bogor
INTRODUCTION
Although its contribution on GDP creation continues declining, agricultural sector remains to be utmost important. Of in particular its roles on employment creation, poverty alleviation, and national food security enhancement. The last three may be the most critical issues faced by Indonesia now and some years to come. In Indonesia in 2002, unemployment rate was still very high; open unemployment 9.0 percent or 9,132 million persons and underemployment 31.17 percent or 31,411 million persons. Poverty incidence is also still very high. In 2002, the poverty incidence was 18.2 percent or 38.4 million persons. Most of the unemployed or underemployed are poor people, live in rural areas and are dependent on agriculture for their living. Food security, especially of its self-reliance, is also a pressing problem for Indonesia.
Increasing agricultural production, food stuffs in particular, is clearly directly contributing to enhancing national food security. Many studies have shown that agricultural growth is the most effective one among all sector in the economy for employment creation and poverty alleviation (Islam and Nazara, 2000; Sumarto and Suryahadi, 2004; Simatupang and Dermoredjo, 2003). Higher agricultural growth is beneficial for improving over all economic growth. Promoting high and sustainable agricultural production growth may be the most appropriate strategy to achieve the three top priority of national development objectives: reducing unemployment, eradicating poverty, and achieving self-reliance based national food security.
But statistics have shown that agricultural productions, of almost all commodities, have been slowing down in recent years. This raises some questions to answer. What are the profiles of production growth of the major agricultural commodities, their rate and sources, over time? What are the constraints, opportunities and policies to revitalize and or accelerate the commodity production growth? These all are basically supply side questions of agricultural commodities.
AKP. Volume 2 No. 4, Desember 2004 : 369-392
This paper reviews the supply side issues. The commodity coverage encompassing food, horticulture and estate crops which are all land based production. Production growth rate is computed and decomposed by its sources: harvested area (land size and cropping intensity), and yield. The constraints are identified as those related to the sources of the commodity production. The constraints may also include product distribution abstracts as well as unavailability of incentives that determine willingness to produce. It is in this sense the focus are supply constraints rather than just production constraints.
ORGANIZATIONAL FRAMEWORK
Supply constraints include production and distribution constraints. They may be micro (individual specific) or macro constraints, as well as direct and indirect constraints. The constraints are numerous and complex. In this review, the discussion is focused on some macro constraints which are considered of high important and can be addressed with some appropriate government policies. The framework on identifying the constraints is summarized in Figure 1.
By computation, production is harvested area times yield. Production growth, then, can be decomposed into two sources, harvested area and yield growths:
Q = A Y
gQ = gA + gY ...(1)
Q = production A = harvested area Y = yield
g = growth
For commodity which can be harvested more than once per year, e.q. rice, harvested area can be computed as arable land size times cropping intensity. The sources of production growth can be further decomposed into arable land size, cropping intensity, and yield:
gQ = gLS + gCI + gY……….. ...(2)
LS = arable land size CI = cropping intensity
AKP. Volume 2 No. 4, Desember 2004 : 369-392
Distribution constraints will be proxied with price margin of the respective commodity. Large and increasing price margin can be interpreted that the commodity is plaqued with distribution constraints. This may caused by market failures, policy failures, or limitations of some marketing related infrastructure. Discussion will be continued on strategy and policy options to deal with the identified constraints.
DOES THE AGRICULTURAL SECTOR FACE SUPPLY CONSTRAINTS?
Aggregate Production (Gross Domestic Product)
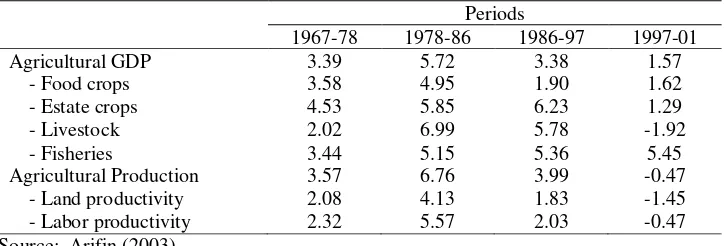
Let us first check agricultural production profile at aggregate level based on the trend of GDP and aggregate production index as shown in Table 1. Agricultural GDP and aggregate production have consistent trend. Both were having increasing growth during the 1967 – 1986 and then experienced an accelerated declining growth rate. Their peak were in 1978–1986. This was the period when the government had sufficient resources (from both oil revenue and foreign assistant). The government was wisely spent a large portion of its budget to support agricultural development especially for large investments in estate and food crop subsectors. The government developed extensive infrastructure and land development. This huge investment was also complemented with development of massive supporting institutions, such as extension service and rural cooperatives, concessional credits and price incentives.
Table 1. Growth Rates of Agricultural GDP and Aggregate Production, 1967-2001 (%/Year)
Periods
1967-78 1978-86 1986-97 1997-01
Agricultural GDP - Food crops - Estate crops - Livestock - Fisheries
3.39 3.58 4.53 2.02 3.44
5.72 4.95 5.85 6.99 5.15
3.38 1.90 6.23 5.78 5.36
1.57 1.62 1.29 -1.92
5.45 Agricultural Production
- Land productivity - Labor productivity
3.57 2.08 2.32
6.76 4.13 5.57
3.99 1.83 2.03
-0.47 -1.45 -0.47 Source: Arifin (2003)
HOW TO SOLVE SUPPLY BOTTLENECK IN AGRICULTURAL SECTOR Pantjar Simatupang, I Wayan
Consistent with GDP, the aggregate agricultural production growth rate was increasing during the 1967 – 1986 period and reached its peak in 1978 – 1986. Since 1986, the growth rate declined sharply and even was negative in 1997 – 2001. The accelerated declining of both GDP and aggregate production growth rates can be considered as strong indication that the agricultural sector has been facing an increasingly tighter production constraints. We suspect that the agricultural sector is now at the edge of persistent low growth or muddle through situation.
The persistent very low agricultural growth rate is really an alarming problem. Of in particular is food crops subsector which grew less than 2 percent per year since 1986-97 period. Estate food crop subsector growth rate that suddenly dropped from its astonishing record at 6.23 percent per year in 1986-1997 to only 1.29 percent per year in 1986-1997-2001 period should also be of our great concerned. Worst yet, the livestock subsector that achieved the historical highest ever growth rate among the agricultural subsectors experienced contraction in 1997-2001. This past five years may be the worst record of agricultural performance since early 1970’s.What is wrong in the agricultural sector ?.
From Table 1 we can also see that the main source of production growth during the 1967-1986 period was productivity. This is especially true during the peak growth period in 1978-1986. Productivity growth rate dropped drastically during the 1986-1997 and was even negative during the 1997-2001. We may say that the present persistently low agricultural growth rate was due to declining productivity, both land and labor productivity. Why the agricultural sector plaque with land productivity regression syndrom? This can happen because agricultural resource base has been degradating while technology was saturated.
A more rigorous study conducted by Fuglie (2003) confirms the growth pattern. During the 1990-2000 period, land productivity contracted by 0.9 percent per year, dropped from growing at 2.6 percent per year during the 1968-1992 period. Labor productivity growth dropped from 3.1 percent per year during the 1993-2003. He found that the sharp dropped in agricultural growth rate during the 1993-2000 period was due to sharp dropped of both total utilized input, slowed down from 2.4 percent per year in the 1968-1992 periode to 1.0 percent per year during the 1993-2000 period, and total factor productivity that slowed down from growing at 2.2 percent per year during the 1968-1992 to only at 0.1 percent per year during the 1993-2000 period.
AKP. Volume 2 No. 4, Desember 2004 : 369-392
Commodity Production
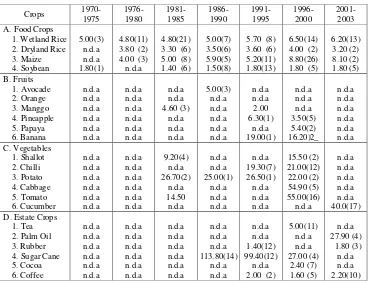
Some more revealing explanations about the seemingly persistent stagnation of the agricultural production can be obtained by analyzing commodity production growth profiles. Since agricultural commodities are numerous, it is too burden some to cover all commodities in this review. Some major commodities representing food crops, vegetables, fruits and estate crops have been chosen. Our focus is land based agriculture, excluding livestock and fisheries.
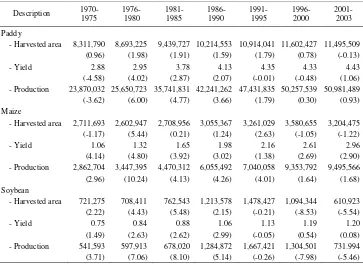
Paddy (rice), maize and soybean are chosen to represent food crops. The growth production patterns of the three major food crops were very much similar, just like the food crop sub sector GDP, they accelerated during the second half of the 1970’s to the first half of the 1980’s and then decelerated rapidly. Since mid 1980’s the food crop production has been trapped in a peristently low growth rate (Table 2). Rice only grew at rate of less than one percent per year, far below the population growth rate at 1.63 percent per year. Maize production growth rate was about equal to the population growth rate. The worst was soybean performance which has been contracting rapidly since early 1990’s. Clearly, food crop productions have been growing far behind their demand. They must have been facing stiff supply constraints since mid 1980’s.
Table 2. Trend of Harvested Area (Ha), Yield (Ton/Ha) and Production (Ton) for Food Crops in Indonesia, 1970-20031)
Description 1970-1975 1) Figure in parenthesis are the annual growth rate of harvested area, yield or production.
HOW TO SOLVE SUPPLY BOTTLENECK IN AGRICULTURAL SECTOR Pantjar Simatupang, I Wayan
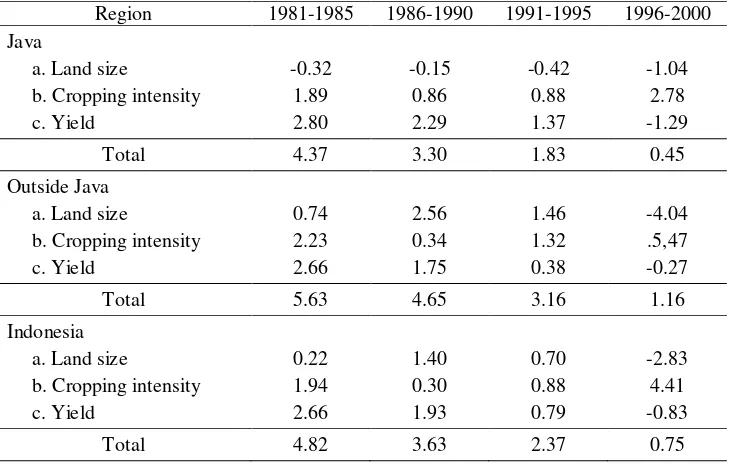
If we look at the sources of the food crop production growths, we clearly see that the common reasons for the emerging decelerating growth phenomenon since early 1990’s are: (1) deceleration leading to contraction of harvested area, and (2) yield deceleration leading to stagnation of land productivity (yield). For food crops that have short age to maturity, the harvested area arises from both arable land size and cropping intensity. The decelerating harvested area, thus, can be due to both arable land size or cropping intensity deceleration. Unfortunately, we do not have data available to compute cropping intensity except for wetland (sawah) rice. Further decomposition of the rice production produced from the wetland rice field (sawah) should give more revealing explantions about the production constraints (Table 3).
Table 3. Sources of Wetland Rice Production Growth in Indonesia, 1981-2000
Region 1981-1985 1986-1990 1991-1995 1996-2000
Java
a. Land size
b. Cropping intensity c. Yield
-0.32 1.89 2.80
-0.15 0.86 2.29
-0.42 0.88 1.37
-1.04 2.78 -1.29
Total 4.37 3.30 1.83 0.45
Outside Java a. Land size
b. Cropping intensity c. Yield
0.74 2.23 2.66
2.56 0.34 1.75
1.46 1.32 0.38
-4.04 .5,47 -0.27
Total 5.63 4.65 3.16 1.16
Indonesia a. Land size
b. Cropping intensity c. Yield
0.22 1.94 2.66
1.40 0.30 1.93
0.70 0.88 0.79
-2.83 4.41 -0.83
Total 4.82 3.63 2.37 0.75
It is interesting to note that the wet land rice field (sawah) in Java has been decelerating since early 1980’s. The whole source of the growth of rice harvested area in Java came from cropping intensity that increased rapidly, out compensate the declining land size. In outside Java, the wetland paddy field accelerated in 1980’s, and then decelerated in 1990’s. Since mid 1990’s, arable wetland paddy field has been declining both in Java and outside Java. Since the 1990’s, the sole source of rice production growth has been cropping intensity.
AKP. Volume 2 No. 4, Desember 2004 : 369-392
productivity). The sole source of rice production growth since mid 1990’s has been cropping intensity. This conclusion may very well be valid for many other food crops with short age to maturity, such as, maize, beans, peanuts, etc., since they also mostly planted in wetland paddy field.
This is really an alarming problem. The cropping intensity potential is quite limited and very difficult to expand. It can be saturated very fast. Since both land size and productivity continue declining, it is realistic to predict that the present persistent stagnation of food crop production will be worsening in the future. This may cause devastative blow not only to the agricultural sector, but also to rural economies and to the whole Indonesian economy as well. This very critical problem calls for an immediate and decisive policy response from the government.
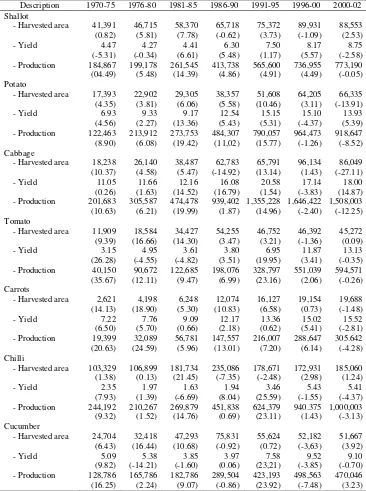
Production performance of vegetable crops was really spectacular during 1970 to mid 1990’s. Some crops even enjoyed double digits production growth rate. But in second half of the 1990’s, the growth rates of all the vegetable crops dropped drastically and continued decelerating. During the 2000 – 2001 the vegetable production growth rates almost all negative, except for cucumber. Again, the unmediate causes of the decelerating production growth phenomen are either stagnant or declining of both harvested area and yield (Table 4).
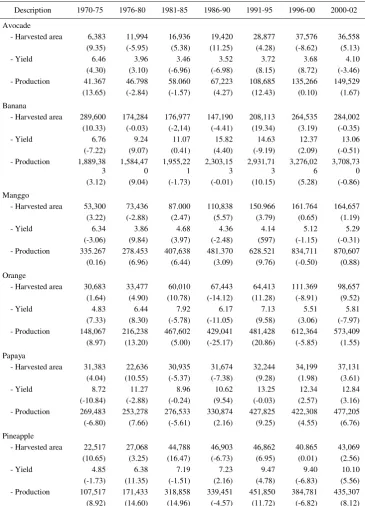
The fruit production growth rates are generally highly fluctuative. Like vegetable production, fruit productions declined significantly in the second half of 1990’s (Table 5). The best performance of fruit production was in the first half of the 1990’s. The fruit production performance in recent years was generally poor. Again, the main reasons are either stagnation or decelerating of both harvested area and yield.
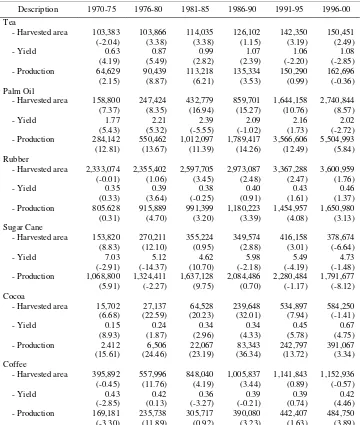
Estate crops production performance varies by commodities. The best performance achieved by palm oil and cocoa which grew consistent at double digits rates during the 1970-1995 period. The major source of the production growth was harvested area. As a whole, the estate crop productions decelerated since early 1990’s (Table 6). The primary reasons are the sharp declining of harvested area growth rates combined with stagnant or declining yield.
HOW TO SOLVE SUPPLY BOTTLENECK IN AGRICULTURAL SECTOR Pantjar Simatupang, I Wayan
Table 4. Trend of Harvested Area (ha), Yield (ton/ha) and Production (ton) for Vegetables in Indonesia, 1970-20021)
Description 1970-75 1976-80 1981-85 1986-90 1991-95 1996-00 2000-02 Shallot 1) Figure in parenthesis are the annual growth rate of harvested area, yield or production.
AKP. Volume 2 No. 4, Desember 2004 : 369-392
Table 5. Trend of Harvested Area (ha), Yield (ton/ha) and Production (ton) for Fruits in Indonesia, 1970-20021)
Description 1970-75 1976-80 1981-85 1986-90 1991-95 1996-00 2000-02
Avocade 1) Figure in parenthesis are the annual growth rate of harvested area, yield or production.
HOW TO SOLVE SUPPLY BOTTLENECK IN AGRICULTURAL SECTOR Pantjar Simatupang, I Wayan
Table 6. Trend of Harvested Area (ha), Yield (ton/ha) and Production (ton) for Estate Crops in Indonesia, 1970-20001)
Description 1970-75 1976-80 1981-85 1986-90 1991-95 1996-00 Tea Sugar Cane
- Harvested area 1) Figure in parenthesis are the annual growth rate of harvested area, yield or production.
Source: Basic data from CBS, Jakarta (various years).
Distribution Constraints
AKP. Volume 2 No. 4, Desember 2004 : 369-392
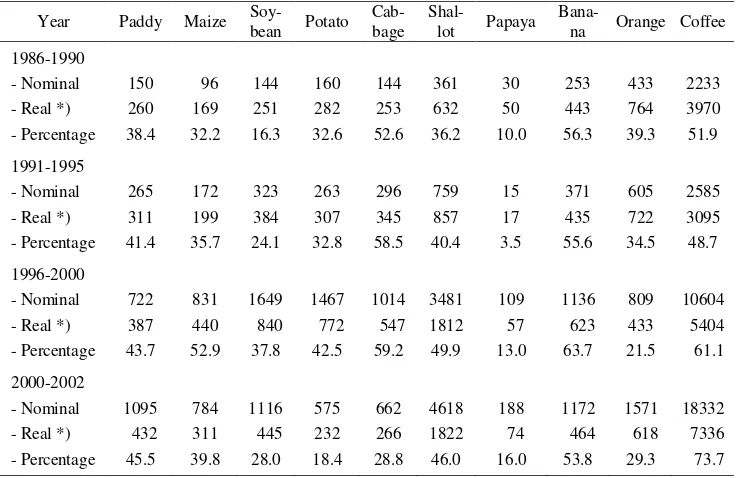
reflective distributional efficiency. More stringent distribution constraints should be reflected in higher or increasing price margin. Price margin in percentage is comparable between commodities, whereas its real value is comparable overtime for the same commodity. The price margin for some agricultural commodities are presented in Table 7.
Table 7. Price Margin of Agriculture Commodities in Indonesia, 1986 - 2002 (Rp/kg)
Year Paddy Maize Soy-- Percentage
150 - Percentage
265 - Percentage
722 - Percentage
1095 Source: Producers and Consumers Statistics (various year)
*) Deflated by consumer price index.
During the 1986-2000 period, the price margins were large (except for papaya). Not only large, the price margins grew with an accelerating rate. The growing price margins, then showed reversal trend or decelerated in 2000 – 2002 period. The real value and the percentage price margins declined significantly for some commodities such as maize, soybean, potato, cabbage and banana. Although continued increasing, the growth rates of the price margins were declining for those commodities.
HOW TO SOLVE SUPPLY BOTTLENECK IN AGRICULTURAL SECTOR Pantjar Simatupang, I Wayan WHAT ARE THE ROOTS OF THE PROBLEMS ?
We have find that the agriculture has, indeed, been facing some stringent supply constraints both in production and distribution systems. The general production constraints are land availability and land productivity stagnation. Distribution systems remain inefficient as shown by large price margins, and for some commodities the margins tend increasing. This reflects a high transaction cost of the agricultural commodities. These conclusions are too general for formulating appropriate and workable policy responses. We must identify the root causes of the constraints
Declining arable land
The fact that available land availability is the most stringent constraint for Indonesian agriculture should not be a surprise. Available potential agricultural land is fixed by nature, its conversion to arable land is costly whereas its conversion to non agriculture functions continues accelerating due to both high population growth, income growth and rapid development of hand demanding infrastructures, economic and social facilities.
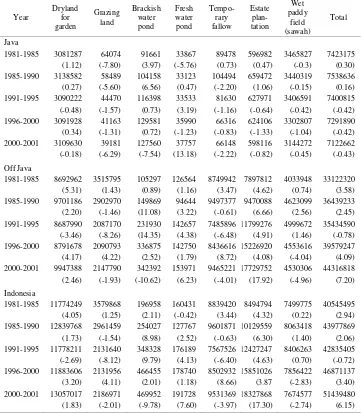
Overall for Indonesia, total agriculture land still continued increasing, except in 1991 – 1995 period. But this was only true for outside Java. Total agricultural land in Java has been declining with an increasing rate since early 1990’s, while in outside Java is accelerating except in 1991 - 1995 period. Agricultural land in Java is known best for food crops. Land productivity and land use intensity in Java are higher than in outside Java. This regional pattern of growth of agricultural land must imply significant change in regional structure of Indonesia agriculture. The future growth of Indonesian agriculture will be in outside Java. The historical dominant role of Java in food production will be fading gradually.
The decelerating trend of total agriculture land is fairly reasonable. In one hand, potential agricultural land for new land expansion is only available in outside Java. On the other hand, agricultural land conversion to other functions will continue accelerating both in Java and outside Java. The pace of the agricultural land conversion is much faster in Java particularly due to its faster expansion of land demanding infrastructure development, urbanization and industrial complexes. These can be considered natural forces that will always be there as long as the economy grows and expands and the population increases (Simatupang and Irawan, 2002; Simatupang, et al., 2002). Agricultural land conversion, particularly in Java, will continue accelerating.
AKP. Volume 2 No. 4, Desember 2004 : 369-392
land for rice farming. It can also be used for other food and vegetable crops. It can be used for multiple cropping per year. The declining wet land area is the main reason for the decelerating growth of harvested area of rice, and other food crops, and some horticultural crops which can also be planted in that land.
Table 8. Trend of Agriculture Land Size in Indonesia, 1981 – 2001 (Ha)1)
Year 1) Figure in parenthesis are the annual growth rate.
Source: Statistical Year Book (various year).
HOW TO SOLVE SUPPLY BOTTLENECK IN AGRICULTURAL SECTOR Pantjar Simatupang, I Wayan
in mid 1990’s. In Java, however, the dry land has been declining since early 1990’s, due to conversion for other types or agricultural land and non-agriculture functions. Significant portion of the dry land expansion in outside Java has been the results of agricultural development through transmigration program.
Total land allocated for estate crops continued increasing with a very high growth rate. The growth rate was slowing down during the 1990’s but it was seeming accelerated again in early 2000’s. Regionally, the gain in land plantation wholly occurred in outside Java. In fact in Java, land for plantation has been continuously declining sice early 1990’s. The rapid development of estate crops area in outside Java was largely the results of heavy government investments through its Nuclear Estate development program and private corporate investment with concessional credit facilities from the government.
For the future, agricultural land in Java will continue decelerating. For one hand, new agricultural land development is impossible because the potential has been exhausted. On the other hand, land conversion to non agriculture will continue accelerating along with population and economic development. This can be considered as natural phenomenon which can not be stopped, but may be control able to slow the pace of its deceleration and to smoothen its impacts.
The remaining hope is expansion of agricultural land development in outside Java where the potential for new land development is still quite large. The most stringent obstacles are lacking of infrastructures, transportation systems, electricity, etc., and capital investments. Government direct involvement and facilitation for private investment is necessary for reversing the decelerating trend of agriculture land.
Lacking of technological innovations
Most agricultural crops have faced either land productivity deceleration or stagnation since the second half of the 1980’s. This can be explained by either lacking of land enhancing technological innovation and or land quality degradation. The lacking of land enhancing technological innovation can be further broken down to either lacking of technological break through at research and development (R & D) level, technological dissemination bottleneck between R & D institutions and farmers, and sub-optimal technological practice.
Research and development (R & D)
AKP. Volume 2 No. 4, Desember 2004 : 369-392
reason why land productivity of almost all non food crop productions remain low and tend decelerating (Table 9).
Even for food crops, the main focus of the public R & D, there has been seemingly saturation in technological break through. Based on yield potential, there has been no significant R & D break through since mid 1990’s. This is true for all agricultural crops. We may conclude, recession in R & D systems is one of the critical bottleneck of the agriculture supply.
Table 9. Average Yield Potential of New High Yielding Varieties (NHYV) in Indonesia, 1970-2003 (ton/ha)
Crops
1970-1975 C. Vegetables
1. Shallot D. Estate Crops
1. Tea Source: National Seeds Agency (various year)
Figure in parenthesis is the number of varieties.
Technology delivery systems
HOW TO SOLVE SUPPLY BOTTLENECK IN AGRICULTURAL SECTOR Pantjar Simatupang, I Wayan
The government has developed an integrated rice technology delivery systems during the 1970 to late 1980’s period. For seed multiplication, the government built seed production centers at provincial level. An integrated national extension service was also developed by building field extension offices (Balai Penyuluhan Pertanian) in all sub districts (kecamatan) and asssigning field extension servants (Penyuluh Pertanian Lapangan) for all villages. The government also developed village cooperatives to distributes all farm inputs in village level. The overall system is centrally coordinated by the so called Mass Guidance Coordinating Board (Bimbingan Massal = BIMAS), headed by the President at national level, Governor at provincial level, Bupati at district level, Camat at sub-district level and Village chief at village level. This centralized command system was proven quite effective in delivering input embodied technologies from research institutes to farmers.
But now, the technology delivery systems has been deconstructed and become disarrayed. Extension service system decentralized and handed out to the district governments. This should theoretically good, but in reality the district governments are not all very supportive or capable of facilitating effective extension service. The Mass Guidance Organization was liquidated. Without government supports, the village cooperatives are mostly closed down. The government seed enterprises are losing their vitalities.
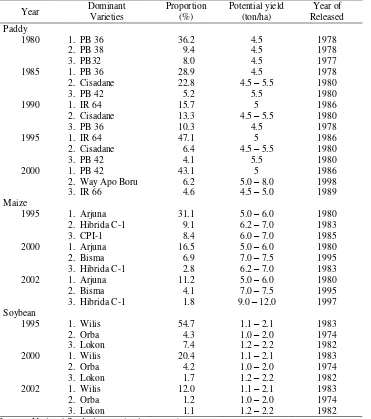
It can be said that the agricultural technology delivery systems are in disarrayed. This may be the reason why some newly developed technologies in the research institutes have never reached the farmers or it takes so long time to reach the farmers. Although there have been many newly released HYV of food crops, only few of them significantly used by the farmers. In fact, most farmers remain using the very old HYV’s (Table 10). For rice, IR-64 which was released in 1986 is still the most widely used by the farmers. For maize, the most widely used is Arjuna which was released in 1980. For soybean, the most widely used is Wilis which was released in 1983.
In addition to restraining innovation flows from R & D institutions to farmers, the disarrayed technology delivery systems may have caused declining supply of new knowledge and information at farm level which in turn causes sub optimal farm management. These technology, knowledge and information supply bottlenecks deserve immediate response from the government.
AKP. Volume 2 No. 4, Desember 2004 : 369-392
Table 10. Adoption Rate (planted area shaw) and Potential Yield of 1980 – 2002
Year Dominant
Varieties
Proportion (%)
Potential yield (ton/ha) Source: National Seeds Agency (various years)
Over intensification syndrome
HOW TO SOLVE SUPPLY BOTTLENECK IN AGRICULTURAL SECTOR Pantjar Simatupang, I Wayan
Many studies have found that Indonesian wetland has been plaqued with the over intensification or soil fatigue syndrome. The soil is now lacking of organic matters and micronutrients. The physical properties of the soil has also been degradating. All of these have caused long-term declining of land productivity.
The over intensification syndrome is not particular for Indonesia. It has been proven well spread in many other countries which widely adopted high input-high output HYVs (Pingali, Hossain, and Gerpacio, 1997). Perhaps, this is the reason why total factor productivity of the rice farming in Indonesia declining as found by Simatupang et al. (1995) and Sudaryanto et al. (2002). Not only declining land productivity (yield), the over intensification syndrome causes increasing production cost and hence declining farming competitiveness. The over intensification syndrome can be considered as a long-term threat to Indonesian rice farming sustainability.
Large and increasing number of small-scale family farms
Indonesian agriculture is dominated by large and increasing number of small scale family farms. Recent agricultural census indicated that in 2003 there were 25,437 million land-using farm households in Indonesia, 13,663 million or 56.7 percent of which were marginal farmers with less than 0.5 ha of land under their control. In 1993 the number of land-using farm households was 20,518 millions or was increasing at 1.8 percent per year, whereas the number of marginal farmers were 10,804 million or was increasing at 2.6 percent per year during the 1993 – 2003 period. In Java, the numbers of land-using farm households and the marginal farmers were growing at 1.5 percent and 2.4 percent per year respectively. Whereas in outside Java, the numbers of land-using farm households and marginal farmers were growing at 2.1 percent and 3.4 percent per year respectively (Table 11).
Table 11. Number and Growth Rate of Land-Using Household and Marginal Farmers in Indonesian, 1993-2002
Category
1993 2003
Java Outside Java
Indo-nesia Java
Outside Java
Indo-nesia 1. Number (million)
a. Marginal farmers 8,067 (69.8)
2,737 (30.6)
10,894 (52.7)
9,989 (74.9)
3,674 (33.9)
13,663 (56.5) b. Land-using households 11,564 8,954 20,518 13,336 10,841 24,176 c. Agricultural households 11,671 9,116 20,787 13,964 11,472 25,437 2. Growth rate 1993-2003
(%/year)
a. Marginal farmers 2.4 3.4 2.6
b. Land-using households 1.5 2.1 1.8
c. Agricultural households 2.0 2.6 2.2 Figures in parentheses are percent of land-using households
AKP. Volume 2 No. 4, Desember 2004 : 369-392
The statistics shows that population or employment pressure on agricultural land continued increasing. The growth rate of agricultural households much higher than the population that indicates the economy structural transformation turning point has not occurred in Indonesia. Consequently, the number of marginal farmers, and perhaps the landless laborers too, continued increasing with an accelerating rate. This trend is really worrisome. First, with very small size or inexistent of operated land, most of the marginal farmers and landless laborers must be poor. The Indonesian agriculture may be plagued with the so called poverty – food insecurity – land degradation triangle syndrome.
Second, a very small size of land operation is not conducive for progressive and efficient farm production. Land size smallness may prevent the farmers to quickly adopting new innovations which generally require high capital and have economies of scale to produce sufficiently large volume of outputs which necessary for efficient marketing as well as to acquire economic scale in input acquisition. Small farmers generally have higher cost of production (all inputs included) and lower output price, and hence lower profitability rate.
The increasing number of marginal farmers can be considered as increasingly stringent supply bottleneck. The root causes are the decelerating growth rate of agricultural land and the failure to reach the structural transformation tuning point of Indonesian macro-economy. The first may be considered as policy failure to promote investment in agricultural land development, whereas the second one is due to the failure of long-term over all economic development policies.
Declining government investments
Perhaps the most critical bottleneck of the Indonesian agricultural supply is declining trend of government expenditure (in constant price) for agricultural development during the 1995/96 – 2000 period for all categories. Total development budget of the Ministry of Agriculture in 2000 was only about one third of its value in 1995/96. The expenditure for agricultural extension has been declining since mid 1980’s. The most dramatic one is the fertilizer subsidy which declining very rapidly since mid 1980’s and then erased to zero in 1999. It was, however, reviewed again in 2003. Expenditure for agricultural research and development (R & D) was ups and down. It declined during the second half of the 1980’s, increased in the first half of the 1990’s, but then declined again in late 1990’s.
HOW TO SOLVE SUPPLY BOTTLENECK IN AGRICULTURAL SECTOR Pantjar Simatupang, I Wayan
are very instrumental for agricultural production (Mundlak, Larson and Butze, 2002, Fuglie, 2003).
Table 12. Government Expenditure for Agricultural Development, 1985/86 – 2000, 1993
Prices (Rp.1000)
Descriptions 1985/
1986*)
1990/ 1991
1995/
1996 2000**) 2002
Irrigation 801,790 969,848 982,237 227,330 378,435
Research and development 29,322 21,732 53,474 29,893 27,560
Extension / Training 36,060 35,270 25,956 14,194 12,424
Fertilizer subsidy 1,738,550 330,847 120,946 0 0
Min.Agriculture (excl.Fish, incl.Est)
284,550 314,235 479,130 144,804 424,405
* Budgeted
** 9 months realization Source: Ministry of Agriculture.
Besides for infrastructures, government expenditures for input subsidies, fertilizer in particular, declined very rapidly since mid 1980’s. This was part of the massive economic deregulation policies conducted by Indonesian government since 1983 and expanded and intensified in 1986. Clearly the sharp declining government subsidies also contributed to the sharp decline of agricultural production growth since late 1980’s. But, it should be noted since 2001, the allocated budget for agriculture increased dramatically. Is this a sign of sustainable policy reversal? We hope so. The rural value of government expenditures for agricultural R&D and extension, however, continued declining.
Farming incentives
Another agricultural promotion constraint is economic incentive, particularly input provision facilities and output price supports. Up to mid 1980’s the government provide many incentives for agricultural producers, rice farmers in particular. The incentives include input subsidies (fertilizers, seeds), price supports, subsidized credits, machineries provision for farmers groups, etc. As mentioned, since mid 1980’s the government has gradually reduced its supports for agricultural development. This includes reduction or stopping of its production incentives for farmers.
AKP. Volume 2 No. 4, Desember 2004 : 369-392
of agricultural production growth. But since 2001, the terms of trade increased significantly. One of the reasons may be the change in the government policy direction. In this past three years the government has repeatedly pledge to protect and promote the agricultural sector. The government has imposed import tariffs to support paddy and sugar prices. The government also revived the fertilizer subsidy. Effectiveness and sustainability of those policies remain to be seen in some years to come.
Table 13. Trend of farmer Terms of Trade in Java (1983 = 100) and Paddy-Fertilizer Price Ratio 1974-2002
Year Terms of trade in Java Paddy fertilizer price ratio
HOW TO SOLVE SUPPLY BOTTLENECK IN AGRICULTURAL SECTOR Pantjar Simatupang, I Wayan CONCLUSIONS
Indonesian agriculture performance is now in danger of being trapped in persistently low and decelerating growth rate. Major food productions, such as rice, maize and soybean, have been growing at a rate below the population growth rate, even some of them has been either stagnant or contracting since mid 1990’s. This is the reason why food commodity importations have been increasing in recent years that could endangers national food security.
Worst yet, the seemingly persistent decelerating agricultural production is not particular to major food commodities, but is also true for almost all agricultural commodities. The persistent decelerating growth is the general phenomenon for agricultural commodities. This is really an alarming problem that endangers the livelihood of the majority of Indonesian people, especially those in the poorest segment of the population. Indonesian agriculture is now in urgent need of emergency recovery supports from the government.
The supply constraints are very stringent and extensive. The major ones are the continued declining of wetland paddy field (sawah) area, declining of dry land area in Java, and decelerating growths of all types of agricultural land in outside Java. This land problem is aggravated by the seemingly stagnant or decelerating yield of all agricultural commodities. The root causes include both of natural factors and policy market failures. Our attention must be focused on the policy matters.
The policy related factors include declining of government investment on public infrastructure development, particularly irrigation, R&D, extension, stopping of investment facilities for new agricultural land development, and reduction of farming incentives. These within agricultural sector policy failures are aggravated by the overall economic development failure to achieve structural transformation failure which necessary to reduce population / employment pressure on agriculture.
AKP. Volume 2 No. 4, Desember 2004 : 369-392
REFERENCES
Arifin, B. 2003. Dekomposisi Pertumbuhan Pertanian Indonesia. Makalah disampaikan pada Seminar Khusus Puslitbang Sosek Pertanian, Bogor, 14 Nopember 2004.
Fuglie, K.O. 1999. Investing in Agricultural Productivity in Indonesia. Forum Penelitian Agro Ekonomi 17(2) : 1-16.
Fuglie, K.O. 2003. Productivity Growth in Indonesian Agriculture. CIP-ESCAP Regional Office, Bogor.
Islam, I and S. Nazara. 2000. Technical Note on the Indonesian Labour Market. International Labour Official-Jakarta, Indonesia.
Mundlak, Y., D.F. Larson, and R. Butze. 2003. Determinants of Agricultural Growth in Thailand, Indonesia and the Philippines. Discussion Paper No. 3.02, the Center for Agricultural Economic Research, the Hebrew University of Jerussalem. Pingali, O., M. Hossain, and R. Gerpacio. 1997. Asian Rice Bowls: The Returning Crisis
?. CAB International Wallingford, US.
Simatupang, P. dan B. Irawan. 2002. Pengendalian Konversi Lahan Pertanian: Tinjauan Ulang Kebijakan lahan Pertanian Abadi. Dalam U. Kurnia, F. Agus, D. Setyorini dan A. Setyanto. Prosiding Seminar Nasional Multifungsi dan Konversi Lahan Pertanian, hal. 67-83. Pusat Penelitian dan Pengembangan Tanah dan Agroklimat, Bogor.
Simatupang, P. dan S.K darmoredjo. 2003. Produksi Domestik Bruto, Harga dan
Kemiskinan: Hipotesis “Trickle Down” Dikaji Ulang. Ekonomi dan Keuangan
Indonesia, 51(3) : 291-324.
Simatupang, P. et.al. 1995. Projection and Policy Implications of Medium-and Long-Term
Rice Supply and Demand in Indonesia. Center for Agro Socio Economic Research, Bogor (Indonesia), in collaboration with International Food Policy Research Institutes, Washington (USA).
Simatupang, P., N. Syafa’at dan S. Mardianto. 2002. Alternatif Kebijakan Pengendalian Konversi Lahan. Sekretariat Dewan Ketahanan Pangan.
Sudaryanto, T., P. Simatupang, B. Irawan and D.K.S Sadra . 2002. Medium-and Long-term Prospect of Rice Supply and Demand in Indonesia. In M. Sombilla, M. Hossain, and B. Hardy (Eds), Development in the Asian Rice Economy, p. 97-125. International Rice Research Institute.
Primary determinants
R & D
Production base
Delivery Systems
Economic Incentives/ Policies
Irrigation
Land development
Land conversions
Adopted Technology
Cropping intensity
Arable land
Yield
Production
Harvested area
Distribution Supply at Consumers
Infrastructures and government policies