El e c t ro n ic
Jo ur
n a l o
f P
r o
b a b il i t y
Vol. 15 (2010), Paper no. 62, pages 1930–1937.
Journal URL
http://www.math.washington.edu/~ejpecp/
The maximum of Brownian motion minus a parabola
Piet Groeneboom
∗Abstract
We derive a simple integral representation for the distribution of the maximum of Brownian motion minus a parabola, which can be used for computing the density and moments of the distribution, both for one-sided and two-sided Brownian motion .
Key words:Brownian motion, parabolic drift, maximum, Airy functions. AMS 2000 Subject Classification:Primary 60J65,60J75.
Submitted to EJP on October 5, 2010, final version accepted October 28, 2010.
∗Delft University of Technology, Mekelweg 4, 2628 CD Delft, The Netherlands, [email protected];
1
Introduction
It is the purpose of this note to show how one can easily obtain information on properties of the distribution of the maximum of Brownian motion minus a parabola from Groeneboom (1989). In fact, Corollary 3.1 in that paper gives the joint distribution of both the maximum and the location of the maximum. In the latter paper most attention is on the distribution of the location of the maximum, which is derived from this corollary. The reason for the emphasis on the distribution of the location of the maximum is that this distribution very often occurs as limit distribution in the context of isotonic regression; one could say that it is a kind of “normal distribution" in that context. But one can of course also derive the distribution of the maximum itself from this corollary and at the same time deduce numerical information, as will be shown below.
Numerical information on the density, quantiles and moments of the location of the maximum is given in Groeneboom and Wellner (2001), which in turn relies on section 4 of Groeneboom (1985).
2
Representations of the distribution of the maximum
LetFcbe the distribution function of the maximum ofW(t)−c t2,t≥0, whereW is one-sided
Brow-nian motion (in standard scale and without drift). Then, according to Theorem 3.1 of Groeneboom (1989), Fchas the representation
Fc(x) =ψx,c(0), (2.1)
where the functionψx,c:R→R+has Fourier transform
ˆ
ψx,c(λ) =
Z ∞
−∞
eiλsψx,c(s)ds= π{Ai(iξ)Bi(iξ+z)−Bi(iξ)Ai(iξ+z)}
(2c2)1/3Ai(iξ) , (2.2)
and whereξ=2c2−1/3λ, andz= (4c)1/3x. It follows that the corresponding density fchas the
representation
fc(x) =φx,c(0)def= ∂
∂xψx,c(0), (2.3)
whereφx,c has Fourier transform
ˆ
φx,c(λ) =
Z ∞
−∞
eiλsφx,c(s)ds=π(4c)
1/3
Ai(iξ)Bi′(iξ+z)−Bi(iξ)Ai′(iξ+z)
(2c2)1/3Ai(iξ) , (2.4)
The (symmetric) densitygcof the maximumM ofW(t)−c t2, t∈R, whereW istwo-sidedBrownian
motion, originating from zero, therefore has the representation
gc(x) =2fc(x)Fc(x) =2φx,c(0)ψx,c(0) = 1 2π2
Z ∞
−∞ ˆ
ψx,c(u)du Z ∞
−∞ ˆ
φx,c(u)du,x >0, (2.5)
maxima have the same distribution. Interestingly, the situation is more complicated for thelocation
of the maximum!
Note that this gives the complete characterization of the distribution of the maximum of Brownian motion with parabolic drift. The purpose of this note, however, is to show how one can deduce useful numerical information from this.
The two fundamental solutions of the Airy differential equation are Ai and Bi which are unbounded on different regions of the complex plane. For the purpose of computing moments, etc., it is easier to only work with the solution Ai, so we want to get rid of Bi. To this end we simply use Cauchy’s formula.
We have the following lemma.
Lemma 2.1. Let Ncbe defined by
Nc=max
x≥0 ¦
W(x)−c x2©,
So Ncis the maximum for the one-sided case. Then the distribution function Fc=FN
c of Ncis given by:
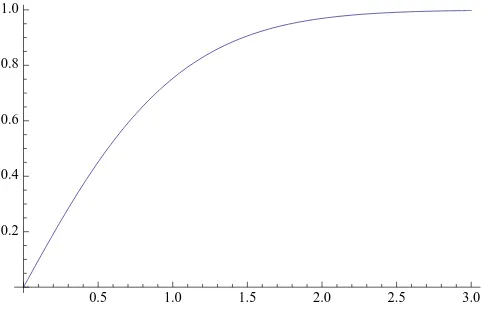
Fc(x) =1− Z ∞
(4c)1/3x
Ai(u)du−2 Re
(
e−iπ/6 Z ∞
0
Aie−iπ/6uAi(iu+ (4c)1/3x)
Ai(iu) du
)
, x>0.
One can use this representation to compute the distribution functionFc in one line in, for example,
Mathematica, and the result of this computation is shown below in Figure 1, where we takec=1/2.
0.5 1.0 1.5 2.0 2.5 3.0
0.2 0.4 0.6 0.8 1.0
Figure 1: The distribution functionFNc, forc=1/2.
Proof of Lemma 2.1. After the change of variablesu= (2c2)−1/3ξwe get for the corresponding distribution functionFc, still takingz= (4c)1/3x,
Fc(x) =
1 2
Z ∞
−∞
{Ai(iu)Bi(iu+z)−Bi(iu)Ai(iu+z)}
Ai(iu) du. (2.6)
Using
which is 10.4.9 in Abramowitz and Stegun (1964), we can write:
By Cauchy’s formula we can reduce the first integral on the right-hand side of (2.7) to:
Z ∞
0
Aiu+ze−2iπ/3du. (2.8)
Differentiation w.r.t.zyields:
e−2iπ/3
Again using Cauchy’s formula we can reduce the first integral on the right-hand side of (2.9) to:
Z ∞
0
Aiu+ze2iπ/3du. (2.10)
Differentiation w.r.t.zyields:
e2iπ/3 Z ∞
0
Ai′u+ze2iπ/3du=−e2iπ/3Aize2iπ/3.
So the derivative w.r.t.zof the sum of the two integrals (2.8) and (2.10) is given by
−e−2iπ/3Aize−2iπ/3−e2iπ/3Aize2iπ/3=Ai(z). (2.11)
For the latter relation, see (10.4.7) in Abramowitz and Stegun (1964).
Hencek=2/3 and
Note that this implies:
lim
The second term is given by
−e−iπ/6
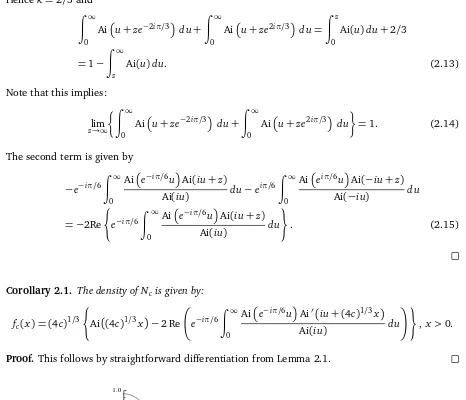
Corollary 2.1. The density of Nc is given by:
fc(x) = (4c)1/3
Proof. This follows by straightforward differentiation from Lemma 2.1.
0.5 1.0 1.5 2.0 2.5 3.0
Figure 2: The density fN
c, forc=1/2.
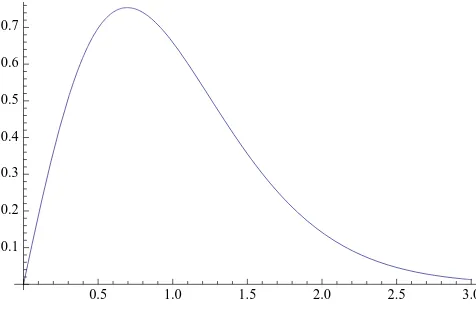
Corollary 2.2. The density gcof the maximum M of W(t)−c t2, t∈R, where W is two-sided Brownian motion, originating from zero, if given by
gc(x) =2fc(x)Fc(x), x>0,
where fcis given by Corollary 2.1 and Fcby Lemma 2.1.
A picture of the density fMc, forc=1/2 and two-sided Brownian motion, is given in Figure 3.
0.5 1.0 1.5 2.0 2.5 3.0
0.1 0.2 0.3 0.4 0.5 0.6 0.7
Figure 3: The density fM
c =gcof the maximum for two-sided Brownian motion andc=1/2.
3
Concluding remarks
The densities of the maximum and location of the maximum of Brownian motion minus a parabola were originally studied by solving partial differential equations. For example, if we denote the location of the maximum of two-sided Brownian motion minus the parabola y =t2 byZ, then the density ofZ is expressed in Chernoff (1964) in terms of the solution of the heat equation
∂
∂tu(t,x) =− 1 2
∂2
∂x2u(t,x),
forx ≤t2, under the boundary conditions
u(t,t2)def= lim
x↑t2u(t,x) =1, xlim↓−∞u(t,x) =0, t∈
R.
Ifu(t,x)is the (smooth) solution of this equation, the density fZ ofZ is given by
fZ(t) =1
2u2(−t)u2(t), x ∈R,
where (as in Groeneboom (1985)) the functionu2is defined by
u2(t) =lim
x↑t2
∂
The original computations of this density were indeed based on numerically solving this partial differential equation (as I learned from personal communications by Herman Chernoff and Willem van Zwet). However, it is very hard to solve this equation numerically sufficiently accurately for negative values of t, since we have, by (4.25) in Groeneboom (1985):
u2(t)∼c1exp¦−32|t|3−c|t|©,t → −∞,
wherec≈2.9458 . . . andc1≈2.2638 . . . .
At present the situation is drastically different, since we have much more analytical information about the solution and, moreover, can use advanced computer algebra packages. One only needs one line in Mathematica to compute the density fZ, since, by (3.8) in Groeneboom (1989), fZ is given by fZ(x) = 12φ(x)φ(−x) = 12u2(x)u2(−x), where:
φ(x) = 1 22/3π
Z ∞
−∞
e−iux
Ai(i2−1/3u)du,
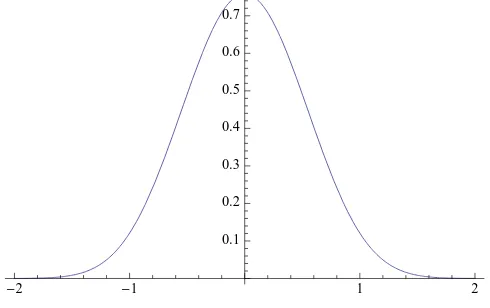
and where one can even allow the boundaries−∞ and∞in the numerical integration (in Math-ematica). A picture of the density fZ, obtained from just using this definition in Mathematica, is given in Figure 4.
However, if one wants to get very precise information about the tail behavior of the density or the behavior close to zero, it is better to use power series expansions or asymptotic expansions, which are different in a neighborhood of zero from the representation for large values of the argument. Details on this are given in Groeneboom (1985) and Groeneboom and Wellner (2001).
More details on the history of the subject are given in Perman and Wellner (1996) and Janson, Louchard and Martin-Löf (2010). In the latter manuscript also more details on the distribution of the maximum of Brownian motion minus a parabola are given. Their results seem to be in complete agreement with some numerical computations, based on the representations given in section 2.
-2 -1 1 2
0.1 0.2 0.3 0.4 0.5 0.6 0.7
Figure 4: The density fZ of the location of the maximum ofW(t)−t2, t∈R.
References
ABRAMOWITZ, M. AND STEGUN, I.E. (1964). Handbook of Mathematical Functions. National Bureau of
Standards Applied Mathematics Series No. 55. U.S. Government Printing Office, Washington, DC.
CHERNOFF, H.E. (1964)Estimation of the modeAnn. Statist. Math.,16, 85-99.
DANIELS, H.E. AND SKYRME, T.H.R. (1985) The maximum of a random walk whose mean path has a
maximum.Adv. Appl. Probab.,17, 85-99.
GROENEBOOM, P. (1985)Estimating a monotone density. InProceedings of the Berkeley Conference in
Honor of Jerzy Neyman and Jack Kiefer, II. L. M Le Cam and R. A. Olshen, editors, 535 - 555.
Wadsworth, Belmont.
GROENEBOOM, P. (1989) Brownian motion with a parabolic drift and Airy functions. Probab. Theory
Related Fields,81, 31-41.
GROENEBOOM, P.ANDWELLNER, J.A. (2001)Computing Chernoff’s distribution.Journal of Computational
and Graphical Statistics,10, 388-400.
JANSON, S., LOUCHARD, G. AND MARTIN-LÖF, A. (2010). The maximum of Brownian motion with a
parabolic drift. Submitted.
PERMAN, M. AND WELLNER, J.A. (1996) On the distribution of Brownian areas, The Annals of Applied
Probability, 6, 1091-1111.