Summary Steady-state photosynthetic responses to leaf temperature of 4-year-old Eucalyptus globulus Labill. and E. nitens (Deane and Maiden) Maiden trees were measured between 10 and 35 °C at approximately monthly intervals from early spring to midwinter. The photosynthetic temperature optimum of recently expanded leaves in the sun canopy was linearly related to the average temperature of the preceding week during the 9-month measurement period. The optimum temperature for net photosynthesis of E. globulus increased from 17 to 23 °C as the mean daily temperature increased from 7 to 16 °C. Similarly, the optimum temperature for net photo-synthesis of E. nitens increased from 14 to 20 °C as the mean daily temperature increased from 7 to 19 °C. The temperature for maximum photosynthetic response of E. globulus and E. nitens was similar at each measurement time, but the pho-tosynthetic performance of E. nitens was less sensitive to temperatures above and below this optimum than that of E. globulus. In December, the apical shoots of branches of E. globulus had a net photosynthetic temperature optimum of between 10 and 15 °C. The corresponding values for expanding leaves, fully expanded leaves from the current year’s growth, and fully expanded leaves from the previous year’s growth were 15, 20 and 20--25 °C, respectively.
In a second experiment, E. globulus clones taken from four mother plants originating from climatically dissimilar loca-tions within Tasmania were acclimated at day/night tempera-tures of 10/15, 18/23 and 25/30 °C in temperature-controlled greenhouses. Another set of clones was acclimated in a shade-house where temperatures ranged between 10 and 25 °C and with a mean daily temperature of approximately 15 °C. Plants grown at 25/30 °C had significantly lower net photosynthetic rates when measured at 10 and 20 °C than plants grown at lower temperatures. Plants grown at 10/15 °C had significantly lower net photosynthetic rates when measured at 30 °C than plants grown at higher temperatures. Plants grown at the am-bient conditions prevailing in midautumn in Hobart had sig-nificantly higher net photosynthetic rates at 20 °C than plants raised in the greenhouses and were equal best performers at 10 and 30 °C. A comparison of the light response curves of the plants showed that the maximum rate of net photosynthesis was affected by the growth temperature, whereas the apparent
quantum efficiency remained unchanged. There were no sig-nificant differences in the photosynthetic temperature re-sponses of the four genotypes derived from climatically dissimilar locations within Tasmania. A comparison of tem-perature response models for E. globulus indicated that incom-plete acclimation (defined by a slope value of less than 1 for the linear relationship between the temperature optimum for photosynthesis and the growth temperature) generally resulted in a greater daily carbon uptake than complete acclimation (slope value of 1).
Keywords: apparent quantum efficiency, genotype, response model, temperature acclimation.
Introduction
Photosynthesis is temperature dependent and exhibits a tem-perature optimum. In response to small and short-term shifts in ambient temperature away from this optimum, photosyn-thetic activity decreases; however, it rapidly returns to its previous maximum when the optimum temperature is restored (e.g., Slatyer and Morrow 1977). Longer term deviations from the photosynthetic temperature optimum result in adaptive changes or acclimation in both photosynthesis and respiration (e.g., Mooney and West 1964, Strain et al. 1976, Slatyer and Morrow 1977, Read and Busby 1990). However, in many cases, the slope of the line relating the optimum temperature for photosynthesis and the acclimation temperature is less than 1, but it is often in the range 0.3 to 0.7 (e.g., Billings et al. 1971, Slatyer 1977b, Read 1990), suggesting incomplete acclima-tion as a result of either the plant’s inability to acclimate fully or the plant’s ability to regulate the extent of acclimation (Säll and Pettersson 1994). Recently, it has been theoretically dem-onstrated that incompletely acclimated plants can have higher rates of carbon uptake than fully acclimated plants if the maximum rate of photosynthesis is causally linked with the optimum temperature for photosynthesis (Säll and Pettersson 1994). Detailed studies of seasonal variation in net photosyn-thesis indicate that this may also be the case in the field (e.g., Slatyer 1977a, 1977b, Slatyer and Ferrar 1977, Slatyer and Morrow 1977), although the optimality of incomplete
acclima-Photosynthetic temperature responses of
Eucalyptus globulus
and
Eucalyptus nitens
M. BATTAGLIA,
1,2C. BEADLE
1,3and S. LOUGHHEAD
1,21 Cooperative Research Centre for Temperate Hardwood Forestry, Locked Bag No. 2, Post Office, Sandy Bay, Tasmania 7005, Australia 2
Department of Plant Science, University of Tasmania, G.P.O. Box 252C, Hobart, Tasmania 7001, Australia
3
CSIRO Division of Forestry, Locked Bag No. 2, Post Office, Sandy Bay, Tasmania 7005, Australia
Received March 2, 1995
tion remains untested.
We have studied the photosynthetic temperature responses of Eucalyptus globulus Labill.subsp. globulus and E. nitens (Deane and Maiden) Maiden. In southeastern Australia, E. ni-tens is the preferred plantation species in cool environments and E. globulus is planted in warm environments. A detailed examination of differences in the photosynthetic temperature responses of the two species may help to identify the environ-mental factors that cause one species to outperform the other on a particular site. Furthermore, such information is needed for the development of models designed to simulate or predict net carbon accumulation. The specific objectives of this study were to establish the nature of the temperature response curves and the extent to which both species acclimated, and to test whether partial acclimation increased carbon uptake relative to full acclimation. To assess the general applicability of the measured temperature responses, we also examined how the temperature response of photosynthesis in E. globulus varied with leaf ontogeny (e.g., Osman and Milthorpe 1971, Jurik et al. 1979) and genotype (e.g., Slatyer 1977b).
Materials and methods Field measurements
The plantation was established in August 1990 on a rural property 50 km east of Hobart, Tasmania (42°49′ S, 147°36′ E). The plantation was situated on a fertile basalt soil and was irrigated to maintain the soil water deficit in the top 2 m of the soil profile at between 20 and 40 mm. Fertilizer was applied regularly during stand development. Three adjacent canopies of E. globulus trees (seedlot from four families from King Island) and three adjacent canopies of E. nitens trees (Forest Resources Seed Orchard stock) were accessed by means of two 10-m tall scaffolds. At each measurement time, an actively growing branch at approximately 90% of tree height on the northern side of the sun canopy was selected. On each branch, the most recently fully expanded leaf from Node 5 (counting down from the apex) was used to monitor monthly changes in photosynthetic temperature response. In December 1993, tem-perature response curves were determined for E. globulus leaves from close to the branch base at approximately Node 20, which arose last growing season, the most recently fully ex-panded leaf at Node 5, expanding leaves at Node 2, and the apical shoot at Node 0.
Gas exchange measurements
An open gas-exchange system incorporating an infrared gas analyzer (Mk 2, Analytic Development Corp., Hoddesdon, Herts, U.K.) was used to measure net CO2 and water vapor exchange by foliage. A lamp containing four 150-W Wotan xenon quartz globes was used to maintain an incident photon flux density (PFD) at the leaf surface of 800 µmol m−2 s−1. Reductions in irradiance used to derive the light response curves were obtained with neutral-density filters, and increases in irradiance were obtained by increasing the power to the lamp. A humidified air source, consisting of two temperature controlled water baths and an aquarium pump, was used to
maintain the relative humidity close to the leaf surface between 50 and 80%. As a result, the vapor pressure deficit was low for temperatures below 30 °C and unlikely to have significantly affected stomatal conductance. At 30 °C and above, vapor pressure deficits were about 2 kPa, which is sufficient to reduce stomatal conductance by at least 50% (Don White, personal communication). Air at ambient CO2 concentration was pumped through the leaf chamber (cross-sectional area 6.25 cm2) and the reference line at 400 ml min−1.
Leaf temperature was measured by inserting a thermocouple into the leaf chamber and resting it against the lower leaf surface. Foliage temperature was controlled by circulating water through chambers above and below the leaf chamber. Temperatures were raised in 5 °C steps at approximately 0.5 °C min−1 starting at 10 °C (5 °C in winter) and finishing at 35 °C (40 °C in summer). Leaves were allowed to equilibrate at each measurement temperature for approximately 5 min before each reading was taken. Photosynthetic rates were measured at 15 °C three times, once at the start of the measure-ment cycle, once under rising temperatures and finally at the end of the measurement cycle under falling temperatures to ensure that no effects of duration of enclosure within the leaf chamber or hysteresis in temperature response were influenc-ing observations.
Conductance of CO2 from the stomatal cavity to the chloro-plast, referred to here as intracellular conductance (gi), was calculated using the approximation A/(ci − Γ) (Jones 1992), where A is the observed assimilation rate, Γ is the CO2 com-pensation point, and ci is the partial pressure of CO2 inside the leaf. Within the normal range of leaf temperature, Γ can be approximated as 1.7T, where T is leaf temperature (Farquhar 1988). The variable ci was calculated as (gc − E/2)(Cc − A)/(gc + E/2), where 1/gc = 1.6/gs + 1.37/gb, Cc is CO2 flux corrected for the water vapor pressure in the air, E is the transpiration rate, gs is the stomatal conductance to water, gb is the boundary layer conductance, and A is the assimilation rate (von Caem-merer and Farquhar 1981).
Mean hourly readings of air temperature were collected at an automated weather station located in a cleared area adjacent to the plantation. The average of all temperature records for the 5 days preceding the measurement time was used to calculate the growing or acclimation temperature (Teff ).
Modeling photosynthetic temperature response
The temperature optimum for each measurement date was calculated from the fit of the equation describing a parabolic temperature response (after Säll and Pettersson 1994):
P(T)=Popt−b(T−Topt)2, (1)
Jurik et al. 1988).
The relationship between Topt and the growth temperature, Teff , was defined as (Slatyer 1977c):
Topt=Tpref−α(Tpref−Teff), (2) where Tpref is the temperature at which the optimum tempera-ture for photosynthesis and the growth temperatempera-ture, Teff , coin-cide, and α is the acclimation coefficient which describes the linear relationship between Topt and Teff . We have adopted the terminology of Säll and Pettersson (1994) where complete acclimation is equated with an acclimation coefficient of α= 1, and hence Topt = Tpref , and incomplete acclimation is equated with an acclimation coefficient of α< 1.
It is assumed that b in Equation 1 is independent of Topt but that Popt depends on Topt , and that this dependence can be described by a parabola with a maximum at Pmax when Topt = Tmax (Säll and Pettersson 1994) as follows:
Popt=Pmax−c(Topt−Tmax)2, (3)
where c describes the width of the parabola.
Equations 1--3 were combined to give the general equation (equivalent to the stationary model of Säll and Pettersson (1994)):
P(T) =Pmax−b(T−Tpref−α(Tpref −Teff))2−
c(Tpref−α(Tpref−Teff)−Tmax)2. (4)
Half-hourly temperature records for the daylight hours for days on which photosynthetic measurements were conducted were used to compare predicted carbon fixation per unit leaf area of leaves assumed to be fully acclimated (Topt = Teff , cf. Säll and Pettersson 1994) with the photosynthetic response shifts observed in the field. Daylength was varied but light quality was assumed to be uniform, water and nutrition were assumed to be nonlimiting, and no allowance was made for diurnal trends in photosynthetic performance or depression of photosynthesis associated with chilling effects.
Temperature-controlled greenhouse experiments
Sets of E. globulus clones were generated from four mother plants from climatically disparate Tasmanian areas: Clone 271 from Leprena, Clones 250 and 312 (known poor and good performers, respectively, at cold sites; Peter Naughton, per-sonal communication), and Clone 310 from Macquarie Har-bor. Sets of each clone were acclimated at day/night temp-eratures of 10/15, 18/23 or 25/30 °C in temperature-controlled greenhouses, and a fourth set of clones was located in a shadehouse providing ambient temperatures that ranged be-tween 10 and 25 °C, with a mean daily temperature for the duration of the experiment of approximately 15 °C. Both the greenhouses and the shadehouse were naturally illuminated throughout the 14-h photoperiod, with a maximum incident PFD inside the greenhouses and shadehouse of approximately 1500 µmol m−2 s−1. Clones were raised in 15-cm diameter pots (soil volume of 2650 cm3) filled with potting mix, watered
three times daily and fertilized with a complete nutrient solu-tion twice a week. After a 3-week acclimasolu-tion period, plants were shifted to environments providing a constant temperature of 10, 20 or 30 °C and allowed to acclimate for at least 1 h before CO2 and water vapor exchange measurements were made.
Results
Acclimation responses in the field and response curve fitting
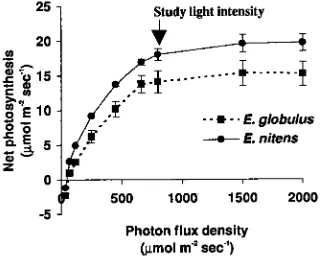
At 20 °C and ambient CO2, a photon flux density of 800 µmol m−2 s−1 was saturating, or very nearly so, for both study species (Figure 1). The maximum rate of net assimilation of E. nitens was significantly higher than that of E. globulus. The initial slope of the light response curve, indicative of the apparent quantum efficiency, was significantly steeper for E. nitens than for E. globulus.
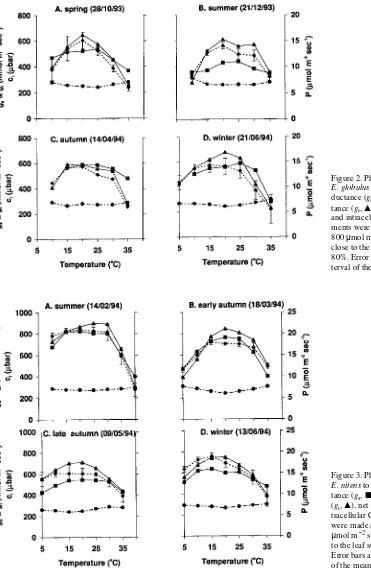
Examples of photosynthetic temperature response curves for E. globulus and E. nitens are given in Figures 2 and 3, respectively. The temperature response curves of the two spe-cies were generally similar in form; however, the temperature response curves of E. globulus showed a more marked tem-perature optimum than the response curves of E. nitens. Euca-lyptus nitens performed similarly across a 20 to 25 °C range of temperatures, whereas E. globulus had a more circumscribed zone of optimum performance encompassing a temperature range between 10 and 15 °C. In E. nitens, photosynthesis was only slightly diminished at 10 °C, even in midsummer, whereas E. globulus showed a marked decline in photosyn-thetic performance at temperatures below 15 °C, except during the midwinter acclimation state. As a result, the shape of the photosynthetic temperature response curve was generally parabolic for E. globulus but not for E. nitens.
The reduction in net photosynthesis at both high and low temperatures was associated with declines in stomatal (gs) and intracellular conductance (gi). In general, gs was not affected by increasing leaf temperature until after gi and net photosyn-thesis had commenced to decline. Intracellular CO2
tions varied within the range of 240--320 µbar (24--32 Pa) for all leaf temperatures tested, being lowest when rates of net photosynthesis were highest. However, the changes in intracel-lular CO2 concentrations in response to shifts in leaf tempera-ture were slight compared with the temperatempera-ture-induced changes in net photosynthesis.
The parameterization of Equation 1, the parabola describing
the relationship between net photosynthesis and measurement temperature, is given in Table 1 for each measurement date. As discussed above, Equation 1 provides a more appropriate de-scription of the temperature response of E. globulus than of E. nitens, for which the parameter describing the shape of the function, b, is unreliable. In both species, the temperature for maximum photosynthesis, Topt , was linearly related to the
Figure 2. Photosynthetic responses of
E. globulus to temperature: stomatal con-ductance (gs, j), intracellular
conduc-tance (gi, m), net photosynthesis (P, r)
and intracellular CO2 (ci, d).
Measure-ments were made at ambient CO2, PAR =
800 µmol m−2 s−1, and relative humidity close to the leaf surface between 50 and 80%. Error bars are the 95% confidence in-terval of the mean photosynthetic response.
Figure 3. Photosynthetic responses of
E. nitens to temperature: stomatal conduc-tance (gs, j), intracellular conductance
(gi, m), net photosynthesis (P, r) and
in-tracellular CO2 (ci, d). Measurements
acclimation temperature, Teff (Figure 4). There was no evi-dence that the season in which the assessment of photosyn-thetic performance was made affected the outcome: similar values of Teff in spring and autumn resulted in similar values of Topt .
The optimum temperature for photosynthesis of E. globulus increased from 17 to 23 °C with an increase in the mean daily temperature from 7 to 16 °C. Similarly, the optimum tempera-ture for photosynthesis of E. nitens increased from 14 to 20 °C when the mean daily temperature was increased from 7 to 19 °C. Eucalyptus globulus was more responsive to changes in the temperature of the growing environment than E. nitens (α of 0.59 versus 0.35); however, the regression of Topt against Teff
for E. nitens was heavily influenced by one observation.
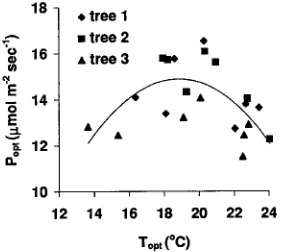
For E. globulus, the relationship between Popt and Topt was described by a parabola (Figure 5, r2 = 0.41, P < 0.1) with a Pmax of 14.35 µmol m−2 s−1, at a temperature, Tmax , of 18.9 °C. The three study trees had similar values of Tmax (19.5, 19.3 and 18.1 °C for Trees 1, 2 and 3, respectively). The Pmax of Tree 3 was significantly lower than that of the other trees (13.4 µmol m−2 s−1 versus 15.1 and 15.7 µmol m−2 s−1 for Trees 1 and 2, respectively). The relationship of b, the parameter that de-scribes the shape of the parabola, was not correlated with Topt (Figure 6). If Equation 4 is an appropriate description of the acclimation process, then Popt and Topt should be related, and b should be independent of Topt .
Equation 4, which describes the instantaneous net photosyn-thetic rate in relation to the current temperature and the grow-ing temperature can be parameterized for E. globulus as:
P(T)= 14.34 − 0.031(T− 32.3 + 0.59(Teff− 32.3))2−
0.084(0.59(Teff−32.3)+ 13.4)2. (5)
Equation 5 can be used to assess whether incomplete
acclima-Table 1. Seasonal changes in the shape of the photosynthetic response curve as defined by the parabolic function P(T) = Popt − b(T − Topt )2, where
P is the rate of photosynthesis at temperature T, with maximum of Popt at temperature Topt , and b describes the spread of the parabola. The average
or growth temperature, Teff , is the mean daily temperature of the 5 days preceeding the measurement date. Standard errors are given in brackets.
Date Teff (°C) Popt (µmol m−2 s−1) b Topt (°C)
E. globulus
Oct. 28, 1993 12.2 14.4 (0.9) 0.042 (0.009) 20.4 (0.9) Nov. 25, 1993 12.8 14.2 (0.8) 0.035 (0.009) 20.5 (1.1) Dec. 21, 1993 15.0 13.8 (0.6) 0.035 (0.006) 22.0 (0.7) Feb. 8, 1994 16.1 12.6 (0.5) 0.020 (0.005) 23.0 (1.0) Mar. 8, 1994 11.9 13.7 (0.7) 0.026 (0.005) 19.3 (0.9) Apr. 14, 1994 8.7 14.4 (1.1) 0.033 (0.011) 19.8 (1.5) Jun. 21, 1994 6.9 14.1 (1.1) 0.027 (0.008) 16.5 (1.7)
E. nitens
Feb. 14, 1994 18.9 22.1 (0.7) 0.035 (0.001) 19.9 (1.1) Mar. 18, 1994 12.5 18.3 (0.4) 0.028 (0.000) 20.7 (0.7) May 5, 1994 8.6 15.7 (0.5) 0.016 (0.000) 16.8 (1.5) Jun. 13, 1994 6.8 18.5 (0.6) 0.021 (0.008) 14.1 (1.4)
Figure 5. Relationship between the optimum temperature for net photosynthesis (Topt ) of E. globulus and the maximum rate of
photo-synthesis observed (Popt ).
Figure 4. Relationship between the temperature at which maximum photosynthesis was recorded (Topt )and the average temperature of the
preceding 5 days (Teff ) of both field-grown and greenhouse-grown
E. globulus and field-grown E. nitens. Parameterization follows the equation given by Slatyer (1977c). The equation for field-grown
E. globulus is Topt = 32.3 + 0.59(Teff −32.2), r2 = 0.86, P < 0.05. The
equation for field-grown E. nitens is Topt = 20.4 + 0.35(Teff − 20.4), r2
= 0.81, P < 0.1. Numbers associated with field-grown E. globulus
tion represents an inability of a plant to optimize its response. In the case of complete acclimation (sensu Säll and Pettersson 1994), Topt would equal Teff and Equation 5 would become:
P(T)= 14.35 − 0.031(T−Teff)2− 0.084(Teff− 18.9)2. (6)
It is not known whether Popt is causally determined by Topt , as Säll and Petterson (1994) imply, or casually correlated with Topt as a result of seasonal correlations between injury and acclimation. In the case where Popt remains constant and Topt shifts (e.g., Sands 1996), Equation 5 becomes:
P(T)= 14.35 − 0.031(T−Teff)2−
0.084(0.59(Teff− 32.3)+ 13.4)2. (7)
Using the average hourly temperature for the week before measurement, the carbon uptake of E. globulus leaves can be estimated from Equations 5--7, assuming that temperature is the only limiting factor (Table 2). In all but one case, the model for the incomplete acclimation state predicted greater produc-tivity for the measurement dates than did the model for the fully acclimated state. However, the model for the fully accli-mated state with Popt held constant predicted the greatest productivity in all but two cases, although the difference was only slight for one case.
Leaf age effects
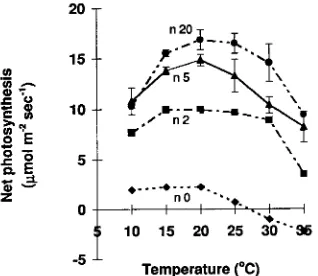
Leaves of different ages exhibited different photosynthetic responses to temperature (Figure 7). In December 1993, apical shoots, expanding leaves, fully expanded leaves from current-year growth, and fully expanded leaves from the previous-year’s growth had photosynthetic temperature optima of 10--15, 15, 20 and 20--25 °C, respectively.
Greenhouse experiments with different genotypes of E. globulus
Greenhouse-grown plants acclimated to the growth environ-ment in the same way as field-grown plants, although changes in the photosynthetic temperature optima were slight com-pared to the shifts detected in the field (Table 3, Figure 8). The field and greenhouse data were generally similar at Teff values below 20 °C, but plants grown at > 20 °C in the greenhouse showed a less marked shift in Topt than predicted from older field-grown plants (Figure 4), perhaps indicating a limit to the acclimation ability of E. globulus or a fundamental difference between field-grown trees and greenhouse-grown plants in the
Table 2. Estimated productivity of trees allowing for incomplete and complete acclimation where the maximum rate of photosynthesis (Popt ) is
causally related to the optimum temperature for photosynthesis (Topt ) (Equations 5 and 6), and full acclimation where Topt and Popt are
independently determined (Equation 7).
Estimated daily CO2 uptake (mol CO2 m−2)
Date Weekly average Incomplete acclimation Full acclimation Full acclimation
Teff (°C) (Equation 5) (Equation 6) (Equation 7)
Oct. 28, 1993 12.2 608 475 642
Nov. 25, 1994 12.8 650 601 753
Dec. 21, 1994 15.0 583 576 590
Feb. 8, 1994 16.1 680 705 673
Mar. 8, 1994 11.9 574 474 659
Apr. 14, 1994 8.7 542 169 514
Jun. 21, 1994 6.9 334 69 454
Figure 7. Photosynthetic temperature response curves of leaves of
E. globulus along a branch measured on December 21, 1993. Apical shoot = n 0; 2nd node counting back from the apex = n 2; 5th node from the apex = n 5; and 20th node from the apex = n 20. Measure-ments were made at ambient CO2, PAR = 800 µmol m−2 s−1, and relative humidity close to the leaf surface between 50 and 80%. Error bars are the 95% confidence interval of the mean.
Figure 6. Relationship between the optimum temperature for net photosynthesis (Topt ) of E. globulus and b, a parameter that describes
slope (α = 0.12 for the greenhouse-grown plants) of the line relating acclimation temperature to Topt .
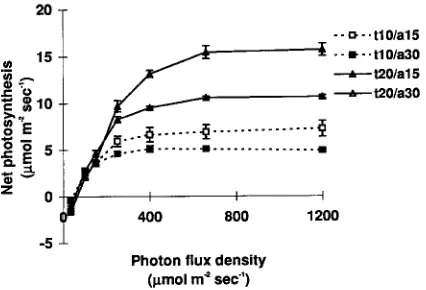
Plants acclimated at 30 °C in the greenhouse had signifi-cantly lower rates of CO2 uptake at 10 and 20 °C than did plants acclimated at 15 and 23 °C, but performed equally well when tested at 30 °C. Plants raised in a 15 °C greenhouse had similar rates of CO2 uptake to plants raised in a 23 °C greenhouse when tested at 10 and 20 °C but had a significantly (P < 0.05) lower rate of CO2 uptake when tested at 30 °C. Plants accli-mated under varying temperature conditions in the shadehouse performed significantly better than all other plants when tested at 20 °C. Plants grown in the shadehouse had a Topt of 21.8 °C, and plants grown in the 10/15, 18/23 and 25/30 °C greenhouses had Topt values of 21.8, 22.6 and 24.1 °C, respectively. Plants grown in the 10/15, 18/23 and 25/30 °C greenhouses had Popt values of 14.56, 14.58 and 12.65 µmol m−2 s−1, respectively. Applying Equation 4 to the greenhouse-grown plants yielded best-fit values of Tmax = 21.82 and Pmax = 14.77, values that are similar to those of the field-grown plants. The effect of meas-urement temperature on instantaneous net photosynthesis was also similar for the field- and greenhouse-grown plants (b = 0.031 for the field-grown plants compared with 0.047 for greenhouse-grown plants) but the change in Popt with Topt was
considerably less for the field-grown plants (c = 1.54 for greenhouse-grown plants compared with 0.084 for field-grown plants).
The apparent quantum efficiency was independent of the growth temperature (Figure 9). Clones of all four genotypes performed similarly under all test conditions, both in terms of overall photosynthetic performance and in shifts in photosyn-thetic response as a result of changes in growth temperature (Table 3).
Discussion
The photosynthetic temperature response curves of mature leaves of E. globulus were generally parabolic and symmetri-cal around the temperature optimum (cf. Säll and Pettersson 1994), whereas the photosynthetic temperature response of E. nitens was not satisfactorily described by the parabolic function. The skewed response to temperature observed in some species (e.g., Strain et al. 1976, Pearcy 1978, Jurik et al. 1988) and the platykurtic response of E. nitens observed in this study indicate that the parabolic function is not universally applicable.
The decline in net photosynthesis above and below the temperature optimum was accompanied by declines in both
Table 3. Analysis of variance for the interaction of acclimation temperature (ACCT), genotype (GENO) and measurement temperature (TEMP) on net photosynthesis after allowing for between subject (PLANTNO) differences.
Source DF Type III SS Mean square F-value P
PLANTNO (ACCT × GENO) 66 422.1 6.4 1.81 0.0037
ACCT × GENO 8 12.3 1.5 0.44 0.8963
TEMP 2 1805.4 902.7 255.18 0.0001
TEMP × GENO 6 12.7 2.1 0.60 0.7297
TEMP × ACCT 6 109.9 18.3 5.18 0.0001
TEMP × ACCT × GENO 16 27.4 1.7 0.49 0.9489
Tests of hypotheses using the Type III MS for PLANTNO(ACCT × GENO) as an error term
GENO 3 17.9 6.0 0.93 0.4296
ACCT 3 212.9 71.0 11.10 0.0001
Figure 8. Photosynthetic rates at 10, 20 and 30 °C of E. globulus
acclimated for 3 weeks at 15/10, 18/23 or 25/30 °C in greenhouses or in a shadehouse at ambient temperature. Error bars are the 95% confidence interval of the mean.
stomatal conductance and intracellular conductance. However, the decline in net photosynthesis commenced before the de-cline in stomatal conductance, suggesting that the initial changes in net photosynthesis are a result of decreased intra-cellular conductance. At temperatures above 25 °C, when net photosynthesis had already commenced to decline, the atmos-pheric vapor pressure deficit was almost certainly a factor in the reduction in stomatal conductance.
Leaf age was an important determinant of the shape of the photosynthetic response curve. Older leaves of E. globulus had a higher photosynthetic temperature optimum and a more symmetrical photosynthetic temperature response curve than older leaves of E. nitens. These differences are likely to be the result of different rates of growth respiration rather than differ-ences in acclimation of the photosynthetic apparatus, because the increase in respiration rate with increasing temperature is generally greater than the increase in carboxylation rate (Berry and Björkman 1980). Normally, young tissues have higher respiration rates than older tissues, and developing tissues have higher respiration rates than mature tissues (Bidwell 1979). This explains both the decrease in photosynthetic optima and the increase in asymmetry of the temperature response curve as progressively younger and more actively growing leaves were examined.
The photosynthetic temperature response curve of E. nitens was broader than that of E. globulus. Broad photosynthetic temperature response curves are often found in species, or ecotypes of species, from variable environments (e.g., Billings et al. 1971, Read 1990). Eucalyptus nitens occurs in environ-ments ranging in altitude from 600 to 1600 m that are prone to frosts, in which the coldest month of the year has a mean minimum temperature of −5 to 2 °C and the warmest month has a mean maximum temperature of 21 to 26 °C. In contrast, E. globulus subspp. globulus is typically found within 20 km of the coast at altitudes ranging between sea-level and 450 m, where the mean minimum temperature of the coldest month varies between 0 and 8 °C and the mean maximum temperature of the warmest month varies between 20 and 23 °C (Boland et al. 1984). More importantly, the more continental climate prevalent across the environmental range of E. nitens results in a greater diurnal range of temperatures. Although acclimation to broad seasonal shifts in temperature is important for E. nitens, a broad photosynthetic temperature optimum also has the advantage that it greatly increases potential CO2 uptake. Thus, Turnbull et al. (1993) found that the productivity of E. nitens changed only slightly over a 600 m altitudinal range, whereas the productivity of E. globulus exhibited a pro-nounced optimum at the lower altitude sites, but only when these sites were frost free.
We conclude that both E. globulus and E. nitens are capable of acclimation. Changes in photosynthetic performance in response to temperature were detected that appeared to be independent of intracellular CO2 concentration. The relation-ship between growth environment and optimum temperature for photosynthesis was linearly correlated for both species (cf. Slatyer 1977b). Greenhouse experiments indicated that at very high growth temperatures (average daily temperature of
28 °C), the extent of acclimation may be diminished, although the possibility that the greenhouse-grown plants followed a different acclimation trajectory than the older field-grown trees cannot be discounted. Comparable temperatures in spring and autumn resulted in similar optimum temperatures for net photosynthesis, indicating no significant hysteresis in the ac-climation response. Based on this finding, we conclude that shifts in the photosynthetic temperature optimum are a direct response to growth temperature.
The data suggest that E. globulus acclimates more com-pletely than E. nitens (α = 0.59 versus 0.35). This may be because the broader photosynthetic temperature response curve of E. nitens necessitates a less dynamic response to changing temperature. Eucalyptus globulus, which grows in an environment characterized by less diurnal temperature fluctua-tions than E. nitens, has a narrowly defined zone over which net photosynthesis remains at near maximal rates, but a fairly dynamic response to growth temperature. By contrast, the photosynthetic response of E. nitens is not closely tied to changes in growth temperature. The adverse effects of this pattern of response are probably counterbalanced by the broad temperature optimum for photosynthesis which enables high rates of photosynthesis to be maintained over a wide diurnal temperature range.
In both species, acclimation was only partial, defined by a value of less than 1 for the slope of the line relating the optimum temperature for photosynthesis to the growth tem-perature. Although the maximum rate of photosynthesis changed only slightly over the 9-month measurement period, the changes were sufficient to support the contention of Säll and Petterson (1994) that incomplete acclimation could result in greater carbon uptake if the maximum rate of photosynthesis and the temperature optimum of photosynthesis are causally linked. However, this contention is not substantiated if the maximum rate of photosynthesis is only coincidentally corre-lated with the temperature optimum of photosynthesis and acclimation changes to the temperature optimum for photo-synthesis do not necessitate a change to the seasonally deter-mined maximum rate of photosynthesis. Although seasonal effects on net photosynthesis have been associated with winter injury (e.g., Slatyer and Morrow 1977, Linder and Lohammar 1981) or midsummer high temperature injury (e.g., Mooney et al. 1978) in extreme environments, it is unlikely that these effects are important at the field site used in this study. It is not known whether the decline in maximum rate of net photosyn-thesis observed in plants grown in the greenhouse at high temperatures and the decline and recovery associated with the onset and passing of summer reflect injury or an acclimation associated linkage. In addition to the possible optimality of incomplete acclimation for CO2, factors such as the high me-tabolic costs associated with low temperature acclimation and the associated marginal photosynthetic gain (Berry and Björk-man 1980) indicate that interpretation of adaptive fitness from acclimation response alone is simplistic.
clones differed in growth response to site temperature in field trials (Peter Naughton, personal communication). This finding suggests that the photosynthetic temperature response is a conservative trait in E. globulus, in contrast to other species (e.g., Billings et al. 1971,Slatyer and Morrow 1977, Slatyer 1977b, Turnbull et al.1993). However, the differences among the genotypes observed in field trials may be related to differ-ences in frost resistance rather than photosynthetic differdiffer-ences (Turnbull et al. 1993). The four genotypes were selected from sites that might be regarded a priori as differing significantly in temperature environment. It is possible that the generally maritime nature of the E. globulus subsp. globulus geographic range and its restricted latitudinal distribution have resulted in a low between-site variability in temperature environment and thereby prevented the development of ecotypic differences in photosynthetic temperature response that are observed among species with a greater latitudinal or altitudinal distribution. Acknowledgments
We acknowledge the assistance of Boral Timber in providing the eucalypt clones, and Messrs. D. and P. Tinning and ACIAR for provid-ing the plantation site. We thank D. Worledge, C.R.A. Turnbull, L. Pinkard, N.J. Davidson, D. White, K. Williams, J. Blake, C. Ash-worth, P. Sands and D. Wiltshire for assistance. We also thank P. Sands and P. Kriedemann for valuable comments on the manuscript.
References
Berry, J. and O. Björkman.1980. Photosynthetic response and adapta-tion to temperature in higher plants. Annu. Rev. Plant Physiol. 31:491--543.
Bidwell, R.G.S. 1979. Plant physiology. MacMillan Publishing Co., Inc., New York, 726 p.
Billings, W.D., P.J. Godfrey, B.F. Chabot and D.P. Bourque. 1971. Metabolic acclimation to temperature in arctic and alpine ecotypes of Oxyria digyma. Arct. Alp. Res. 3:277--289.
Boland, D.J., M.I.H. Brooker, G.M. Chippendale, N. Hall, B.P.M. Hyland, R.D. Johnston, D.A. Kleinig and J.D. Turner. 1984. Forest trees of Australia. CSIRO, Melbourne, 687 p.
von Caemmerer, S. and G.D. Farquhar. 1981. Some relationships between the biochemistry of photosynthesis and the gas exchange of leaves. Planta 153:376--387.
Farquhar, G.D. 1988. Models relating subcellular effects of tempera-ture to whole plant responses. In Plants and Temperature. Symp. of the Soc. for Exp. Bot., Number 42. Eds. S.P. Long and F.I. Wood-ward. Company of Biologists Ltd., Dept. of Zool., Univ. of Cam-bridge, CamCam-bridge, pp 395--409.
Jones, H.G. 1992. Plants and microclimate: a quantitative approach to environmental plant physiology. 2nd Edn. Cambridge Univ. Press, Cambridge, U.K., 428 p.
Juriik, T.W., G.M. Briggs and D.M. Gates. 1988. Springtime recovery of photosynthetic activity of white pine in Michigan. Can J. Bot. 66:138--141.
Jurik, T.W., J.F. Chabot and B.F. Chabot. 1979. Ontogeny of photosyn-thetic performance in Fragaria virginiana under changing light regimes. Plant Physiol. 63:542--547.
Linder, S. and T. Lohammar. 1981. Amount and quality of information on CO2-exchange required for estimating annual carbon balance of
coniferous trees. Stud. For. Suec. 160:73--87.
Mooney, H.A. and M. West. 1964. Photosynthetic acclimation of plants of diverse origin. Am. J. Bot. 51:825--827.
Mooney, H.A., O. Björkman and G.J. Collatz. 1978. Photosynthetic acclimation to temperature in the desert scrub, Larrea divaricata. I. Carbon dioxide characteristics of intact leaves. Plant Physiol. 61:406--410.
Osman, A.M. and F.L. Milthorpe. 1971. Photosynthesis of wheat leaves in relation to age, illuminance and nutrient supply. II. Re-sults. Photosynthetica 5:61--70.
Pearcy, R.W. 1978. Acclimation of photosynthetic and respiratory CO2
exchange to growth temperature in Atriplex lentiformis (Torr.) Wats. Plant Physiol. 59:484--486.
Read, J. 1990. Some effects of acclimation temperature on net photo-synthesis in some extra-tropical Australasian Nothofagus species. J. Ecol. 78:100--112.
Read, J. and J.R. Busby. 1990. Comparative responses to temperature of the major canopy species of Tasmanian cool temperate rainforest and their ecological significance. II. Net photosynthesis and climate analysis. Aust. J. Bot. 38:185--205.
Säll, T. and P. Petterson. 1994. A model of photosynthetic acclimation as a special case of reaction norms. Theor. Biol. 166:1--8. Sands, P.J. 1996. Modelling canopy production: III. Canopy
light-utilization efficiency and sensitivity to physiological and environ-mental variables. Aust. J. Plant Physiol. 23:103--114.
Slatyer, R.O. 1977a. Altitudinal variation in the photosynthetic char-acteristics of Eucalyptus pauciflora Sieb. ex Spreng. III. Tempera-ture response of material grown in contrasting thermal environments. Aust. J. Plant Physiol. 4:301--312.
Slatyer, R.O. 1977b. Altitudinal variation in the photosynthetic char-acteristics of Eucalyptus pauciflora Sieb. ex Spreng. VI. Compari-son of field and phytotron responses to growth temperature. Aust. J. Plant Physiol. 4:901--916.
Slatyer, R.O. 1977c. Altitudinal variation in the photosynthetic char-acteristics of Eucalyptus pauciflora Sieb. ex Spreng. IV. Tempera-ture response of four populations grown at different temperaTempera-tures. Aust. J. Plant Physiol. 4:583--594.
Slatyer, R.O. and P.A. Ferrar. 1977. Altitudinal variation in the photo-synthetic characteristics of Eucalyptus pauciflora Sieb. ex Spreng. V. Rate of acclimation to an altered environment. Aust. J. Plant Physiol. 4:595--609.
Slatyer, R.O. and P.A. Morrow. 1977. Altitudinal variation in the photosynthetic characteristics of snow gum, Eucalyptus pauciflora
Sieb. ex Spreng. I. Seasonal changes under field conditions in the Snowy Mountains area of south-eastern Australia. Aust. J. Bot. 25:1--10.
Strain, B.R., K.O. Higginbottom and J.C. Mulroy. 1976. Temperature preconditioning and photosynthetic capacity of Pinus taeda L. Photosynthetica 10:47--53.