The economics of regulatory mandates on
the HMO market
William Encinosa
∗Center for Organization and Delivery Studies, Agency for Healthcare Research and Quality, Suite 605, 2101 E Jefferson Street, Rockville, MD 20852, USA
Received 1 July 1999; received in revised form 1 April 2000; accepted 1 May 2000
Abstract
Recently proposed HMO regulations have involved mandates of two forms: (1) minimum quality standards, and (2) mandated increases in access to speciality care. I show that piecemeal regulation, which uses only one of either mandate (1) or (2), may decrease welfare for all HMO consumers. Under full regulation using both (1) and (2), if the minimum standard is set too low, say, due to political bargaining, a floor-to-ceiling effect occurs. This involves HMOs setting quality at the minimum standard, even when their quality would be above the standard in an unregulated market. Finally, I show how premiums may either increase or decrease under a mandate. Published by Elsevier Science B.V.
JEL classification: L51; I11; I18
Keywords: Health insurance regulation; Minimum standards; Adverse selection
1. Introduction
Many consumers in the US have expressed much anger and dissatisfaction with their health maintenance organizations (HMOs), believing that cost-cutting has lead HMOs to de-liver unacceptably low levels of health care quality. In response to this upswell of consumer dissatisfaction, 41 states have passed minimum maternity length-of-stay laws; 13 states have enacted similar mandates for mastectomy and 17 for reconstructive breast surgery; and 10 states have passed mental health parity laws, which require a minimum level of coverage for mental health illnesses.
In addition, many state have mandated access to speciality care. For example, as of October 1999, 33 states had enacted laws allowing women direct access to women’s health
∗Tel.:+1-301-594-6825; fax:+1-301-594-2314.
E-mail address: [email protected] (W. Encinosa).
specialists; 20 states mandated standing referrals to specialists for chronic conditions; 18 states required plans to provide referrals to out-of-network providers; 37 states had passed laws increasing access to emergency care services; and 14 states required plans to allow patients access to prescription drugs that are not on the HMOs formulary.1
Despite the increasing scope of state legislation, many state laws governing health plans do not apply to ERISA employee health plans that are self-funded, which today cover about 51 million privately insured Americans.2 As a result, the 106th Congress passed two Patients’ Bill of Rights (BOR) bills (S. 1344, and H.R. 358: the Norwood–Dingell Bill) in 1999 to attempt to override ERISA’s pre-emptions and provide more protection for patients privately insured under ERISA plans. The House BOR is more controversial in that it allows patients to sue HMOs when they deny or delay needed medical coverage.
These federal and state bills, however, have faced much criticism as piecemeal, disease-of-the-month regulation and micro-management of the HMO industry. A main criticism is that these new mandates will raise insurance premiums. The 1998 Democratic BOR (which laid much of the foundation of the 1999 BOR) (HR 3606, S 1890, 105th Congress) would impose 359 new federal mandates and create 3825 new federal jobs. According to the Congressional Budget Office, it would increase average premiums by 4% a year. A second criticism of these federal and state mandates is that they will actually distort quality in the HMO market. In particular, there is a fear that mandates will create a floor-to-ceiling effect. That is, while the mandate is intended to set a floor on HMO quality, it actually may allow HMOs to collude at the minimum standard by refusing to offer patients quality above the mandated floor. It then becomes the provider’s burden to prove that a patient warrants special treatment above the mandated level of care. In essence, today’s mandated quality floor actually becomes tomorrow’s quality ceiling on the HMO market.
Despite these concerns, there has not been a conceptual framework in which the effects of government mandates could be analyzed. Since the HMO market faces potential adverse selection and risk selection problems, the traditional economics literature on minimum standards does not apply to the HMO market. In this paper I develop a model to analyze minimum quality standards and minimum access mandates in the HMO market. In parti-cular, I focus on the two main forms of HMO regulation: (1) mandated minimum quality standards,3 and (2) mandated increases in access to speciality care.4 With this model we can now address two important questions.
1. Will these quality and access regulations really increase welfare? I show that if the market faces piecemeal regulation, in which only one of either forms of regulation is implemented, then welfare for all consumers may decrease below the case of no regulation. But, when coupled together, both forms of regulation, mandated access and
1See Hellinger (1996) and Families USA (1999) for a review of state legislation on managed care.
2The 1974 federal Employee Retirement Income Security Act (ERISA) pre-empted most state regulation of
self-insured employer-sponsored health insurance.
3All of the 1998 federal HMO bills involve numerous minimum quality standards. For example, several
fed-eral bills mandate minimum length-of-stay in the hospital for mastectomies and deliveries in order to curb ‘drive-through’ HMO mastectomies and newborn deliveries.
4For example, the 1999 BOR allow patients direct access to specialists for chronic conditions, such as oncologists
minimum standards, work together to solve the market failures in a perfectly competitive market if the mandates are set high enough. However, the two forms of regulation are not very robust in solving the market failures. I show that if a minimum standard is set too low, say, due to political bargaining, a floor-to-ceiling effect may occur in a competitive HMO market. This involves HMOs setting quality at the minimum standard, even when their quality would be above the standard in an unregulated market. Today’s mandated floor on quality will become tomorrow’s ceiling on quality.
2. Will these quality and access regulations increase costs? I show that these mandates will never increase premiums for every consumer in the market (there are always some consumers who experience a decrease in premiums). In fact, I illustrate cases where these regulations will (weakly) decrease premiums for all consumers. However, there are also cases where quality declines and premiums increase for some consumers due to regulation.
This article is organized as follows. Section 2 sets up the basic model, with Section 3 delineating the types of market failures occuring in an unregulated HMO market. Section 4 examines quality and access regulation under perfect HMO competition, while Section 5 studies the floor-to-ceiling effects of imperfect implementation of quality mandates. Section 6 concludes with some comments on imperfect HMO competition and risk adjusting.
2. The basic model
When the quality of a product is unobservable, Akerlog (1970) showed that asymmetric information could lead to a market failure. When the quality of a product (like insurance) is observable, but the purchaser’s risk type is unobservable to the insurer, Rothschild and Stiglitz (1976) showed that adverse selection still may cause a market failure. Can minimum quality standards solve these market failures? Indeed, Leland (1979) showed that imposing a minimum quality standard in Akerlof’s model would improve welfare. However, the effect of a minimum standard in Rothschild and Stiglitz’s model is still an open question. This will be the topic of this paper. I show that under adverse selection, minimum standards can actually decrease welfare in a perfectly competitive market.
First, the demand side of the managed care organization (MCO) market is described. Suppose that the health insurance market consists of two types of consumers: (1) the high risk (H) who become ill with probabilityaH; and (2) the low risks (L), who become ill with probabilityaL< aH. Let the number of low risks in the market benL, and the number of high risks in the market be nH. Let λ = nH/(nH +nL)be the proportion of high risks in the market. Each consumer’s risk type is unobservable to the MCO, causing an adverse selection problem.5 The MCO’s only means of avoiding high risks is by offering low speciality care access or by offering too low a level of general qualityq in order to discourage the high risks from enrolling.
5Even if the risk type were observable, an adverse selection problem would still arise since the HMO Act of
A consumer’s utility for MCO care depends on the MCO’s premiump, and on the MCOs two types of quality: (1) general qualityqand (2) the MCO’s degree of access to speciality care,s. The utility function for a risk typei(i=L, H) will be
Wi(p, q, s)=U (y−p)+(1−ai)H +ai[H+H (q)]+Vi(s),
fori=L, H, whereyis income,H is the health utility when not ill, andH is the health utility when ill, withH < H. I assume that the risk typei,i=L, H, obtains utilityVi(s) from speciality care assesssregardless if ill or not ill.
General MCO qualityq is valued equally by both high and low risks (H (q)). Qualityq
includes the quality of the MCO’s preventive health care, inpatient care, emergency care, and amenities. In contrast, the MCO’s degree of access to speciality care,s, is valued more by the high risks than the low risks, since the high risks have chronic conditions that require speciality care while the low risks do not. To simplify the analysis without loss of generality, I will assume that the degree of access to speciality care is binary:s∈ {sl, sh}, whereslis low
access to speciality care andshis high access to speciality care.6For example, an MCO may
have a restricted or closed network of specialists, or may allow patients to go to specialists outside of the network through a point-of-service option. Second, MCOs may either allow patients to see a specialist for their chronic condition only after a primary care gatekeeper physician grants a referral, or may allow patients direct access to specialists without a referral. Third, MCOs may have either a closed or open pharmaceutical formulary. Under a closed formulary, patients can only be prescribed the particular brand drugs or generic drugs that are on the MCO’s formulary list. In contrast, an open formulary allows chronically ill patients access to any pharmaceutical brand of a drug. Thus, in general,sj,j =l,h, may refer to the degree of access to special drugs, special technology, or specialist physicians.
To simplify the model, I will assume that the low risks only need low accessslto specialists
and do not receive any extra benefit from high accesssh. That is, I assumeVL(sh)=VL(sl).
While the low risks are indifferent betweenslandsh, I also assume that the MCO prevents
any moral hazard problem in that if the MCO offerssh, low risks will receive onlysl, since
the low risks are not chronically ill and are thus not expected to need a specialist for chronic conditions.
However, the high risks will value high speciality care accessshmore than the low risks:
VH(sh) > VL(sh).7 The high risks value high speciality care access more since they have
chronic conditions that would benefit from, say, direct access to a specialist without referral, or an open network of specialists.
Next, the supply side of the MCO market is described. Each MCO will choose a quality levelq, at costC(q)=q, and a premiump. If an MCO decides to offer high speciality care accesssh, it will incur a cost ofk(sh)=kper high risk enrollee.8 The cost of low quality
6See Encinosa (1999) for a model in whichsis a continuous variable. Mandates behave even more
anticompet-itively whensis continuous.
7If each risk type equally values speciality cares
h, then the market failures are less severe and the social optimum
can be restored with a minimum standard onq(Neudeck and Podczeck, 1996). But, with differential valuations ofsh, we will see that the impact of minimum standards is more complex.
8To simplify the model, I assume that there is no cost per low risk enrollee for offering high access speciality
speciality careslis normalized to zero,k(sl)=0. Finally, I assume that the MCO market
is perfectly competitive.
2.1. The social optimum
The social optimum involves a social planner choosingp,q, ands for each MCO in order to maximize the aggregate welfare of all the low and high risks (with equal weight placed on each risk class), such that total MCO profit is zero. The social planner has two options: (1) it may be optimal to separate the risks among two MCO plans, (pL, qL, sl) and
(pH, qH, si), where eitheri=l ori=h may be optimal; or (2) it may be optimal to offer only one pooling plan (p, q, si), where eitheri =l ori =h may be optimal. That is, the social planner maximizes the following program:
maxpL,pH,qL,qH,sinL[U (y−pL)
+(1−aL)H+aL(H +H (qL))+VL(sl)]+nH[U (y−pH)
+(1−aH)H +aH(H +H (qH))+VH(si)], (1)
such that the zero profit constraint holds
nL(pL−aLqL)+nH(pH −aHqH)−nLk(sl)−nHk(si)=0,
wherek(sh)=kandk(sl)=0. In program (1), recall that the low risks will always receive
sleven ifshis offered at the MCO. The high risk will receive whatever is offered,si, where
i=l,h. The solution to program (1) will involve pooling.9 The following proposition is proved in Appendix A.
Proposition 1 (Social optimum). In the social optimum, the solution to program (1) is a
pooling MCO plan (p∗, q∗, si∗), where there exists somek∗such that the optimal level of speciality care accesssi is high accessshfor allk≤k∗and low accessslfor allk > k∗.
Thus, if the costkof high access speciality care per high risk enrollee is above some thresholdk∗, then it is socially optimal for all MCOs not to offer high access speciality care. However, ifk < k∗, then it is socially optimal for all MCOs to offer high access speciality care and to pool the high risks with the low risks under one community rated premium. The intuition for the pooling is as follows. The low and high risks are charged the same premium because the welfare of each risk type is valued equally by the social planner. Qualityq is delivered to all patients up to the point where the extra utility that quality affords a patient per dollar of expenditure is equal to the patient’s marginal utility of income. Thus, since both risk types valueqequally and have the same marginal utility of income, they are afforded the same quality levelq∗. Next, since the MCO can prevent the low risks from consuming
shwhen it is offered, the social planner can provide high access to speciality careshin all
MCOs. Thus, the social optimum involves pooling at (p∗, q∗, sh).
9The social optimum might not involve pooling if the low and high risks have differing marginal utilities of
This pooling results in the burden of health care costs being equally distributed across both high and low risks in the MCO market. It is never optimal for some MCOs to offer low access speciality care, since this would discourage high risks from enrolling, eroding all cross subsidies between low and high risks. For costsk < k∗, it is optimal for all the low and high risks to be enrolled in the MCO market, at a quality level ofq∗and premium level ofp∗, with all MCOs offering high speciality care access. Hence, the social optimum entails the low risks subsidizing the high risks in each MCO.
3. Unregulated HMO competition
The fundamental question in this section is: can the market implement the social optimum without regulation? In particular, when the cost of high access speciality care is below the optimal threshold (k < k∗), will the market offer MCO plans with high access speciality care? The answer is no. In the social optimum, a social planner chosep, q,andsfor each MCO so that the MCOs could not attempt to creamskim off the low risks and avoid the high risks. However, without a social planner, the market will be distorted due to MCOs attempting to creamskim the low risks. There are two mutually exclusive types of such distortions that can occur in the unregulated market: market failure and market segmentation. Before defining these two distortions, first defineWH to be the high risk’s reservation utility (for example, the utility of an outside fee-for-service (FFS) option). That is, the high risks will opt out of an MCOs health plan if the utilityWH(p, q, s)is not greater thanWH. Next, definekˆto be the maximum cost of high access speciality careshat which a zero profit
MCO could just barely provide a total utility ofWH(p, q, sh)=WH when enrolling only high risks and offeringsh(see Fig. 1). That is, ifk >kˆ, then the cost ofshis so high that the
high risks’ utility would be belowWH unless there was a cross-subsidy from the low risks. Ifk≤ ˆk, then the MCO could offershat a utility level aboveWHwithout any cross-subsidy from the low risks. As shown next, we will have a market failure whenk < k < kˆ ∗and market segmentation whenk≤ ˆk.
3.1. Market failure (k < k < kˆ ∗)
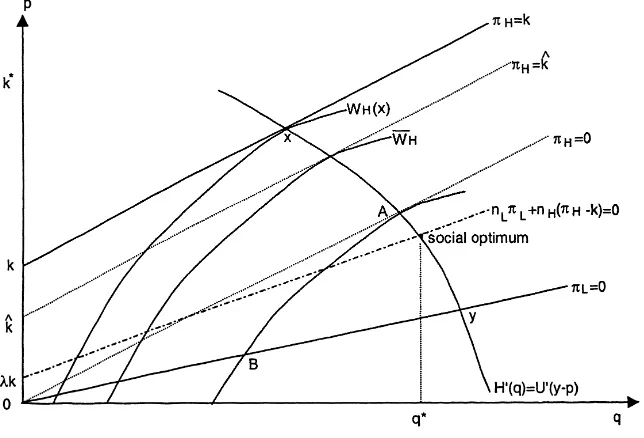
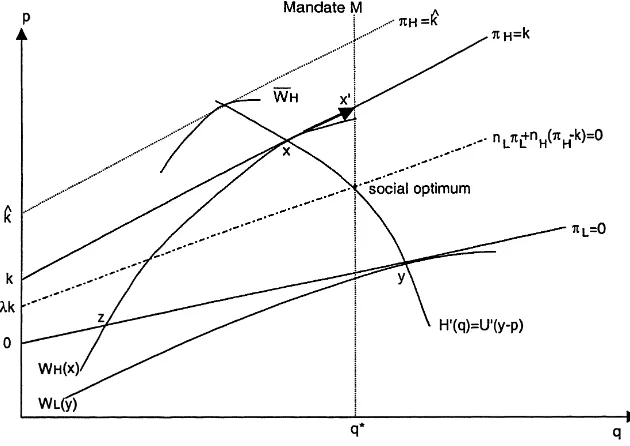
No MCO offers high speciality care access. The market failure can be observed in Fig. 1. To understand Fig. 1, it is helpful to discuss each property of the figure step-by-step. • Social optimum. The social optimum is the (q∗, p∗) point on the efficient premium
curve10 at which the profit would be zero if both high and low risks were pooled and provided with high speciality care access. This zero profit line is denoted by the dashed segmentnLπL+nH(πH−k)=0.Note thatπLandπH are the profits earned on each low risk and each high risk, respectively, if low access to speciality caresl is offered.
Since high speciality care is offered at the social optimum, the actual profit on a high risk at the social optimum isπH −k, wherekis the cost of high speciality care access. For
10The efficient premium curve (H′(q)=U′(y−p)) in Figs. 1–8 is the premiumpat which the marginal utility
Fig. 1. Market failure (k < k < kˆ ∗).
the low risks, the profit is stillπLsince the low risks do not use the high speciality care access even when it is offered.
• The high access MCOs. Next, if an MCO offered high access speciality care and attracted
only high risks, it would do so at the (q, p) point atx on the efficient premium curve where profit is zero on the high risks,πH−k=0 (i.e. the solid segmentπH =k). • The low access MCOs. Given the high access MCO atx, the low risks will be attracted
to the higher quality, low access MCO aty, where the efficient premium curve earns a zero profit on the low risks,πL=0. Note that whiley does have a higher quality level thanx, the high risks atx do not preferysince high speciality care access is offered at
xbut not aty.11
• The market failure. While the high risks preferx toy in Fig. 1, note that they prefer their reservation utilityWH instead ofxwhenk >kˆ. Recall thatkˆwas defined such that profit is zero (πH − ˆk =0) at the reservation utilityWH. Thus, when the cost of high accesskexceedskˆ, it takes a higher premium to fund speciality care at a zero profit (i.e. atxon the zero profit lineπH =kversus the lower lineπH = ˆk). Hence, atxthe high risks have utilityWH(x) < WH whenk >kˆ. As a result, the high risks would leave the market to obtainWH if they were offered high access atx. Thus, wheneverk >kˆ, there is no zero profit high speciality care access that can be offered to the high risks that they would accept.
• The equilibrium. As a result, the high risks are not offered high access whenk > kˆ. Instead, as in Fig. 1, they are offered low access at the pointAon the efficient premium
11It is assumed that the high risks’ utility of high access speciality careV
H(sh)is large enough that they preferx
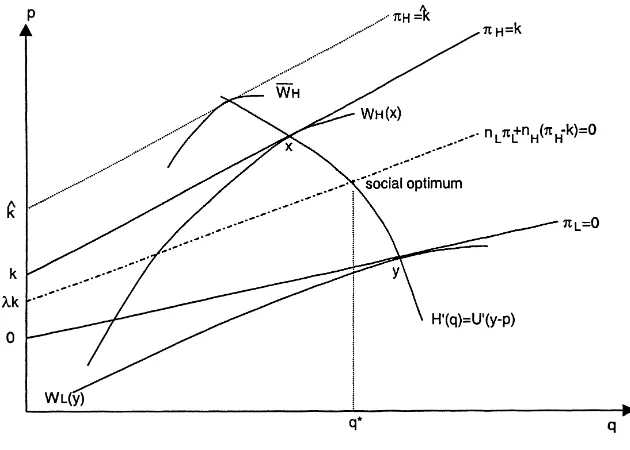
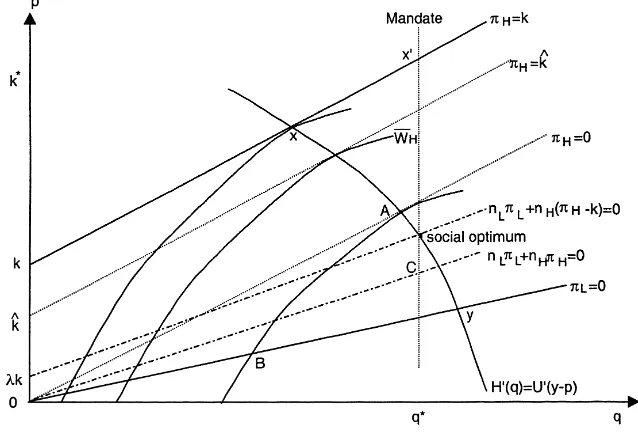
Fig. 2. Market segmentation (k <kˆ).
curve at which profit is zero,πH =0, under low access. However, now that high access is not offered atA, the high risks prefery toA. To avoid attracting the high risks, the MCOs atymove down toB, where the high risks are indifferent betweenAandB. Thus, high speciality care access is never offered on the market wheneverk >kˆ. Moreover, the market failure involves not only low access speciality care being offered, but suboptimal quality being offered:A < q∗andB < q∗. In particular, the market stratifies into ‘bad’ and ‘good’ MCOs whenk < k < kˆ ∗: low quality MCOs atBand higher quality MCOs atA.12
3.2. Market segmentation (k≤ ˆk)13
Some, but not all, MCOs offer high access. This case is illustrated in Fig. 2.
• The high access MCOs. As in Fig. 1, if an MCO offered high access speciality care and
attracted only high risks, it would do so at pointx in Fig. 2 on the efficient premium curve at which profit is zero on the high risks,πH−k=0. But, now thatk≤ ˆk, the zero profit line (πH = ˆk) at the reservation utilityWH is above the zero profit line (πH =k) atx. Thus,WH(x)≥WH, so that the high risks will prefer high access atx instead of their reservation utility.
• The low access MCOs. Given the high access MCO atx, the low risks will be attracted to the higher quality, low access MCO aty, where the efficient premium curve earns a zero
12As in Rothschild and Stiglitz (1976), no pure strategy Nash equilibrium exists ifλis low, since then an unstable
pooling plan can skim off both risk types fromAandB.
profit on the low risks,πL=0. The high risks atx do not preferysince high speciality care access is offered atx but not aty. Thus, whenk≤ ˆk, we have the case of market
segmentation: some, but not all, MCOs offer high access speciality care.
Recall that under a market failure, the market stratifies into good and bad MCOs. In contrast, under market segmentation (k ≤ ˆk), there is no market stratification into good and bad MCOs: the MCOs that have lower qualityqoffer high access speciality care, while the MCOs that have high qualityqdo not offer high access speciality care. This market segmentation has been observed to some extent between two types of MCOs: HMOs (health maintenance organizations) and POSs (point of service). One can think of HMOs as MCOs that do not offer high access speciality care and POSs as MCOs that do offer higher access to speciality care. Recent evidence from 1998 and 1999 indicates that POSs have lower general quality rankings than HMOs, even though they offer more flexibility in seeing specialists.14
For example, in the 1998 US News National Ranking of 271 MCOs in 45 states (using 28 HEDIS measures from the NCQA annual survey), only four POSs were ranked in the top 40 MCOs in terms of overall general quality.15 Of the 74 MCOs that reported both POS and HMO scores, the average overall quality score for POSs was 57 (out of 100, with 100 being best), 8% lower than the average score for an HMO, 62. In terms of preventive care, the average score for all HMOs was 64 (out of 100), while the average score for all POSs was more than 10% lower at 57. Moreover, in terms of the worst MCOs, 13% of the POSs had a score of less than 33 (out of 100), while only 6% of HMOs had a score of less than 33. In California’s 1995 PBGH Health Plan Value Check Survey, 80% of HMO customers were satisfied with their plan’s overall quality, while only 56% of POS customers were satisfied. In New Jersey’s 1999 HMO Performance Report (which covered practically all POSs and HMOs in New Jersey), 38% of HMOs on average had a score for overall quality that was above average among all MCOs, while POSs had no above average scores; in fact, 43% of the POSs had below average scores among all MCOs.
4. Market regulation
Recall that in the social optimum, all MCOs offer high accessshand pool risks when
k≤k∗. However, in the unregulated market, no MCOs pool risks and not all MCOs offersh.
To resolve this market failure and market segmentation occuring in the perfectly competitive MCO market, three forms of market regulation will be considered:
1. Specialty care regulation (SC). This regulation requires all MCOs to offer high access to speciality care. Examples from the 1999 Patients’ Bill of Rights would be direct access to specialists without referrals, open pharmaceutical formularies, and expanded networks with point-of-service options.
14Many HMOs offer a POS option on top of the HMO option. However, quality may differ under the POS option
since it is a larger and looser network of providers, with only a subset being in the HMO. For example, an HMO option may be composed of urban university medical school doctors, while the POS option may be used primarily in the outlying rural and suburban areas to see the local doctors. Clearly, quality may differ.
15Most of the HEDIS measures are objective measures (such as immunization rates). Thus, the scores should
2. Minimum quality regulation (MQ). This is the case of the MCO being prohibited from offering a quality levelq below some mandated minimum quality standard. Access to speciality care is not regulated.
3. Bundled regulation (SC, MQ). This is minimum quality regulation combined with guar-anteed high access speciality care, so that a minimum quality is mandated and patients have direct access to specialists without a referral, for example.
I now compare how these three types of regulations affect a perfectly competitive MCO market. First, I examine the case of piecemeal speciality care regulation.
4.1. Specialty care regulation
4.1.1. Under market segmentation (k≤ ˆk)
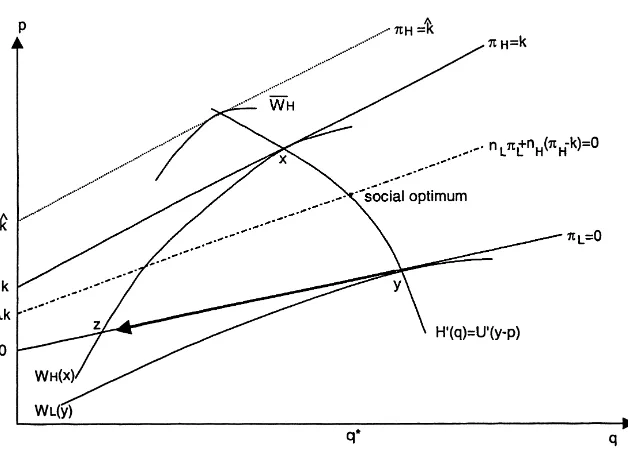
SC regulation decreases welfare and costs for low risks. Does SC regulation solve the market segmentation problem of the unregulated market? No, SC regulation makes the market segmentation problem worse. This can be seen in Fig. 3.
• The low access MCOs. Recall that in the unregulated case, the equilibrium under market
segmentation entails the high risks joining the plans that offershatxand the low risks
joining theslplans aty. The high risk are not attracted toyin the unregulated market since
ydoes not offershwhilexdoes offersh. Now, SC regulation requires all plans, including
y, to offersh. This would then attract the high risks toy, causing a negative profit aty.
As a result, SC introduces a race to the bottom for the MCOs that were previously not offering high access speciality care. Now that the MCOs are required to offer high access speciality care, they must lower qualityqfromytozso that the high risks in the MCOs with the quality of planxare not attracted to their plans as well.
• Welfare declines. The high risks stay with the high access, zero-profit MCOs that offer
qualityx. Therefore, since the low risks experience a drop in quality fromytoz(in which quality decreases quicker than the premium), SC regulation decreases overall welfare in the MCO market. Note that the MCO market remains segmented.16 Also, since SC regulation only affects premiums by lowering premiums for the low risks, SC regulation may actually lower the costs for some employers offering an MCO option.
Fig. 3 indicates a deterioration in general quality q when speciality care regulation SC is imposed. This has been observed to some extent at the state level. For example, in the middle of 1997, New Jersey passed a patients’ Bill of Rights that increased access to specialists. Comparing the 1997–1999 New Jersey HMO Performance Reports, there was a noticeable reduction in the general quality of New Jersey HMOs between 1997 and 1999. For example, in the enrollee survey category of ‘how well the primary care doctors communicate’ (listened carefully, explained things, and spent enough time), the percentage of enrollees who responded ‘always’ (that the doctor always communicated well and spent enough time) decreased from 78.3% in 1998 to 59.9% in 1999 on average for the HMOs in New Jersey. This is a 24% decline in satisfaction. (In 1997, this category was sub-divided into two categories that had ‘always’ for each category at 76 and 69%, so it is hard to compare 1997 with 1998–1999.)
Scores for more objective HEDIS measures also decreased for New Jersey HMOs from 1997 to 1998. Prenatal care decreased from 81% (of first trimester pregnancies) in 1997 to 77.6% in 1998. Eye exams for adults with diabetes decreased from 34% (of diabetics) in 1997 to 32.8% in 1998. Care after hospitalization for mental illness decreased from 74% (of such hospitalizations) to 72.3%. However, some wellness care increased slightly. For example, child immunizations (by age 2) increased from 57% in 1997 to 65.5% in 1998. Mammograms increased from 61 to 62.5% on average.
Overall, it seems that patients became about 24% more disgruntled with their primary care doctors from 1998 to 1999 after the New Jersey patients’ Bill of Rights. Wellness care increased slightly. But, primary care for chronic conditions (eye examines for diabetics and mental health care) decreased slightly from 1997 to 1998. Thus, general quality did seem to deteriorate slightly for HMOs in spite of the New Jersey Patients’ Bill of Rights.17
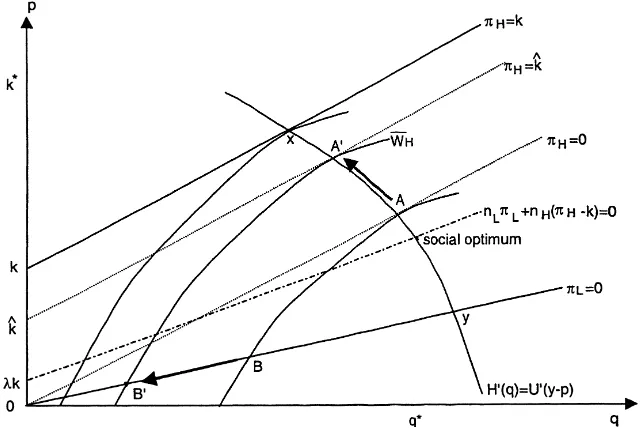
4.1.2. Under a market failure (k < k < kˆ ∗)
SC regulation decreases welfare for both risks. Does SC regulation solve the market failure problem of the unregulated market? No. Unfortunately, SC regulation exacerbates the market failure. This can be seen in Fig. 4.
16Ifλis low, SC regulation may cause no pure strategy equilibrium to exist, since an unstable pooling plan may
skim off both risk types fromxandz.
17I do not have any data on premiums. Most consultants now agree that the MCO sector has fallen into the
Fig. 4. Market failure (k < k < kˆ ∗), piecemeal SC regulation.
• The high access MCOs. Recall that in an unregulated market with a market failure, no
plan offerssh, and the high risks enroll in the plans atAwhile the low risks join the
plans atB. When the MCOs are now forced to provide high access speciality care under SC regulation, the plans atAmust move up toxto break even on the high risks due to the extra costkof offeringsh. However, since the reservation utility indifference curve
WH is belowx whenk < k < kˆ ∗, the high risks will opt out of the MCO market (at
A′) instead of selectingx. Thus, no MCOs are now able to enroll the high risks, since all high risks opt out (and return to fee-for-service care (FFS)). Welfare declines for the high risks.
• The low access MCOs. Since the high risks leave the market to obtainWH atA′, the MCOs serving the low risks atB (and now offer high access speciality care) decrease quality down toB′on theWHindifference curve in Fig. 4 in order to attract the low risks while deterring the high risks from enrolling. The profit line is stillπL=0 since the low risks do not use the high access to speciality care.
Overall, the welfare of both risk types decreases under SC regulation.18 While the premium drops for the low risks, the high risks must now pay a very high FFS premium. Thus, the employer’s costs will most likely rise under SC regulation in the market failure (k < k < kˆ ∗) case.
18If no pure strategy equilibrium existed for allλbelow someλˆin the unregulated market, the SC regulation will
Fig. 5. Market segmentation (k <kˆ), piecemeal MQ regulation.
4.2. Minimum quality regulation
4.2.1. Under market segmentation (k≤ ˆk)
MQ regulation causes welfare to decline and costs to increase for the high risks. Does MQ regulation solve the market segmentation problem of the unregulated market? No. This can be seen in Fig. 5.
• The high access MCOs. First, note that minimum quality (MQ) regulation mandates a
quality standardMthat prohibits any MCO from offering any quality levelq belowM. Recall that the unregulated equilibrium with market segmentation entails plans atxandy. If the mandate isM=q∗, then the high access speciality care MCOs in Fig. 5 that attract only the high risks now must increase qualityqfromxtox′at the minimum standardM. This, however, decreases the welfare of the high risks since the MCOs attracting only the high risks must also increase premiums more than commensurately with the quality increase in order to maintain a non-negative profit atx′. The welfare of the low risks does not change; they still obtain qualityyfrom the MCOs that do not offer high access speciality care. Thus, under MQ regulation, the MCO market remains segmented, and overall welfare decreases.19 Moreover, MQ regulation increases the costs of employers offering an MCO option with high access speciality care.
19This is in contrast to Neudeck and Podczeck (1996), who show that minimum insurance benefit standards may
Fig. 6. Market failure (k < k < kˆ ∗), piecemeal MQ regulation.
4.2.2. Under a market failure (k < k < kˆ ∗)
MQ regulation increases total welfare by inducing pooling, but without high access. Does MQ regulation solve the market failure problem of the unregulated market? No. However, unlike the market segmentation case, MQ regulation does increase total welfare. This can be seen in Fig. 6.
• Pooling. Recall that an unregulated equilibrium with a market failure entails low accesssl
plans atAandB. When the minimum standard isM=q∗, the MCOs can no longer offer high access speciality care atx′as in the market segmentation case since the high risks now prefer FFS (WH) tox′in Fig. 6. As a result of MQ regulation, no MCO offers high access speciality care and all MCOs pool both high and low risks at qualityq∗at point
Cin Fig. 6 (at the zero profit pooling line whenshis not offered). Due to the minimum
standard, any other MCO trying to skim off the low risks from the poolingCmust do so by
increasing quality beyondq∗or lowering the premium, but this would attract all the high risks as well and earn negative profits. Thus, the poolingCcannot be creamskimmed. SinceCpools the risks compared to the unregulated case of MCOs separating the risks types atAandB, quality and total welfare actually increase under MQ regulation. Since cross subsidies are implemented at the optimal qualityq∗under MQ regulation, the market is close to the social optimum. However, the MCOs still do not offer high access speciality care. Thus, MQ regulation does not solve all of the market failure.
4.3. Bundled regulation
equal to the socially optimal qualityq∗, then bundled regulation will implement the social optimum for allk < k∗(i.e. for both the market failure and market segmentation cases). For example, in the market failure case (k < k < kˆ ∗), recall that piecemeal MQ regulation with the standardM=q∗implemented pooling and cross subsidies at the pointCin Fig. 6, but without high access speciality care. With SC regulation bundled with MQ regulation, the MCOs must now offer high access speciality care, and so now simply move fromCon the pooling zero profit line to the social optimum on the pooling zero profit line for high access speciality care in Fig. 6 (i.e. the zero profit line shifts up due to the additional cost
k). The social optimum is thus implemented under bundled regulation, completely solving the market failure.
4.4. The overall effects of piecemeal regulation
In summary, Table 1 ranks the three forms of regulations under perfect competition according to the total welfare they generate. The ‘NR’ term will refer to the no regulation case, and the ‘SO’ term will refer to the social optimum. Both piecemeal MQ and bundled (SC, MQ) regulation use the optimal quality floorM =q∗.W (·)is the aggregate welfare in the market under the given regulation. In addition, Table 2 summarizes the effects of all three regulatory regimes on MCO behavior.
In particular, four facts from Tables 1 and 2 warrant special emphasis.
• Piecemeal SC regulation is the worst form of regulation since it forces a race to the bottom to the lowest quality level,B′ in Fig. 4 andzin Fig. 3, and the market remains segmented. Even worse, in the market failure case (k < k < kˆ ∗), SC regulation decreases the welfare of both risks. Moreover, it forces the high risks to disenroll from MCOs and return to FFS, decreasing welfare and increasing costs for the very people the regulation was targeted to help.
• Piecemeal regulation is always worse than no regulation, unless it induces pooling. The only time piecemeal regulation induces pooling is when MQ regulation is imposed under a market failure. However, under the less severe case of market segmentation, MQ does not induce pooling and decreases total welfare compared to no regulation.
• Piecemeal regulation is not robust. The effects of piecemeal regulation depend critically on the costkof high access to speciality care. For example, MQ decreases welfare when
k≤ ˆk, but increases welfare whenk >kˆ.
• Regulation will never increase premiums for all consumers. In all six cases of Table 2, premiums (weakly) increase for one risk class and (weakly) decrease for the other risk class. In only one of the six cases in Table 2 is it clear that aggregate premiums will increase (MQ whenk ≤ ˆk). In one other case (SC regulation whenk ≤ ˆk), aggregate premiums will decrease due to the regulation. In the remaining four cases of Table 2, it is ambiguous whether aggregate premiums will increase. Thus, the commonly heard argument that regulation will increase premiums for all consumers is not necessarily true.
Table 1
Welfare rankings of MCO regulations
ˆ
Premiums will increase for all consumers only if the minimum standard is set above the socially optimalq∗under bundled regulation. However, this would decrease total welfare compared to a standard set exactly at q∗. It is true that some industries lobby for very high standards to impede entry. I doubt if this is occurring in the MCO market since the standards do not seem overtly high to deter entry. In fact, some laws encourage entry. For example, a common “patients’ Bill of of Rights” law allows patients to continuing seeing a doctor that has left the MCO for several months to a year. This would indeed make it easier for a doctor to switch to an entrant MCO. Overall, MCOs have not, in general, been lobbying for a health care “patients’ Bill of Rights” for any reason, not even to deter entry.
5. Imperfect market regulation
We saw in the last section that the social optimum could be implemented only with bundled (SC, MQ) regulation that used a minimum quality standard set precisely at the socially optimal quality levelq∗. This solved all the market failure and market segmentation problems of the unregulated market and restored pooling. However, in this section I show that this nice result of bundled regulation is not very robust. In particular, if the minimum quality standard is set below the socially optimal qualityq∗, bundled regulation may create new distortions in the market, possibly making it worse than no regulation. Note that a minimum standard set atq∗is relatively high in that the ‘minimum’ standard is really set at the exact socially optimal quality standardq∗. Thus, there is really no gap or leeway allowed between the minimum standard and q∗. This may be difficult to implement politically. More realistically, the political process may result in a bargained compromise in which the minimum standard is set belowq∗.
My view of bargaining comes from Summers’ (1989) article on mandated benefits. His idea is that Republicans in Congress rank their preferred regulatory alternatives in the order of no regulation, minimum standards, and public provision. Democrats prefer the reverse order: public provision, minimum standards, and no regulation. As a result of bargain-ing between Republicans and Democrats, they implement the middle ground: minimum standards. In my model, I extend this notion by assuming they pick a somewhat ‘middle’ minimum standard between, say, zero andq∗(with the Democrats preferring q∗and the Republicans preferring 0). This bargaining model does not conflict with perfect market competition, since the market decisions are made after the Republicans and Democrats in Congress bargain over a minimum standard. Since the market is perfectly competitive, the market cannot hold the Congress hostage with a threat of retaliation. Thus, under perfect market competition, the bargaining is independent of the market.
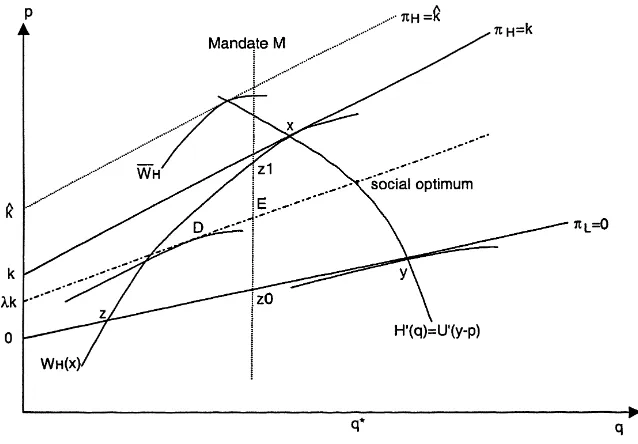
Fig. 7. The floor-to-ceiling effect.
5.1. Full floor-to-ceiling effect
Recall from Fig. 3 that in an unregulated market with market segmentation (k≤ ˆk), the introduction of speciality access regulation (SC) would force some MCOs into a race to the bottom fromy toz. But, recall also that a minimum standardM =q∗bundled with SC regulation would prevent the race to the bottom and force MCOs to pool risks at the socially optimal quality levelq∗at zero profit. Now suppose that the SC regulation is bundled with the lower minimum standard mandateM < q∗as illustrated in Fig. 7. First, note thatMin Fig. 7 prevents a full race to the bottom tozby stopping the MCOs atz0. However, if the
MCOs stayed atz0, they would attract all the high risks away from the MCOs atx, since
the SC regulation requires them to offer high access speciality care even atz0. Attracting
all the high risks would result in a negative profit atz0sincez0is below the pooling high
access speciality care zero profit line. To avoid this, the MCOs move fromz0in Fig. 7 up
Mto the high risks’ indifference curve atz1. The high risks will not be attracted away from
x toz1. However, note that the low risks atz1and the high risks atx can be skimmed off
by the pooling plan atEin Fig. 7.
If each MCO can only offer one plan, and not two (or, more precisely, cannot offer one plan to the low risks and one plan to the high risks),20 thenE in Fig. 7 is a Nash equilibrium. The mandateM prevents any plan from lowering quality belowMto skim
20This may be due to diseconomies of scope in which there are extra costs of offering one plan to the low risks
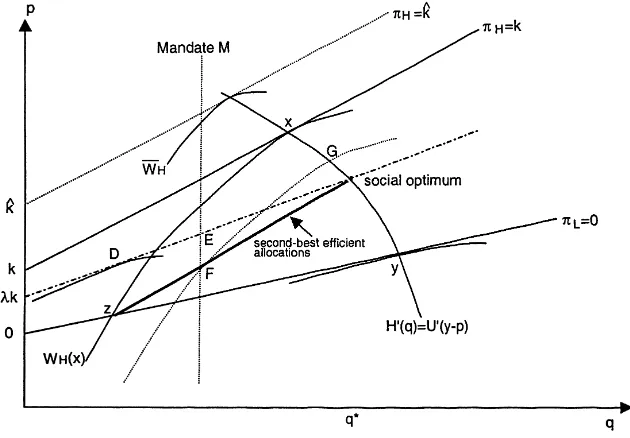
Fig. 8. The floor-to-ceiling effect, doubleton equilibrium.
the low risks offEwithout attracting the high risks. Thus, the minimum standardMin Fig. 7 induces all MCOs to cross subsidize the high risks at the mandated quality floor
M. In this case, the minimum standardMcreates a floor-to-ceiling effect in that it forces MCOs at the unregulated planxto drop quality down fromxtoM. In addition, it forces
all MCOs at the unregulated planyto drop quality down toMas well. Thus, the bundled regulation mandateMin Fig. 7 forces all MCOs in the market to decrease quality below their unregulated levels. That is, the mandated floorM < xcreates a quality ceiling atM
even though all MCOs offered quality aboveMin the unregulated market.
5.2. Partial floor-to-ceiling effect
If each MCO can indeed offer two plans (one to each risk type), then planEis no longer a Nash equilibrium in Fig. 7. When MCOs can offer two plans, they can offer one plan atF
and a second plan atG, as in Fig. 8. While a negative profit is made atG, a positive profit is earned atF so that the aggregate profit of the MCO is zero.21 Note thatF skims off the low risks fromEand thatGskims off the high risks fromEin Fig. 8. Moreover,F does not attract the high risks away fromG. Also, the mandated minimum standardMdoes not allow any plan to lower quality belowMto skim off only the low risks fromF. Thus,Fand
21The boldface segment fromzto the social optimum in Fig. 8 is the locus of second-best efficient allocations for
the low risks (Crocker and Snow, 1985). That is, each low risk plan on the segment fromzto the social optimum has a corresponding high risk plan on the efficient premium curve (H′=U′) that (1) makes the high risk indifferent
Gprovide a doubleton, separating Nash equilibrium in Fig. 8. In this case, whenM < x, a partial floor-to-ceiling occurs. While the mandateMin Fig. 8 causes quality to increase for the high risks fromxtoG, the quality for the low risks decreases from the unregulated quality levelydown to the minimum standard atF. Thus, the minimum standard quality floor becomes a ceiling on quality for the low risks. Thus, we have a floor-to-ceiling effect only for the low risks when MCOs can offer more than one plan on the market.
Moreover, the minimum standard causes the MCOs to reverse their quality rankings. That is, paradoxically, the higher quality plans in the unregulated market now drop their quality down to the minimum standard floor. As a result the low quality plans in the unregulated market have now become the high quality plans under the partial floor-to-ceiling effect (see Fig. 8).
In some cases, the doubletonF andGin Fig. 8 might not be a Nash equilibrium. For example, in Fig. 8, the pooling planDmay instead be higher up on the zero profit pooling line such thatD is then preferred toF andGby both risk types. However,D is not an equilibrium since the low risks can be skimmed off. In a previous version, I show that a doubleton Nash equilibrium will exists for largeλ(i.e. for high ratios of high risks in the market). Moreover, note that the deviationDis not an equilibrium since the low risks can be skimmed off. The Grossman refinement of the Nash equilibrium rules out unstable deviations such asD(Neudeck and Podczeck, 1996). Thus, if we use the Grossman–Nash equilibrium concept, as do (Neudeck and Podczeck, 1996) in a recent insurance market model, then a doubleton Grossman–Nash equilibrium will always exists for allλ, so that a partial floor-to-ceiling effect will always occur if MCOs can offer more than one plan.22
While the floor-to-ceiling effect decreases quality when compared to the unregulated case, cross subsidies between the low and high risks do occur (either through pooling inE
or cross subsidies fromFtoG). Thus, it is possible that total welfare may increase under the floor-to-ceiling effect. The benefits of cross subsidizing risks may outweigh the decrease in quality.
In summary, if some political bargaining process results in a compromised quality floor mandateMset moderately low (z < M < xin Fig. 8), the floor will, paradoxically, become a ceiling on HMO quality in a perfectly competitive market. However, the floor still does restore cross subsidies, and, if only one plan can be offered per MCO, the floor does mitigate market segmentation. Welfare increases for the high risks and decreases for the low risks, so the floor-to-ceiling effect on total welfare is ambiguous. If the mandate is set exceedingly low (M < zin Fig. 7), then the mandate will allow a race to the bottom to the low quality levelzin Fig. 7, with the market still being segmented so that there are no cross subsidies from the low risks to the high risks, decreasing welfare.
Finally, what happens when the MQ standard is set aboveq∗under full regulation? Total welfare decreases when the MQ standard is increased aboveq∗, even though pooling of both risk classes is maintained. Sinceq increases, the premium increases. But, now thatq
is aboveq∗(whereq∗is the point at which total welfare is maximized), total welfare begins to decline (the increase in premium begins to outweigh the benefits of higher quality).
22Encinosa (1999) shows that the full floor-to-ceiling effect will always occur in a duopoly market even if the
6. Conclusion
Without regulation, MCO competition for the healthy low risks results in either one of two possible problems under risk selection: (1) a market failure in which no MCO offers high access to speciality care, accompanied by a race to the bottom in quality; or (2) market segmentation, where some MCOs offer high access to speciality care, but at low quality, while others offer high quality with low access to speciality care. In both cases, the low risks are never pooled with the chronically ill high risks in any MCO. As a result, there are no insurance cross subsidies between the low and high risks, decreasing welfare and lowering quality for the high risks.
Two forms of quality regulation (guaranteed high access to speciality care and man-dated minimum quality standards) are necessary to solve the market failure in the perfectly competitive MCO market. However, if the two regulations set minimum standards that are moderately low (say, due to political compromises), then a floor-to-ceiling effect may occur. This involves MCOs setting quality at the mandated minimum floor even when their quality levels were above the floor when the market was unregulated. The mandated floor essen-tially becomes a self-imposed ceiling on quality. Moreover, piecemeal regulation, in which only one of the two forms of regulation is implemented, generally results in a decrease of welfare, compared to the case of no regulation, in a perfectly competitive market.
In contrast to conventional wisdom, these two forms of regulation will not necessarily increase costs. In particular, piecemeal minimum quality standard regulation is the only form of regulation in which it can be predicted that aggregate premiums will increase due to regulation. All other forms of regulation, piecemeal speciality care regulation and bundled regulation, result in ambiguous predictions about the effects on premiums. In general, for bundled regulation, premiums increase for the low risks, but decrease for the high risks. The change in aggregate premiums is ambiguous. In no case does regulation ever increase premiums for every consumer.
It would be nice to empirically test the predictions of this paper after regulation has occurred. A good deal of regulation has occurred at the state level. However, those laws are very piecemeal and very diverse; no states have enacted the same set of laws. Also, these state laws are pre-empted by ERISA and so do not apply to 51 million Americans. Most large firms are exempt from these state laws. Thus, it is hard to empirically confront these predictions in my paper until a substantial federal “patients’ Bill of Rights” is passed.
such piecemeal regulation decreases welfare in a perfectly competitive market, it actually increases welfare in a duopolistic market. Indeed, while piecemeal regulation via a mini-mum quality standard does increase quality in both perfectly competitive and duopolistic markets, it increases premiums too much due to fierce price competition in the perfectly competitive market, decreasing welfare compared to the case of no regulation. But, in a duopolistic market, aggregate premiums rise less commensurately with quality since price competition is softened under a duopoly, so that consumer welfare actually increases due to the increase in quality.
Finally, one alternative to regulating quality via minimum standards and mandates on access to speciality care is to risk adjust premiums in the market. That is, MCOs would pay a tax per low risk enrollee, but would receive a subsidy for each high risks enrolled, in a budgetary-neutral fashion. Thus, the regulator directly imposes cross subsidies between MCOs. However, in Encinosa (2000), I show that the same types of problems emerge under risk adjusting as they did for quality regulation. While perfectly implemented risk adjust-ment solves the market failures of a perfectly competitive unregulated market described above in Section 3, market distortions arise if the risk adjustment is imperfectly imple-mented. Moreover, if the MCO market is duopolistic, perfectly implemented risk adjusting will actually decrease welfare and increase profits. Thus, implementing risk adjustments is just as problematic as implementing quality mandates.
Acknowledgements
I thank James Baumgardner, Jim Burgess, Randy Ellis, Rich Hirth, Joe Newhouse, Mark Pauly, Charles Phelps, and participants of the 9th Annual Health Economics Conference at Cornell University, the BU/Harvard/MIT Health Economics Seminar, and the Western Economic Association meetings for their insightful comments. The views herein are those of the author, and no official endorsement by AHRQ or the US Department of Health and Human Services is intended or should be inferred.
Appendix A
Proof of Proposition 1. Letµbe the Lagrangian multiplier on the zero profit constraint in program (1). Then the first order conditions onpLandpH areU′(y−pL) =µand
U′(y−pH)=µ. Thus,pL=pH. Next, the first order condition onqiisH′(qi)=µC′(qi) fori=L, H. Thus,qL=qH. Next, we derive the optimals. First, define
δ= nLaL+nHaH
nL+nH
C(q).
Then note that ifslis selected, the zero profit constraint in program (1) yields
p=δ. (A.1)
Ifshis selected, then the zero profit constraint yields
Note thatshwill be optimal if and only if the aggregate welfare in program (1) is higher
undershthansl. That is, substituting Eqs. (A.1) and (A.2) for the premiums in the aggregate
welfare of program (1), we have aggregate welfare higher undershthanslif and only if
nL[U (y−δ) +(1−aL)H+aL(H +H (qL))+VL(sl)]
+nH[U (y−δ)+(1−aH)H+aH(H+H (qH))
+VH(sl)]< nL[U (y−δ−λk)+(1−aL)H+aL(H +H (qL)) +VL(sl)]+nH[U (y−δ−λk)+(1−aH)H
+aH(H+H (qH))+VH(sh)]. (A.3)
Note that Eq. (A.3) reduces to
U (y−δ−λk) > U (y−δ)−λ[VH(sh)−VH(sl)]. (A.4)
This holds for allk < k∗, wherek∗solves Eq. (A.4) at equality. Hence,shis optimal when
k < k∗. The intuition for Eq. (A.4) is that providing high access speciality care is optimal
when the incremental utility of a dollar of income is worth less than the incremental health utility to a high risk of a dollar spent on high access speciality care. Thus, fork < k∗the social optimum is a pooling plan(p, q, sh). Cross subsidies are present since the price is uniform
across all risk types, but the expected costs of each type differs:aLq∗ < aHq∗+k(sh).
Similarly, fork > k∗the social optimum is a pooling plan(p, q, sl).
References
Akerlof, G.A., 1970. The market for ‘lemons’. Quarterly Journal of Economics 84, 488–500.
Crocker, K.J., Snow, A., 1985. The efficiency of competitive equilibrium and redistribution in insurance markets with asymmetric information. Journal of Public Economics 26, 207–219.
Encinosa, W., 1999. The anticompetitive effects of minimum standards. AHCPR draft.
Encinosa, W., 2000. Risk adjusting health care payments under imperfect competition. AHRQ draft. Encinosa, W., Selden, T., 2000. The theory of employer health benefits. AHRQ draft.
Families USA, 1999. Hit and miss: state managed care laws, Parts I and II.
Given, R., 1996. Economies of scale and scope as an explanation of merger and output diversification activities in the health maintenance organization industry. Journal of Health Economics 15 (6), 685–714.
Hellinger, F., 1996. The expanding scope of state legislation. Journal of the American Medical Association 276 (13), 1065–1070.
Leland, H., 1979. Quacks, lemons, and licensing: a theory of minimum quality standards. Journal of Political Economy 87 (6), 1328–1346.
Neudeck, W., Podczeck, K., 1996. Adverse selection and regulation in health insurance markets. Journal of Health Economics 15, 387–408.
Rothschild, M., Stiglitz, J., 1976. Equilibrium in competitive insurance markets: an essay on the economics of imperfect information. Quarterly Journal of Economics 90, 629–650.
Ronnen, U., 1991. Minimum quality standards, fixed costs, and competition. RAND Journal of Economics 22 (4), 490–504.
Summers, L., 1989. Some simple economics of mandated benefits. American Economic Review 79 (2), 177–183. Wholey, D., Feldman, R., Christianson, J., Engberg, J., 1996. Scale and scope economies among health maintenance