CONFLATION OF NATIONAL BRIDGE INVENTORY DATABASE WITH
TIGER-BASED ROAD VECTORS
Qiaoping Zhang a, *, Stephen Griffiths a, Michael Wollersheim a, M. Lorraine Tighe b, Chen Xu c
a
Intermap Technologies Corp., #500, 635 - 6th Avenue SW, Calgary, AB, Canada T2P 0T5 – (qzhang, sgriffiths,
mwollersheim)@intermap.com
b
Intermap Technologies Inc., 8310 South Valley Highway, Suite 400, Englewood, CO, 80112-5809 USA –
[email protected]
c
AKS Geoscience Inc., 1804 – 1st Street NW, Calgary, AB, Canada T2M 2T2 – [email protected]
Commission IV, ICWG IV/VIII Updating and Maintenance of Core Spatial Databases
KEY WORDS: GIS, Integration, Matching, Database, National
ABSTRACT:
The National Bridge Inventory (NBI) database provides detailed bridge information with full coverage in the United States. In the database, each bridge record has an associated geographic location, which makes it possible to match the NBI records with road vectors in a geospatial database. This paper presents our approach to conflating the NBI database with U.S. Census Bureau's Topologically Integrated Geographic Encoding and Referencing (TIGER) road vectors based on a point-to-line matching algorithm, which combines both geometric and semantic similarity measurements. Experiments have shown that most NBI bridges can be successfully matched to TIGER road vectors with an overall success rate over 80%. The matched results are then used to help define linear features for bridges in the road database. The resultant road databases have enhanced bridge information and are further used in creating a 3D road database. The proposed methodology has been fully implemented and has been used in various applications.
* Corresponding author
1. INTRODUCTION
Initiated in 1972, the National Bridge Inventory (NBI) database is the repository of information on the composition, location, and condition of all bridges in excess of 6 meters in length located on public roadways in the United States. This database, compiled by the U.S. Department of Transportation's Federal Highway Administration (FHWA), now contains detailed information on over 600,000 bridges for a span of almost 30 years [Chase et al, 1999]. This valuable information about bridge type, traffic load, age, levels of deterioration, and ownership helps members of Congress and local government officials better understand the quality of bridges in states, districts, cities, and towns [Shields, 2007] and is of potential interest to a broad cross section of public and private users [McClure and Daniell, 2010]. This bridge inventory has been geocoded and thus can be used within a Geographic Information System (GIS) for geospatial display or analysis. The results of the map-based inventory provide a resource for relationship analysis, for example, to determine corrosion factors such as the effects of salt on bridges in a coastal community [Shields, 2007].
Since most bridges are connected to or are part of a road network, one of the natural questions to ask is, could we use the bridge information from the NBI database to enhance existing road databases? The answer is yes because each bridge record in the NBI database has an associated geographic location, which makes it possible to match the NBI records with road vectors in a geospatial database.
The matched results can then be used to help define linear features for bridges in the road database and to transfer the
hundreds of bridge attributes from the NBI to a road database. The resultant road database will have enhanced bridge information and can be better used in a variety of applications such as three dimensional (3D) road network creation, navigation and visualization. This process, called conflation, is especially useful for many TIGER-based (Topologically Integrated Geographic Encoding and Referencing) road databases, where the bridge information is missing. The process is beneficial to many other existing road maps as well, even if they already have bridge feature-coded vectors because very often there will be some bridges missing in those existing databases. Additionally, the bridge attributes from the NBI database can greatly enhance the bridge information in an existing road database by providing new attributes that are not included in the existing database. An example of such attributes is the bridge width, which is useful for visualization purposes.
However, the conflation process is challenging due to the positional uncertainties in both datasets, inconsistent naming conventions between the two databases, and the lack of other geometric information in the NBI.
refine the bridge location through profile analysis when it is possible to do so.
Following this introduction is Section 2, which gives a brief description of some of the important attributes in the National Bridge Inventory database. Section 3 introduces the TIGER road databases followed by Section 4, which details our second, especially when using GPS measurement methods. The location can be the beginning of the bridge or any other point of reference on the bridge, which is compatible with the state’s linear reference system (LRS). The inconsistencies among the geographic coordinates and points of reference in the provided location makes feature matching more challenging and, in many cases, requires the location of the bridge along the travelling direction to be adjusted based on terrain analysis (see details in Section 5).
2.2 Features Intersected
This item provides a description of the features, and the names of such features, intersected by the structure. These features are typically water bodies (rivers, creeks) or other roads. When these features are roads, they are very useful in resolving any mismatching issues. For example, if a candidate road vector has the same name as the bridge’s intersected feature’s name, we can remove it from the candidate list. Difficulties arise when there are more than one feature included and when abbreviations are used.
2.3 Facility Carried by Structure
This is another important attribute available in NBI. It gives the name of the facility “on” the structure, typically a road. In this work, we will try to match this attribute to the road names in the road database. Very often, these names are short names or use a different naming convention than the road vectors. When there are two bridges for two traffic directions, the attribute will try to provide the travelling directions (e.g., southbound, eastbound). This information will be used for refining point-to-line matching in Section 4.
2.4 Structure Length
This is the length of the roadway that is supported on the bridge structure, representing the length of the structure to the nearest tenth of a meter. The importance of the structure length in the conflation process is that when a successful match is achieved, the length will be used to feature code the road vectors along the travelling direction.
2.5 Bridge Road Width Out-To-Out
This attribute records the structure width to the nearest tenth of a meter. In our example of application, this bridge width is used to flatten roads / bridges on DTMs provided by the NEXTMap program [Mercer and Zhang, 2008].
3. TIGER ROAD VECTORS
The U.S. Census Bureau's TIGER database contains road vectors represented as linear features with various attributes such as names, the type of features, address ranges for most streets, the geographic relationship to other features, and other related information. It is primarily used to support the geographic mapping analysis and other GIS activities that serve the various censuses and surveys conducted by the Bureau [Song et al, 2006]. Despite its low positional accuracy and lack of currency in some cases, the TIGER road database has been widely used in geospatial analysis due to its free availability and rich attribute information. One piece of critical information missing from the TIGER road database is that it does not have any bridge information. This limits the usefulness of TIGER road vectors in applications such as vehicle navigation. In this test, we will apply a conflation process to feature code bridges in the TIGER database.
4. POINT-TO-LINE MATCHING
Conflation is typically regarded as the combination of information from two digital maps to produce a third map, which is better than either of its component sources [Cobb et al, 1998]. The history of map conflation goes back to the early to mid-1980s [Rosen and Saalfeld, 1985; Saalfeld, 1988]. The early work was mainly focused on U.S. Geological Survey (USGS) topography maps and TIGER street maps. Since then, it has been a common topic of researchers around the world focusing mainly on conflating road networks [Samal, et al., 2004; Lüscher et al, 2007; Zhang, 2009].
As Cobb et al [1998] point out, conflation is a multi-step, iterative process that involves positional re-alignment of component maps, identification of matching features, and positional and attribute deconfliction of positively identified feature matches. Among those, feature matching is the most difficult and critical task. It involves the identification of features from different maps as being representations of the same geographic entity [Cobb et al., 1998].
The existing feature matching approaches are mostly designed for linear features (e.g., Zhang, 2009) or areal features (e.g, Goesseln, 2005). There has been some discussion about node-to-node matching [Saalfeld, 1988] using the so-called spider code. However, the spider code proposed [Saalfeld, 1988] can not be used in current work because, unlike nodes in a road network, the NBI records are isolated point features.
travelling directions, and intersected feature names. The latter two are available in the NBI database.
4.1 Geometric Similarity
In a typical conflation process, the geometric (distance) similarity is often used in feature matching. In our case, however, the point-to-line distance is less robust for the following two reasons. First, as mentioned in Section 2.1, the provided bridge location can be either at the beginning of the bridge or at the middle of the bridge along the travel direction. Second, when there are multiple layers of roads, the correctly matched road vector is not necessarily the shortest point-to-line distance. In this test, the point-to-line distance is only used for selecting candidate road vectors for a given bridge. A threshold value was empirically selected based on the maximum distance that we observed between the bridge location provided in the NBI database and the matched road vectors in a number of test areas. For a given bridge, any vectors that are within the threshold distance are included for further analysis.
4.2 Semantic Similarity
The semantic similarity is based on three attributes: road names, travelling direction, and features intersected. Instead of calculating one single similarity measure, we introduce these three attributes in a sequential manner to reduce the number of candidates and to resolve any conflicts.
4.2.1 Road Name: Road name is the first attribute that is analyzed. Similar to the work by Zhang (2009), all road names have to be standardized before matching. In this work, we divide a road name into four parts:
1) Name base; i.e., the main name
2) Road type; e.g., Interstate or “I”, State Highway or “SH”, US Highway or “US”, Street or “St”, Avenue or “Ave”, Ramp.
3) Route Number; e.g., the numbers in “I 70” or “SH 470” 4) Road travel direction; e.g., “Eastbound” or “EBND”, “Southbound” or “SBND”.
For each road name part, we try to standardize the input strings before matching, particularly for the second and fourth parts because they have more variations in the databases.
There will be some names that are either difficult to separate into four parts or to standardize one or more of the parts; for example, “JCT 470W”, “Ramp to SH 470 SBD”, “Eastbound Exit Ramp”. In these cases, some special care must be taken.
4.2.2 Travelling Direction: If more than one name is matched, the bridge’s travel direction must be checked. The vector that matches the travel direction is then used (e.g., westernmost vector for southbound bridge). If no travel direction is available, the nearest vector is used.
4.2.3 Features Intersected: When the list of matched names is determined, any names that match the bridge’s “Features Intersected” attribute are excluded. The distance similarity measure is then used to determine the final best match result.
Experiments have shown that the use of semantic similarities can greatly reduce false matching and most of the NBI bridges can be successfully matched to TIGER road vectors. In our tests, the overall success rate is in the range of 80% to 95% depending on the complexity of the road network (e.g., urban
flyovers pose more difficulty than rural bridges) and the quality of the input from NBI (e.g., completeness of road names, etc.).
4.3 Matching Results
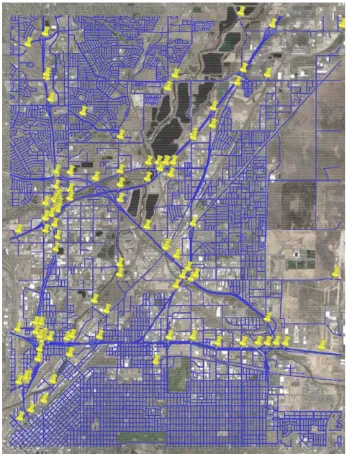
Figure 1 shows one of the test areas in Denver, CO. The blue lines are the input road vectors, while the yellow markers are NBI records. This scene consists of both rural and urban areas and has many complex flyovers and roundabouts. Figures 2 through 4 provide examples of the matching results from this scene with three different complexity levels.
Figure 1. Test area near Denver, Colorado: Blue lines – TIGER road vectors; Yellow markers – NBI records; background – Google Earth imagery.
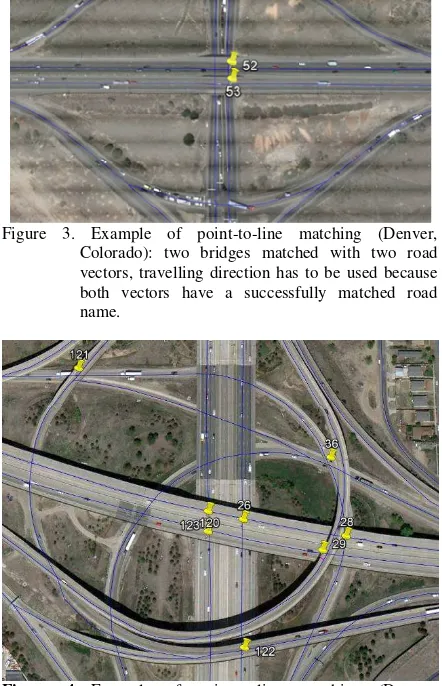
Figure 2. Example of point-to-line matching (Denver, Colorado): only one vector has a matched road name.
Figure 3. Example of point-to-line matching (Denver, Colorado): two bridges matched with two road vectors, travelling direction has to be used because both vectors have a successfully matched road name.
Figure 4 Example of point-to-line matching (Denver, Colorado): multi-layer road networks with clustered ramps and flyovers, only one bridge (left-upper) mismatched (see text).
Validation of the matching results has been done mainly through visual comparisons against available imagery (e.g., Google Earth imagery). Table 1 shows the validation results from two of our test sites: Denver, CO (urban) and Braxton County, WV (rural, hilly). In our process, we produce an error point for each failed bridge or conflicting match to assist an operator as they check the locations that might have problems. The incorrectly matched bridges/vectors will be edited at a later stage by an operator. This is a labor-intensive process and our goal is to minimize the work load associated with the manual editing.
#Bridges Denver Braxton
Not covered by vectors 6 0
Wrong/missing bridge location 5 0
Incorrectly matched 11 3
Correctly matched 119 35
Total 141 38
Table 1. Validation of matching results
5. FEATURE CODING BRIDGES
After successfully matching the bridges to the roads, the matched location on the road vector is assumed to be the middle of the bridge along the direction of travel. We use the bridge length information from the NBI database to either cut the matched road vector or merge the matched road vector with its linked road vectors. This cut or linked road vector will be feature coded as bridge vectors. The attributes from the NBI can be transferred to this new bridge vector if necessary. These bridge vectors are further adjusted based on profile analysis to better fit the terrain or ground elevation. In our test, we used Intermap’s NEXTMap DTM as an additional data source for this refinement. The DTMs are 5m posted and are derived from Interferometric Synthetic Aperture Radar (IFSAR or InSAR) Digital Surface Models (DSM) [Mercer and Zhang, 2008]. This data has a 1.0 meter LE90% vertical accuracy in low–sloped unobstructed terrain and is available for the continental U.S., thus it provides a suitable data source for this type of application. For comparison purposes, the NEXTMap DSM data were included in this testing, indicated by the green lines in Figure 6.
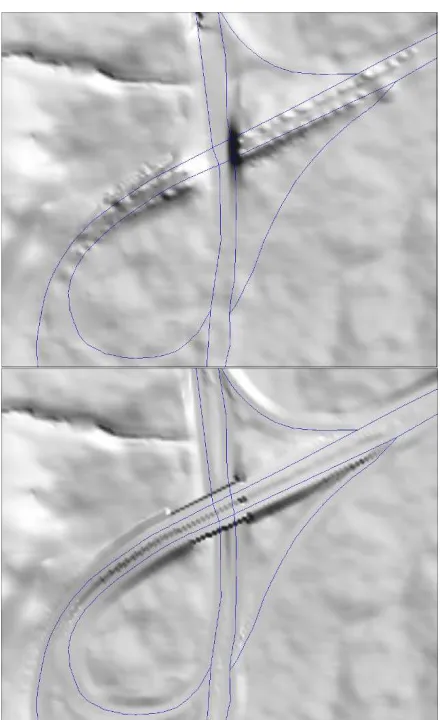
In Figure 5, two bridges (numbered 16 and 17) have been successfully matched to two TIGER road vectors, however, the matched locations are close to the southern end of the actual bridges. This is illustrated in the top portion of Figure 6, where the DTM profile (red solid line) clearly shows that the matched location (dashed magenta line) is not at the middle of the bridge. In the slope profile from the DTM (the red solid line in the bottom portion of Figure 6), we can identify two sharp turning points (two “X”s on the slope profile in Figure 6) and the middle of these two turning points can be used as the middle of the bridge (red dashed line). The final feature-coded bridge vectors are the red lines shown in Figure 5. More examples are shown in Figures 7 and 8. In the event that we can not successfully identify two sharp turning points (based on slope change thresholds) in the slope profile, we will not adjust the bridge location. The provided bridge location will be used as the middle point of the bridge along its travel direction.
Figure 5 Example of point-to-line matching (Braxton County, West Virginia): two bridges matched with two road vectors, both bridge locations are to the southern ends of the true bridges. The final bridge vectors are shown as red lines.
6. APPLICATIONS
networks. This was accomplished using 3D Road software and elevation information coming from NEXTMap DSM and DTM data [Zhang et al., 2010]. This process greatly reduced the production time of 3D road because the 2D road vectors did not need to be extracted from imagery first.
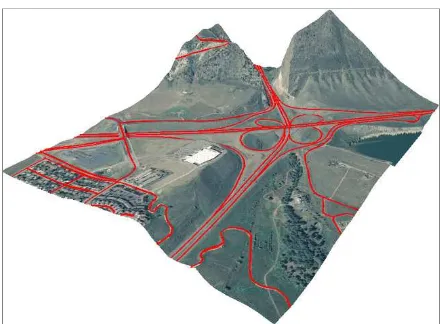
The 3D road vectors were further used in flattening roads (including bridges) in NEXTMap DTMs. Figure 9 illustrates an example of the 3D roads. In Figure 10, we show a 3D perspective view of the 3D road network draped over imagery from the National Agriculture Imagery Program (NAIP).
Figure 6 Example of bridge location adjustment of Bridge Number 16 in Figure 5: green solid lines are from DSM and red solid lines are from DTM; showing both the elevation profiles (top) and slope profiles (bottom). The initial bridge location is marked with dashed magenta line and the adjusted location is marked with dashed red lines.
Figure 7 Example of feature coding results (Santa Clara County, California): Blue lines – TIGER road vectors; Yellow markers – NBI records; Red lines (along the blue lines) – feature coded bridge vectors.
Figure 8 Example of feature coding results (Santa Clara County, California): Blue lines – TIGER road vectors; Yellow markers – NBI records; Red lines (along the blue lines) – feature coded bridge vectors.
Figure 9 Example of road flattening on DTMs (Millard County, Utah): Top – Input DTM; Bottom – Road flattened DTM.
Figure 10 3D view of a 3D road network with NAIP imagery draped on road flattened DTM (Jefferson County, Colorado).
7. CONCLUSIONS
We demonstrated that the valuable information recorded in the National Bridge Inventory database can be used to enhance an existing road database through a conflation process. This was accomplished using our hybrid point-to-line matching approach that combines geometric similarity measurements with semantic similarity measurements. The matching results have helped to feature-code bridges in a TIGER-based road database, which were further used to create a 3D road network. The process greatly improves the quality of the original road database and makes many new applications possible. Additionally, our unique approach to the refinement of the bridge location, made possible using the NEXTMap DTM data, can be used to update the location information in the NBI thus to standardize the definition of the bridge points.
Future work includes the expansion of the test datasets to include other existing road maps, such as those from NAVTEQ, TeleAtlas, or OpenStreetMap. The bridge information from the NBI database can be complementary to that from those road databases as well. The new challenge will be to determine how to incorporate existing bridge information from a road database into the feature matching process and how to resolve any conflicts among the two information sources.
REFERENCES
Chase, S. B., Small, E. P., Nutakor, C., 1999. An In-Depth Analysis of the National Bridge Inventory Database Utilizing Data Mining, GIS and Advanced Statistical Methods. 8th
International Bridge Management Conference. pp.
C-6/1-C-6/16, TRC 498, TRB, ISSN 0097-8515. April 26 - 28, 1999: Denver, Colorado.
Cobb, M. A., Chung, M. J., Foley, H., Petry, F. E., Shaw, K., B., Miller, H. V., 1998. A Rule-Based Approach for the Conflation of Attributed Vector Data, GeoInformatica, 2:1, pp.7-35.
Goesseln, G., 2005. A Matching Approach for the Integration, Change Detection and Adaptation of Heterogeneous Vector Data Sets. XXII International Cartography Conference. July 9-16, 2005: A Coruna, Spain.
Lüscher, P., Burghardt, D., and Weibel, R., 2007. Matching Road Data of Scales with an Order of Magnitude Difference. Proc. of the XXIII International Cartographic Conference
(ICC), Incremental Updating and Versioning of Spatial Data.
Moscow, Russia, August 4-10, 2007.
McClure, S. and Daniell, K., Development of User-Friendly Software Application for Extracting Information from National Bridge Inventory Source Files. Transportation Research
Record: Journal of the Transportation Research Board.
Volume 2202 / 2010, pp.137-147.
Mercer, B. and Zhang, Q., 2008. Recent advances in airborne InSAR for 3D applications, Proceedings of the ISPRS XXIth
Congress, July 3-11, 2008, Beijing: China.
Rosen, B. and Saalfeld, A., 1985. Match Criteria for Automatic Alignment. Proc. Auto-Carto 7. Falls Church, VA: ACSM/ASP, 1985.
Saalfeld, A., 1988. Conflation: Automated Map Compilation.
International Journal of Geographical Information Systems. 2
(3): pp.217-228.
Samal, A., Seth, S., and Cueto, K., 2004. A Feature-Based Approach to Conflation of Geospatial Sources. International
Journal of Geographical Information Systems. 18 (5):
pp.459-489.
Shields, B., 2007. National Bridge Inventory Shows Structures at Risk: Esri’s ArcGIS Software Helps Analyze Bridge Data and Assess Risk. Esri ArcWatch. September 2007:
http://www.esri.com/news/arcwatch/0907/bridge-inventory.html (last accessed January 5, 2012).
Song, W., Haithcoat, T.L., Keller, J.M., 2006. A Snake-Based Approach for TIGER Road Data Conflation. Cartography and
Geographic Information Science. Volume 33, Number 4,
October 2006, pp. 287-298.
U.S. Department of Transportation, 1995. Recording and Coding Guide for the Structure Inventory and Appraisal of the Nation’s Bridges. Report No. FHWA-PD-96-001.
Zhang, M., 2009. Methods and Implementations of Road Network Matching. PhD thesis: Technology University of Munich.
Zhang, Q., Simantov, M., de Vries, J., Griffiths, S., 2010. Assigning Elevations to 2D Road Networks Based On IFSAR-Derived DEMs. Proceedings of Canadian Geomatics
Conference 2010 and ISPRS Commission I Symposium. June