SUSTAINABLE FISHERIES
MANAGEMENT PROJECT (SFMP)
Market Segmentation Study Report
This publication is available electronically on the Coastal Resources Center’s website at http://www.crc.uri.edu/projects_page/ghanasfmp/
For more information on the Ghana Sustainable Fisheries Management Project, contact:
USAID/Ghana Sustainable Fisheries Management Project Coastal Resources Center
Graduate School of Oceanography University of Rhode Island
220 South Ferry Rd.
Narragansett, RI 02882 USA
Tel: 401-874-6224 Fax: 401-874-6920 Email: [email protected]
Citation: Amaning, R. (2016). Market Segmentation Study Report. The USAID/Ghana Sustainable Fisheries Management Project (SFMP). Narragansett, RI: Coastal Resources Center, Graduate School of Oceanography, University of Rhode Island. GH2014_ACT079_SNV 70 pp.
Authority/Disclaimer:
Prepared for USAID/Ghana under Cooperative Agreement (AID-641-A-15-00001), awarded on October 22, 2014 to the University of Rhode Island, and entitled the USAID/Ghana Sustainable Fisheries Management Project (SFMP).
This document is made possible by the support of the American People through the United States Agency for International Development (USAID). The views expressed and opinions contained in this report are those of the SFMP team and are not intended as statements of policy of either USAID or the cooperating organizations. As such, the contents of this report are the sole responsibility of the SFMP team and do not necessarily reflect the views of USAID or the United States Government.
Detailed Partner Contact Information:
USAID/Ghana Sustainable Fisheries Management Project (SFMP) 10 Obodai St., Mempeasem, East Legon, Accra, Ghana
Telephone: +233 0302 542497 Fax: +233 0302 542498 Maurice Knight Chief of Party [email protected]
Kofi Agbogah Senior Fisheries Advisor [email protected] Nii Odenkey Abbey Communications Officer [email protected]
Bakari Nyari Monitoring and Evaluation Specialist [email protected] Brian Crawford Project Manager, CRC [email protected]
Justice Odoi USAID Administrative Officer Representative [email protected]
Kofi.Agbogah #3 Third Nautical Close,
Nungua, Accra, Ghana
[email protected] Daasgift Quality Foundation
Headmaster residence, Sekondi College Sekondi, Western Region, Ghana 233 243 326 178
For additional information on partner activities: CRC/URI: http://www.crc.uri.edu CEWEFIA: http://cewefia.weebly.com/
DAA: http://womenthrive.org/development-action-association-daa Daasgift:
https://www.facebook.com/pages/Daasgift-Quality-Foundation-FNGO/135372649846101 Friends of the Nation: http://www.fonghana.org Hen Mpoano: http://www.henmpoano.org
SNV: http://www.snvworld.org/en/countries/ghana SSG Advisors: http://ssg-advisors.com/
ACRONYMS
CCM Centre for Coastal Management
CEWEFIA Central and Western Region Fishmongers Improvement Association CRC Coastal Resource Center
CSLP Coastal Sustainable Landscape Project DAA Development Action Association
DFAS Department of Fisheries and Aquatic Science DMFS Department of Marine Fisheries Sciences DQF Daasgift Quality Foundation
FtF Feed the Future
GIFA Ghana Inshore Fishermen's Association GIS Geographic Information System
GNCFC Ghana National Canoe Fishermen’s Council
HM Hen Mpoano
ICFG Integrated Coastal and Fisheries Governance MESTI Ministry of Environment Science and Technology MOFAD Ministry of Fisheries and Aquaculture Development NDPC National Development Planning Commission
NGOs Non-Governmental Organizations
SFMP Sustainable Fisheries Management Project SMEs Small and Medium Enterprises
SNV Netherlands Development Organization
SSG SSG Advisors
STWG Scientific and Technical Working Group UCC University of Cape Coast
URI University of Rhode Island
TABLE OF CONTENTS
CONTENTS
Acronyms ... iii
TABLE OF CONTENTS ... iv
LIST OF FIGURES ... vi
LIST OF TABLES ... vi
EXECUTIVE SUMMARY ... 1
BACKGROUND ... 7
1.1 Overview of the Fisheries Industry in Ghana ... 7
1.2 Overview of the SFMP Project ... 7
1.3 Purpose of the Segmentation Study ... 8
SURVEY METHODOLOGY ... 8
2.1 Scope and Timeframe ... 8
2.2 Sampling Procedure ... 8
2.3 Survey Method ... 9
2.4 Field Data Collection, Management and Analysis ... 9
2.5 Data Management and Analysis ... 10
2.6 Validation of Results... 10
2.7 Study Limitations ... 11
RESULTS OF THE SEGMENTATION STUDY ... 13
3.1 Demographic Characteristics of the Respondents ... 13
3.1.1 Distribution of the Respondents by Sex... 13
3.1.2 Distribution of Respondents by level of Education ... 13
3.1.3 Distribution of Smoked Fish Processors by Age ... 15
3.1.4 Marital Status of Smoked Fish Processors... 15
3.1.5 Distribution of Smoked Fish Processors by Number of Dependents ... 17
3.2 The Business Nature of Fish Smoke Processing Business ... 18
3.2.1 The forms of business undertaken by the Processors ... 18
3.2.2 Alternative livelihoods within the fishing industry ... 19
3.2.3 Period engaged in Fish Smoke Processing Activities ... 19
3.2.4 Ownership of Fish smoking stove ... 20
3.2.5 Types of Stove Used by Smoked Fish Processors ... 21
3.2.6 Size of stove used by the Smoked Fish Processors... 21
3.2.7 Reasons for the choice of stove used ... 22
3.2.8 Ranking of the most important factors that influenced the choice of stove ... 23
3.2.10 Stove utilization by Processors ... 23
3.2.11 Fish Smoke Production volumes ... 24
3.2.12 Period of Production in a Year ... 26
3.2.13 Type of Fish Stock Processed ... 27
3.2.14 Sources of Fresh Fish Processed during the Off-season ... 28
3.2.15 Other Economic livelihood Activities outside the fishing industry ... 29
3.2.16 Other Economic Livelihood Activities ... 29
3.3 The Business Assets and Operation of Smoked Fish Processors ... 30
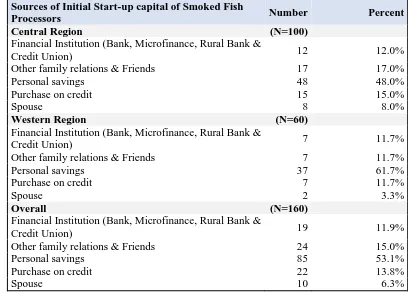
3.3.1 Sources of Initial Business Start-up Capital of Smoked Fish Processors ... 35
3.3.2 Access to Appropriate Storage Facility by Smoked Fish Processors ... 35
3.3.3 Average size of business working capital of Smoked Fish Processors ... 36
3.3.4 The Labor force of the Smoked Fish Processors ... 38
3.3.5 The size of the Labor force hired by the Smoked Fish Processors ... 39
3.3.6 Frequency of payment of hired paid labor by the Smoked Fish Processors ... 40
3.3.7 Gender distribution of Labor force engaged by the Smoked Fish Processors ... 41
3.3.8 Family members used by the Smoked Fish Processors as helping hands... 41
3.3.9 Access to savings account ... 41
3.3.10 Type of Financial Institution the Processors have savings account with... 42
3.3.11 Access to Credit ... 43
3.3.12 Financial Institutions that provided credit to the Smoked Fish Processors ... 43
3.3.13 The off-takers of fish processed by the Smoked Fish Processors ... 44
3.3.14 Where processed fish is sold by the Smoked Fish Processors ... 45
3.3.15 The markets in which processed smoke fish are sold ... 45
3.3.16 Mode of transporting processed smoke fish to the market ... 46
3.3.17 Time of selling processed fish ... 46
3.3.18 Average Monthly Sales ... 47
3.3.19 Equipment base of the Smoked Fish Processors... 49
3.3.20 Affiliation to Agro Processing Group/Association ... 50
3.3.21 Business Needs of the Fish Processors ... 51
3.3.22 Challenges of the Smoked Fish Processors ... 51
CONCLUSION AND RECOMMENDATIONS ... 52
Appendix 1: Actor Map from the Sea to the Bowl ... 53
LIST OF FIGURES
Figure 1 Group Discussions during Validation Workshop ... 10
Figure 2 Gallery of Focus Group Discussions held ... 12
Figure 3 Distribution of Respondents by Sex ... 13
Figure 4 Distribution of Smoked Fish Processors by Education ... 13
Figure 5 Community Distribution of Smoked Fish Processors by Education ... 14
Figure 6 Distribution of Smoked Fish Processors by Marital Status ... 16
Figure 7 Distribution of Smoked Fish Processors by Number of Dependents ... 18
Figure 8 Distribution of Smoked Fish Processors by other forms of fish processing activities undertaken ... 19
Figure 9 Gallery of Types Fish Smoking Stoves Currently being used by Smoked Fish Processors ... 21
Figure 10 Bar chart showing the types of stoves used by the Smoked Fish Processors ... 22
Figure 11 Distribution of Business Working Capital by Monthly Sales Turnover ... 37
Figure 12 Distribution of Business Working Capital by Production Volume. ... 38
Figure 13 Percentage distribution of hired laborers engaged by Processors ... 39
Figure 14 Percentage distribution of payment frequency of hired labourers ... 40
Figure 15 Savings Account by type of financial institution ... 43
Figure 16 Monthly sales turnover by fishing season ... 49
LIST OF TABLES
Table 1 Community Distribution of Smoked Fish Processors by Education ... 14Table 2 Distribution of Age of Smoked Fish Processors by Level of Education ... 15
Table 3 Distribution of Smoked Fish Processors by Marital Status and Age ... 16
Table 4 Weekly production volume (in pans) by number of dependents ... 17
Table 5 Distribution of Smoked Fish Processors by Form of Business ... 18
Table 6 Distribution of Fish Processors by alternative livelihoods within the fishing industry ... 19
Table 7 Distribution of Smoked Fish Processors by period engaged in the processing activities. ... 20
Table 8 Ownership of fish smoking stoves by Smoked Fish Processors ... 20
Table 9 Type of stoves used by Smoked Fish Processors ... 21
Table 10 Size of stove used by the Smoked Fish Processors ... 22
Table 11 Reasons for the choice of stove used ... 22
Table 12 Ranking of the factors considered in the choice of stove ... 23
Table 13 Average cost of stove by type ... 23
Table 14 Average Number of Stoves at a time During Bumper Season ... 24
Table 15 Average number of stoves used at a time during the lean season ... 24
Table 16 Total production volume per week in Pans during bumper season ... 24
Table 17 Total volume processed per week by level of education in bumper season ... 24
Table 18 Total volume processed during the lean season per week by level of education ... 25
Table 19 Regional distribution of quantity of Trays processed per week ... 25
Table 20 Distribution of production volume by marital status ... 26
Table 21 Production months of fish processing activities by Region ... 26
Table 22 Processors engaged in fish smoke processing activities during the off-season ... 27
Table 23 Stock of fish processed ... 28
Table 25 Engagement in other economic livelihood activities by Region ... 29
Table 26 Other Economic Activities outside of the fishing industry ... 30
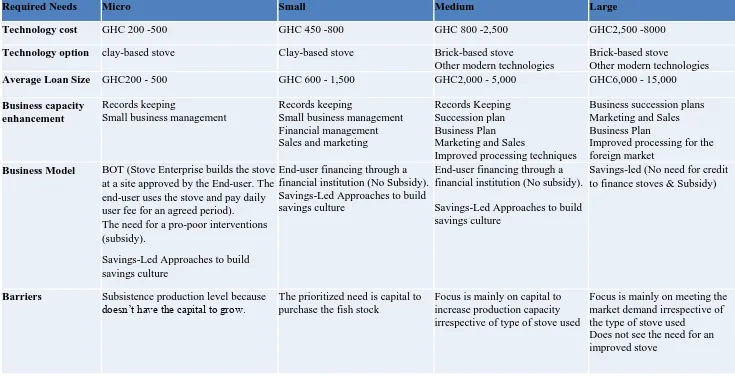
Table 27 Criteria for identifying the MSMEs within the Fish Smoke Processing Business ... 32
Table 28 The Required Needs of the various of Fish ... 34
Table 29 Sources of initial start-up capital of Smoked Fish Processors ... 35
Table 30 Access to storage facility by the Smoked Fish Processors ... 36
Table 31 Alternative storage utilized by Fish Processors without storage facilities ... 36
Table 32 Average working capital of Smoked Fish Processors ... 37
Table 33 Categories of labor force used by the Smoked Fish Processors ... 38
Table 34 The size of the labor force used by the Smoked Fish Processors ... 39
Table 35 Frequency of payment of hired paid laborers ... 40
Table 36 Gender distribution of labor force engaged by the Fish processors ... 41
Table 37 Family members engaged by Smoked Fish Processors ... 41
Table 38 Access to savings account... 42
Table 39 Financial Institutions where Smoked Fish Processors operate savings accounts ... 42
Table 40 Access to Credit ... 43
Table 41 Financial Institutions that provided Credit to the Smoked Fish Processors ... 44
Table 42 The target customers the Smoked Fish Processors sells to ... 45
Table 43 Where processed fish is sold by the Processors ... 45
Table 44 Types of market in which processed smoke fish is sold ... 46
Table 45 Mode of transporting processed smoke fish to the market ... 46
Table 46 Time of selling processed fish ... 47
Table 47 Average Monthly Sales per Processor ... 47
Table 48 Regional distribution of Processors monthly sales lean season ... 48
Table 49 Regional distribution of Processors monthly sales bumper season ... 48
Table 50 The asset base of the Processors ... 50
EXECUTIVE SUMMARY
The Sustainable Fisheries Management Project (SFMP) is a five year project funded by the United States Agency for International Development (USAID) and has committed
approximately $24 million US Dollars to the implementation of the project. The objective of this five-year project (October 2014-October 2019) is to rebuild marine fisheries stocks and catches through adoption of responsible fishing practices. The project contributes to the Government of Ghana’s fisheries development objectives and USAID’s Feed the Future Initiative.
The purpose of this document is to provide a clear picture of the socio-economic conditions in which stove users operate, their needs, and to provide information to help guide project activities. The study adopts socio-economic status as, an economic and sociological combined total measure of a person's work experience and of an individual's or family's economic and social position in relation to others, based on income, education, and
occupation. The segmentation study assessed the socio-economic conditions in relation to the work experience of the processors, their income levels and the level of education. The study among other things also assessed the nature of the operations of the fish processing business and also assets of the processors.
Purpose of the Study
The purpose of the segmentation study is to clearly identify the socio-economic conditions under which the Smoked Fish Processors operate (Stove Users), their needs and provide a clear understanding of the nature of their businesses and operations. The study is also expected to clearly identify key characteristics of the various segments of Smoked Fish Processors in the Central and Western Regions.
Study Methodology
The segmentation study employed both non-probability and some aspects of probability sampling techniques. A total sample size of 160 respondents was utilized for the
segmentation study. The sample size was purposefully determined on the basis of availability of funds and resources for the entire study. A total of 8 communities were also selected from the Central and Western Regions based on where the project had post-harvest interventions. Five (5) communities were in the Central Region and three (3) communities in the Western Region. Within each community, a total of 20 Smoked Fish Processors were randomly selected for one-on-one interviews.
The random selection of the Smoked Fish Processors was carried out at the community level using the table of random numbers generated from a sampling frame (list of fish processors available at the time of visit).
Structured questionnaires were developed and used for the household level personal interviews with the Smoked Fish Processors. Key informant interviews and focus group discussion sessions were also held with selected groups in the two regions. The key informants interviewed were the Chief Fishermen and the Konkonhene/Hemaa in the following communities; Ankobra, Axim, Shama, Elmina, Anlo Beach, Apam, Moree and Winneba.
Field data collection was undertaken using tablets and hard copies of printed questionnaires. A computerized based database was developed for the data entry using Microsoft Access platform and analysis conducted using statistical tools and Microsoft Excel.
Key Results from the Study
1. Demographic Characteristics of the Smoked Fish Processors
A total of 160 respondents were interviewed. Of the total interviewed, the female composition constituted 99%. In all the communities visited, the female Fish Smoke Processor population constituted a greater proportion.
The age structure of the Smoked Fish Processors is of an adult population as majority of them fell within the age category 41 years and above representing 70%. However, the youthful population engaged in smoked fish processing constituted 30%.
Results indicate that more than half of the processors had no form of schooling (58%) whereas 21% had attained middle school/JHS level of education. Primary education level constituted 20% and SHS constituted 1%.
Results indicate that majority of the Smoked Fish Processors had no form of schooling (58%) whereas 21% had attained middle school/JHS level of education. Primary and Senior High School education also constituted 20% and 1% respectively.
2. The Nature of Smoked Fish Processor’s Business
The results indicate that majority (78%) of the Smoked Fish Processors have been engaged in the processing business for a longer period not less than 13 years. This implies that 8 in every 10 processor have been engaged in the business for more than 13 years.
Results from the segmentation study indicate that, majority of the respondents are solely Fish Processors (61%) where as 39% are both Fish Processors and Traders. The results also indicate that majority of the processors are women (99%).
Overall, a lower percentage of the Smoked Fish Processors are engaged in processing activities all year round (12 months) representing 45%. Less than half of the processors are engaged in the smoked fish processing business all year round. The seasonal fluctuation influences the processing activities as during the lean season majority of the processors stay out of business. Some also resort to other diversified income generating activities outside of the fishing industry.
Smoked Fish Processors with 1 - 3 dependents averagely processes 1,893 pans of fish per week during the bumper season. The average production increases as the number of dependents also increases. Smoked Fish Processors with 4 – 6 dependents also processes 5,029 pans of fish per week on the average during the bumper season. Majority of the smoked fish processors convert their dependents as helping hands to assist with processing activities and are able to process large quantities due to the helping hands.
3. Fish Smoking Stoves
Ownership of fish smoking stove by the Smoked Fish Processors is impressively on the higher side (98%) overall. On the regional level, 97% of the Smoked Fish Processors in the Central Region own a fish smoking stoves whereas the Western Region is 100%.
The results indicate that majority (74%) of the processors use the double unit size of stoves for their fish smoking activities. This implies that 7 out of every 10 processor use the double unit fish smoking stove.
Results from the study indicate that the Smoked Fish Processors ranked the capacity of the stove as the number one factor they considered in the choice of stove. Availability of the technology was ranked as the second factor. Cost of the stove was ranked as the third factor and design of the stove was ranked as the fourth factor. Durability of the stove was ranked as the fifth and fuel consumption ranked as the sixth factor considered in the choice of a stove. Emission of fuel and mobility of the stove was ranked as the seventh and eighth factors respectively.
The study results indicate that, the average cost of constructing a traditional/mud stove is GHC79.03 and that of chorkor stove is GHC152.50 excluding the processing trays. Of those with the Morrison stove, the average cost of building the stove is estimated as GHC 1,425.00 which includes 8 processing trays.
The average number of stoves used by the Smoked Fish Processors at a go during the bumper season for the single unit stove is 4. The double unit used at a go during the bumper season is 3 and the triple unit used is 1. The average number of the quadruple unit used at a go during the bumper season by the processors is 3.
Results indicate that, during the lean season the average number of stove used by the
processors per day for the single unit stove reduced by 50% compared to the bumper season. During the lean season, the number of processing in a week reduce from 5 days per week to 3 days per week according to discussants of focus group discussions.
4. Production Capacity and Storage
The study results indicate that the total quantity of smoked fish processed in a week during the bumper season in pans was 11,152 whereas in the lean season, the total quantity of fish processed is 6,359 pans.
A total of 48,905 trays of fish is processed by the Smoked Fish Processors per week during the bumper season in both Central and Western Regions.
Results indicate that the married processors produced large volumes of smoked fish compared to the divorced, widowed and single processors. The married women process averagely 7,427 pans of fish per week the unmarried process averagely 3,725 pans per week during the bumper season.
Fish processors with no form of education produced less volume of fish compared to those with some level of education. The total volume produced per week in pans by fish processors with no schooling during the bumper season constitute 47.6% for Central Region and 43.9% for the Western Region.
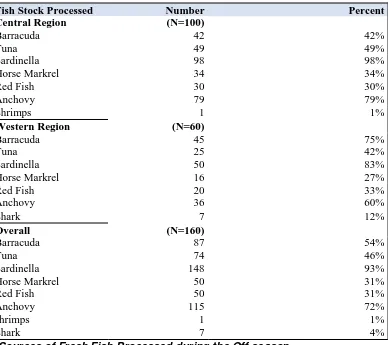
The predominant types of fish stock processed by the Smoked Fish Processors were Sardinella (93%) and Anchovy (72%). Other type of fish stock processed also include Barracuda (54%), Tuna (46%), Horse Markrel (31%), Red Fish (31%), Shark (4%) and Shrimps (1%).
Results from the study indicate that 49% of the Smoked Fish Processors don’t have appropriate storage facilities for storing the processed smoke fish.
than half (41%) of the processors are engaged in other livelihood activities within the fishing industry.
Results indicate that, for the proportion of Smoked Fish Processors engaged in other
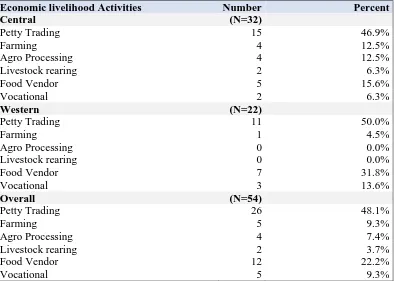
economic livelihood activities outside of the fishing industry, petty trading constitute 48.1%, farming constitute 9.3%, Agro processing 7.4%, livestock rearing 4%, food vendor 22.2% and vocational activities 9.3%.
6. Business Capital
The main source of start-up capital of the Smoked Fish Processors was from their personal savings (53%). More than half of the Smoke Processors raised their initial business start-up capital through personal savings.
A significant proportion of the Smoked Fish Processors also raised their initial business start-up by purchasing the fish stock on credit and later paid back their creditors. Presently, the practice of purchasing fish stock on credit is predominant among the micro and small
processors has majority do not have the requisite working capital to purchase their inputs for fish smoking processing activities.
A higher proportion (61.9%) of the processors have working capital less than GHC5,000.00. This implies that for every 6 out of 10 processors have working capital for smoked fish processing activities less than GHC5,000.00 (USD1,315).
7. Savings and Micro-credit
The results indicate that majority (62.5%) of the smoked fish processors have a savings account. This indicates that 6 in every 10 Fish Smoke Processor operate a savings account with a Financial Institution.
The proportions that operate savings account with Universal Banks constitute 7.3%, those that operate savings account with microfinance companies constitute 39.0% and
Rural/Community Banks constitute 36.6%. Majority of the Smoked Fish Processors save with 1st and 2nd Tier Microfinance Finance Institutions in Ghana.
A greater proportion (61.9%) of the Smoked Fish Processors have never taken a loan facility from a Financial Institution in the country.
Results from the study indicate that 64.4% of the Smoked Fish Processors uses family members as labor for the processing activities. Significant proportions (58.1%) of the Smoked Fish Processors use paid laborers as helping hands for their processing activities.
8. Labor/Helping hands
Results from the study indicate that, of the proportion of Smoked Fish Processors who engaged the services of paid laborers, 52.7% of the processors hired 1 – 3 paid laborers. 40.9% of the processors hired 4 -6 paid laborers and 1.1% hired 7 – 10 paid laborers. A significant proportion of the Smoked Fish Processors hired 10 or more paid laborers.
Results from table 35 indicate that, majority (51.6%) of the Smoked Fish Processors pay their hired laborers on daily basis. More than half of the processors pay their hired laborers on daily basis.
A total of 551 female labor force is engaged by 149 Smoked Fish Processors giving an average of 4 female helping hands per processor. A total of 58 male labor force is engaged by 25 Smoked Fish Processors giving an average of 2 male helping hands per processor.
9. Marketing and Sales
proportion of the processors sell their processed fish to any available customer (66.9%). However, in the Western Region a greater proportion of the processors sell their processed fish to bulk aggregators/buyers compared to processors in the Central Region.
10.Business Needs of the Fish Processors
The business needs identified by the Smoked Fish Processors during the focus group discussion sessions and one-on-one interviews were as follows:
Business working capital loans with lower interest rate and flexible repayment terms. Processing sheds to harness their processing activities.
Improved fish smoking stoves to complement the chorkor stoves as it will reduce the expenditure on fuel wood and reduce the level of smoke inhaled.
Canoe and other fishing boat accessories including outboard motors Pans, processing trays and Processing mats
Refrigerator for keeping the fish fresh
Wire mesh to replace the older and thorn ones on the processing trays Small business management training especially on records keeping and sales Technical training on modern fish smoke processing techniques and storage Conclusion and Recommendations
The classification of the processors heavily depends on their asset base, employee and working capital. Although the national standard for classification of business scale is by the number of employees and asset base, using this as a benchmark for categorizing the
processors would under rate most of the large and medium processors. However using a combination of the number of employees, working capital and the asset base of the processors would provide a true reflection of their business nature.
The segmentation study revealed that, the socio-economic conditions under which the processors operate is influenced by their income, education and access to financial services. Some of the processors operate the business as a family business that employs family members whiles others also resort to hire paid laborers who are not family members. The socio-cultural dynamics also greatly interplay in the business nature of the Smoke Fish Processors as some resort to traditional ways of running their businesses. Majority of the processors have been involved in the fish smoking processing for more than 13 years and have adopted to certain practices such as; storing the processed fish on the stove, use of traditional mud stove passed-on by parents, use of family members as helping hands as well as involving children under age 18 as helping hands.
There is the need to introduce new improved fish smoking stove technology that is capable of handling large size fish stock. Currently most of the processors who processes large size fish stock use the traditional/mud round stove. The processors are unable to smoke the large size fish using the chorkor because the trays do not have the capacity to handle the large fish stock. Those who tried using the trays had to replace the wire mesh on a continuously basis as the wire mesh easily gets thorn due to the weight and size of the fish. The processing trays should be redesigned taking into account the weight and size of the fish stock processed especially for the improved fish smoking stoves.
participation will be necessary to ensure provision of sustainable working capital for the processors.
Enforcement of good fishing practices is necessary to ensure sustainable livelihoods within the fishing industry in Ghana. Majority of the women along the coastal belt of Ghana heavily depend on fish processing as their major economic livelihood activity. Depletion of the fish stock through bad fishing practices would have a negative impact on the livelihoods of these women which would subsequently result in increased poverty levels. Government and development partners need to work together in promoting good fishing practices and enforce laws governing prohibited fishing practices by the Chinese and Ghanaian fishermen. The need to promote alternative livelihoods is necessary to reduce the over-reliance on fish processing activities along the coastal belt of Ghana.
BACKGROUND
1.1 Overview of the Fisheries Industry in Ghana
Ghana has access to significant and valuable stocks of fish. Total domestic production, including aquaculture, is roughly 440,000 tons each year. This fish production is worth in excess of US$ 1billion in income annually. In terms of the overall economy, the fisheries sector accounts for at least 4.5% of GDP. These figures underscore the prominent role that fisheries play in the Ghanaian economy as they have done for many generations past. The cost of producing fish in Ghana is however alarming. The evidence available suggests that fish production costs are approaching or exceeding income in all inshore marine capture fisheries over recent years.
There is also evidence that costs are increasing in inland fishing fisheries and what
profitability that remains is being rapidly dissipated. Tuna fishery production and capacity has remained relatively stable but fishers report escalating costs as fish are migrating offshore and business compliance costs are increasing. Investments in management to address these
problems are however negligible. Fisheries management expenditure in Ghana (measured as a % of total income) is less than 2% of average expenditure in OECD countries (i.e. 17% of revenue).
Overall, there is little or no surplus of income over expenditure in Ghana’s Capture fisheries and where some profitability remains it is being lost. This problem has unfortunately been exacerbated by government social interventions and donor activity that has directly or indirectly subsidized fishing effort. Taking into consideration these government social interventions it is likely that Ghana is paying more to catch and produce fish than they are worth.
There is therefore a real risk that current GDP contributions from this sector are unsustainable into the future and this has macro-economic consequences for Ghana both in terms of
increased poverty and in draining wealth from other sectors of the economy to support the ailing fisheries sector.1
1.2 Overview of the SFMP Project
The Sustainable Fisheries Management Project (SFMP) is a five year project funded by the United States Agency for International Development (USAID) and has committed
approximately $24 million US Dollars to the implementation of the project. The objective of this five-year project (October 2014-October 2019) is to rebuild marine fisheries stocks and catches through adoption of responsible fishing practices. The project contributes to the Government of Ghana’s fisheries development objectives and USAID’s Feed the Future Initiative.
The Sustainable Fisheries Management Project (SFMP) aims to end overfishing of key stocks important to local food security through a multi-pronged approach:
Improved legal enabling conditions for co-management, use rights and effort-reduction strategies
Strengthened information systems and science-informed decision-making
Increased constituencies that provide the political and public support needed to rebuild fish stocks
Implementation of applied management initiatives for several targeted fisheries ecosystems
More than 100,000 men and women involved in the local fishing industry will benefit from this project. USAID has selected the Coastal Resources Center (CRC) at The University of Rhode Island’s Graduate School of Oceanography as lead implementer of the SFMP. In leading the project, CRC will work with The Ministry of Fisheries and Aquaculture Development and the Fisheries Commission along with a consortium of international and local partners, including SNV Netherlands Development Organization, SSG-Advisors, Hen Mpoano, Friends of the Nation, Central & Western Fish Mongers Improvement Association in Ghana (CEWEFIA), DQF Quality Foundation, Development Action Association (DAA), and Spatial Solutions. The project also will contribute to the strengthening of marine and fisheries management capabilities at the University of Cape Coast and coastal spatial planning capacity of districts in the Central and Western Regions.
The SFMP builds on the accomplishments of the USAID-Ghana Integrated Coastal and Fisheries Governance (ICFG) Program. The USAID /Ghana SFMP will focus efforts on the small pelagics fisheries along the entire coastline as well as the demersal fisheries and essential mangrove fish habitat in the Western Region. The project will promote ecosystem-based and adaptive management approaches. Additionally, improvements in the value chain of smoked fish, important to tens of thousands of women fish processors and marketers will be supported. The project also will implement activities aimed at reducing child labor and trafficking in the fisheries sector in the Central Region of Ghana.
1.3 Purpose of the Segmentation Study
The purpose of the segmentation study is to clearly identify the socio-economic conditions under which the Smoked Fish Processors operate (Stove Users), their needs and provide a clear understanding of the nature of their businesses and operations. The study is also expected to clearly identify key characteristics of the various segments of Smoked Fish Processors in the Central and Western Regions.
SURVEY METHODOLOGY
2.1 Scope and Timeframe
This segmentation study was conducted between 1st March and 31st March 2016 and included a desk-based document review, key informant interviews, personal interviews and focus group discussions in both Western and Central Regions of Ghana. The scope of this study was limited to Smoked Fish Processors in the two regions aforementioned.
2.2 Sampling Procedure
The random selection of the Smoked Fish Processors was carried out at the community level using the table of random numbers generated from a sample frame (list of fish processors available at the time of visit).
2.3 Survey Method
Desk Review: A document map, linking key documents to the main areas of review for the segmentation study was drafted and information obtained from the documents was mapped against the areas of segmentation questions and key data extracted to inform the analysis. Key documents reviewed were; the baseline study report, SFMP annual work plan document and project reports at SNV level.
Household Surveys: A household survey targeting the Smoked Fish Processors in their respective communities. The household survey was undertaken in selected 8 communities namely; Ankobra, Axim, Shama, Anlo Beach, Elmina, Moree, Apam and Winneba in the Western and Central Regions respectively. The household survey was conducted within a total of 10 days with an average of 1 day spent in each community.
Structured questionnaires were developed and used for the household level personal
interviews with the Smoked Fish Processors. The household survey questionnaire was in three parts A, B and C. Part A of the questionnaire covered demographic characteristics of the respondents. Part B covered the business nature of the Smoked Fish Processors and the final section C covered the business assets and operations of the Smoked Fish Processors.
Prior to the field data collection, the questionnaires developed were pre-tested at SNV level to ascertain the flow of the questions and its relevance to purpose of the survey. The final draft questionnaires were forwarded to SFMP M&E Team for the input before the questionnaires were finalized. The finalized questionnaire were put on tablets and hard copies also presented for the field data collection.
Key Informant Interviews: Key informant interviews were conducted in Greater Accra, Central and Western Regions. A total of 22 key respondents participated in the key informant interviews. The key informants interviewed included; Implementing partner staff, SNV SFMP Project Staff, Chief Fishermen and the Konkonhene/Hemaa in the following communities; Ankobra, Axim, Shama, Elmina, Anlo Beach, Apam, Moree and Winneba.
Focus Group Discussions: A series of six (6) focus group discussions were carried out in the Greater Accra, Central and Western Regions to gather information to complement the desk-review and the key informant interviews. In total, over 200 people including 180 females and 20 males were interviewed. The focus group discussions were made of discussants from implementing partner Institutions such as, SNV, DAA, DASGIFT and CEWEFIA. The primary discussants of the focus group discussions were drawn from; NAFPTA, Smoked Fish Processors, Chief Fishermen and Konkonhene/Hemaa.
2.4 Field Data Collection, Management and Analysis
Highly skilled personnel were recruited and trained to undertake the field data collection. These personnel were already SNV staff working with the SFMP project. These attended a 2-day training programme during which the Lead Consultant took them through the various sections of the questionnaire including the concepts and definition used. Key words during the training were translated into the local languages of the targeted areas of the survey.
administered through direct interviews with the Smoked Fish Processors. The average time spent per interview was 45 minutes. The questionnaires were administered by four (4) trained enumerators with translation done in the local language of the respondents.
2.5 Data Management and Analysis
A computerized based database was developed for the data entry using Microsoft Access platform and analysis conducted using statistical tools and Microsoft Excel. Data entered into the database was thoroughly cleaned and verified before the analysis was carried out.
2.6 Validation of Results
A 2-day validation workshop was organized to review the results of the segmentation study and the business model options report as well as the investment impact tool from 27th -28th April, 2016 at Erata Hotel, East Legon-Accra. The validation workshop allowed for
discussions on the results of the study and findings validated through brainstorming sessions. The following organizations attended the validation workshop; Microfin Rural Bank,
GRATIS Foundation, Best Performance Company, Food Research Institute, Morrison Energy, DAA, CEWEFIA, Fisheries Commission and the Smoked Fish Processors. The outcome of the validation workshop enriched the segmentation study report.
2.7 Study Limitations
Although all efforts were made to meet with and talk to as many relevant respondents as possible during course of this segmentation study, a number of logistical and practical factors prevented this from being entirely successful. Some of the limitations of this study include:
Due to resource constraints relating to budget for the study, well-structured probability sampling procedure could not be followed and sample size was not statistical
determined.
Due to time constraints, it was not possible to hold the focus group discussion sessions at the community level with the Fish Processors.
As a result of external events such as market days, funerals and political events, the list of sampled respondents determined through statistical procedure from a sampling frame of database of Smoke fish processors in consultation with the SFMP M&E Team could not be followed entirely.
The unit of measure for the processing pans is not standardized as it differs from one community to the other. It was difficult to convert the pans into carton and carton to pans due to differences in weight of the pans.
FINDINGS ON SOCIO-ECONOMIC CONDITIONS UNDER WHICH SMOKED FISH PROCESSORS
OPERATE
RESULTS OF THE SEGMENTATION STUDY
3.1 Demographic Characteristics of the Respondents
3.1.1 Distribution of the Respondents by Sex
A total of 160 respondents were interviewed. Of the total interviewed, the female composition constituted 99%. In all the communities visited, the female Fish Smoke
Processor population was dominated. Except for Elmina which the female constituted 95% of the total respondents interviewed.
Figure 3 Distribution of Respondents by Sex
3.1.2 Distribution of Respondents by level of Education
The level of education of the Smoked Fish Processors were also assessed and results indicate that majority of the Smoked Fish Processors had no form of schooling (58%) whereas 21% had attained middle school/JHS level of education. Primary and Senior High School education also constituted 20% and 1% respectively.
At the community level, the percentage of Smoked Fish Processors with no schooling is relatively higher for Moree compared to the rest of the communities followed by Winneba (75%). The highest level of education for the Smoked Fish Processors is Senior High School with just 1% within that category of education level.
Table 1 Community Distribution of Smoked Fish Processors by Education
N = 160 (overall) Community Middle
School/JHS
No Schooling Primary SHS
Ankobra 40% 35% 25% 0%
Anlo Beach 10% 50% 40% 0%
Apam 15% 55% 25% 5%
Axim 20% 60% 15% 5%
Elmina 40% 45% 15% 0%
Moree 10% 90% 0% 0%
Shama 25% 55% 20% 0%
Winneba 5% 75% 20% 0%
Overall 21% 58% 20% 1%
3.1.3 Distribution of Smoked Fish Processors by Age
From figure 4, the age structure of the Smoked Fish Processors is of an adult population as majority of them fell within the age category 41 years and above representing 70%. However, the youthful population engaged in fish smoke processing constituted 30%.
Comparing the age structure of the fish processors with their level of education, the results indicate that the category of the processors with the highest level of education were those above age 40 years. For those who attained Middle School/JHS level of education, the adult population constituted 79% and adult population 66% for primary level of education. The adult population for no schooling constituted 67% of the total processors.
Table 2 Distribution of Age of Smoked Fish Processors by Level of Education
Education/Age Number Percent
Middle School/JHS (N =33)
18 - 30 years 1 3%
31 - 40 years 6 18%
41 - 49 years 10 30%
50 and Above 16 49%
No Schooling (N=93)
18 - 30 years 13 14%
31 - 40 years 18 19%
41 - 49 years 25 27%
50 and Above 37 40%
Primary (N=32)
18 - 30 years 2 6%
31 - 40 years 9 28%
41 - 49 years 13 41%
50 and Above 8 25%
SHS (N=2)
41 - 49 years 1 50%
50 and Above 1 50%
3.1.4 Marital Status of Smoked Fish Processors
The married Smoked Fish Processors constitutes 69% of the total of 160 processor
Figure 6 Distribution of Smoked Fish Processors by Marital Status
Comparing marital status with the age of the Smoked Fish Processors, the results indicate that among the divorced population, 84% are above aged 41 years. On the other hand, Widowed are also above aged 41 years and above with just 6% below aged 41 years. However, the age distribution for the married class ranged between 18 years and above with majority (63%) of the married class within ages 41 and above.
Table 3 Distribution of Smoked Fish Processors by Marital Status and Age
Marital Status/Age Number Percent
Divorced (N=32)
18 - 30 years 1 3%
31 - 40 years 4 13%
41 - 49 years 11 34%
50 and Above 16 50%
Married (N=110)
18 - 30 years 14 13%
31 - 40 years 27 25%
41 - 49 years 35 32%
50 and Above 34 31%
Single (N=2)
18 - 30 years 1 50%
31 - 40 years 1 50%
Widowed (N=16)
31 - 40 years 1 6%
41 - 49 years 3 19%
3.1.5 Distribution of Smoked Fish Processors by Number of Dependents
Most of the Smoked Fish Processors have a number of dependents who usually look up to them for their daily livelihood. Some were directly their biological children while others were either direct or indirect relatives who reside with them. The family size of the typical Smoked Fish Processors were usually very large as these translated into the labor force. The results gathered indicate that 80% of the Smoked Fish Processors have 4 or more dependents living with them whereas 20% have less than 4 dependents living with them.
There is a positive correlation between the production volumes of the Smoked Fish
Processors and the number of dependents which they usually convert them into labor force for their processing activities especially for the Central Region and overall. The Smoked Fish Processors with large number of dependents tends to have higher weekly production volumes compared with those with fewer dependents during the bumper season.
Smoked Fish Processors with 1 -3 dependents averagely processes 1,893 pans of fish per week. The average production increases as the number of dependents also increases. Smoked Fish Processors with 4 – 6 dependents also processes 5,029 pans of fish per week on the average. On regional level, the situation is not different as there is a general trend in terms of the number of dependents and production volumes of the Processors.
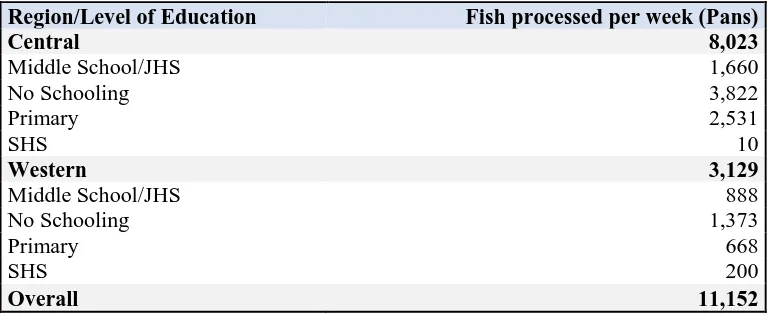
Table 4 Weekly production volume (in pans) by number of dependents
Region/Number of Dependents Fish processed per week (Unit in Pans)
Central 8,023
1 – 3 1,551
4 – 6 3,007
7 and above 3,465
Western 3,129
1 – 3 342
4 – 6 2,022
7 and above 765
All (Weekly volume in Pans) 11,152
1 – 3 1,893
4 – 6 5,029
Figure 7 Distribution of Smoked Fish Processors by Number of Dependents
3.2 The Business Nature of Fish Smoke Processing Business
3.2.1 The forms of business undertaken by the Processors
Results from the segmentation study indicate that majority of the respondents were solely Fish Processors representing (61%) where as 39% were both Fish Processors and Traders. It was also found that not all were entirely fish smoke processors as others were also engaged in fish trading activities. At the regional level, the trend was same as higher proportion of the processors were solely fish processors who process and distribute their processed fish to off-takers for sale on the market. The results also indicate that 2 in every five fish processors are also traders implying that they often travel to district, regional and other West African countries’ markets to sell their processed fish. The involvement of middle women/off-takers is predominant in the two regions as activities of the fish traders were evident in most fishing communities.
Table 5 Distribution of Smoked Fish Processors by Form of Business
Region/Form of Business Number Percent
Region/Form of Business Number Percent
Central (N=100)
Fish Processor 58 58%
Fish Processor and Trader 42 42%
Western (N=60)
Fish Processor 40 67%
Fish Processor and Trader 20 33%
All (N=160)
Fish Processor 98 61%
During the focus group discussion, the discussants indicate that they were often cheated by the middle women/off-takers. The discussants also indicate that the large and medium scale processors usually have strong bargaining power/capacities compared to the micro and small processors. The discussant also mentioned that the micro and small scale processors usually sell their processed fish directly on the market that is doubles as fish traders.
3.2.2 Alternative livelihoods within the fishing industry
The Smoked Fish Processors also undertake other livelihood activities within the fishing industry apart from fish smoking. Results from the study indicate that less than half (41%) of the processors are engaged in other livelihood activities in the fishing industry.
Figure 8 Distribution of Smoked Fish Processors by other forms of fish processing activities undertaken
However, 41% of the processors are engaged in other forms of fish processing activities such as fish salting (Bomone), fish drying (kakoo/Keta school boys) and Fish frying (Nkyenam). Of the number engaged in alternative livelihood options within the fishing industry, majority of them are engaged in fish salting (67%).
Table 6 Distribution of Fish Processors by alternative livelihoods within the fishing industry
(N=66)
Other forms of Fish Processing Number Percent
Drying 12 18%
Frying 10 15%
Salting 44 67%
During the focus group discussions, the discussants were of the view that some of the processors usually undertake fish salting when they were faced with challenges with the fish going bad. They also attributed this to the readily available market for salted fish compared to dried and fried fish.
3.2.3 Period engaged in Fish Smoke Processing Activities
Smoked Fish Processors have been engaged in the processing business for more than 13 years and the Western Region is 82%. The results indicate that 8 in every 10 Smoked Fish
Processors have been engaged in the processing activity for more than 13 years.
Table 7 Distribution of Smoked Fish Processors by period engaged in the processing activities.
Region/Years engaged in
Processing Number Percent
Central (N=100)
3.2.4 Ownership of Fish smoking stove
The primary equipment used for fish smoking processing is a fish smoking stove whether improved or unimproved. Ownership of a fish smoking stove is essential to the business operations of the Smoked Fish Processor. Ownership of fish smoking stove by the processors was on the higher side (98%) overall. On the regional level, 97% of the Smoked Fish
Processors in the Central Region own a fish smoking stoves whereas 100% in the Western Region also own a stove. Results from table 8 indicate that ownership of fish smoking stove is relatively higher in Western Region compared to the Central Region. Of the number who do not own stoves, they indicated renting the fish smoking stoves for their processing activities.
Table 8 Ownership of fish smoking stoves by Smoked Fish Processors
Region/Stove Ownership Number Percent
3.2.5 Types of Stove Used by Smoked Fish Processors
The predominant type of fish smoking stove used by the Smoked Fish Processors is the Chorkor stove (88%) followed by the traditional/Mud stove (41%). 6% and 1% use Morrison and Frismo/Kosmos stoves respectively. The use of an improved fish smoking stoves by the Smoked Fish Processors was not predominant in the two regions.
Table 9 Type of stoves used by Smoked Fish Processors
N=160
Type of Stove Used Number Percent
Chorkor 140 88%
Frismo/Kosmos 1 1%
FTT 0 0%
Tradition/Mud 66 41%
Morrison 9 6
Figure 9 Gallery of Types Fish Smoking Stoves Currently being used by Smoked Fish Processors
The discussants outlined the following as reasons for the wide spread use of the chorkor and the traditional/mud stoves:
The chorkor and the traditional/mud stoves can easily be constructed/built by local artisans and some of the women.
The presence of local artisans to build the chorkor or traditional/mud stoves using readily available local materials makes it cheaper to build.
The traditional/mud stove can smoke any type and size of fish. It is capable of smoking both large and small fish stocks.
The chorkor or traditional/mud stoves are easy to maintain.
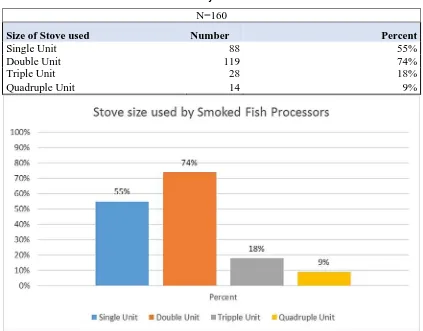
3.2.6 Size of stove used by the Smoked Fish Processors
Table 10 Size of stove used by the Smoked Fish Processors
N=160
Size of Stove used Number Percent
Single Unit 88 55%
Double Unit 119 74%
Triple Unit 28 18%
Quadruple Unit 14 9%
Figure 10 Bar chart showing the types of stoves used by the Smoked Fish Processors
3.2.7 Reasons for the choice of stove used
The majority of the processors indicated the cost of stove (86%) as the primary reason for the choice of stove used followed by availability of the stove (64%). Some also inherited the stove (38%) from their parents. Other reasons such as capacity of the stove (24%), fuel consumption (21%) and design of the stove (19%) as other reasons for the choice of stove. Less than 12% of the processors based the choice of stove on the fuel emission
Table 11 Reasons for the choice of stove used
Reasons for choice of stove Number (N=160) Percent
Cost of stove 138 86%
Design of stove 30 19%
Durability 15 9%
Mobility 5 3%
Inherited 61 38%
Availability 102 64%
Fuel Consumption 33 21%
Fuel Emission 18 11%
3.2.8 Ranking of the most important factors that influenced the choice of stove
Results from the study indicate that the Smoked Fish Processors ranked the capacity of the stove as the number one factor they considered in the choice of stove. Availability of the technology was ranked as the second factor. Cost of the stove was ranked as the third factor and design of the stove was ranked as the fourth factor. Durability of the stove was ranked as the fifth and fuel consumption ranked as the sixth factor considered in the choice of a stove. Emission of fuel and mobility of the stove was ranked as the seventh and eighth factors respectively. In general, the five most important factors considered by the processors in the choice of a stove are capacity of the stove, availability of the stove technology, cost of the stove, and design of the stove and durability of the stove.
Table 12 Ranking of the factors considered in the choice of stove
Most Important
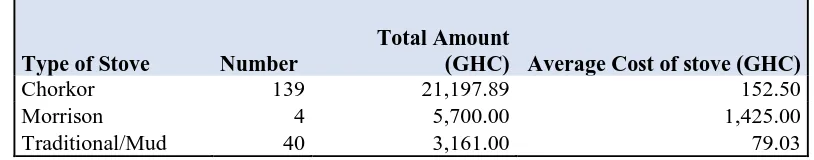
3.2.9 Average Cost of stove by Type
The average cost of constructing a traditional/mud stove is GHC79.03 and that of chorkor stove is GHC152.50 without processing trays. Of those with the Morrison stove, the average cost of building the stove was estimated as GHC1,425.00 with the processing trays.
Comparing the average cost of the improved stove with the unimproved stoves, generally the cost of building the improved fish smoking stove is relatively higher than the unimproved stove. The average cost of the Morrison stove is approximately 9 times the average cost of the chorkor stove.
Table 13 Average cost of stove by type
Type of Stove Number
Total Amount
(GHC) Average Cost of stove (GHC)
Chorkor 139 21,197.89 152.50
Morrison 4 5,700.00 1,425.00
Traditional/Mud 40 3,161.00 79.03
3.2.10 Stove utilization by Processors
Table 14 Average Number of Stoves at a time During Bumper Season
stove Utilization
During Bumper Season Number Total Number used
Average Stove Used at a time
Single Unit 85 367 4
Double Unit 114 357 3
Triple 27 38 1
Quadruple 6 19 3
During the lean season, the average number of stoves used by the processors at a time for the single unit stove reduced by 50% compared to the bumper season. Generally, the average number of stoves used by the processors at a time during the lean season reduces compared to the bumper season. During the lean season, the processors on the average use 2 of the double unit at a time and 2 of the quadruple unit a time compared to 3 units of double and 3
quadruple unit.
Table 15 Average number of stoves used at a time during the lean season
stove Utilization
During lean Season Number Total Number used Average Stove Used
Single Unit 61 152 2
Double Unit 85 149 2
Triple 8 11 1
Quadruple 4 7 2
3.2.11 Fish Smoke Production volumes
Production volume during the bumper harvest
From table 16, the total quantity of smoke fish processed in a week during the bumper season in pans is 11,152. The standard unit of measure at the local level for the fish processors is in pans.
Table 16 Total production volume per week in Pans during bumper season
Region/Stove Ownership Total Production in a week (Pans)
Central 8,023
Western 3,129
Overall 11,152 Comparing the levels of production per week in pans with the level of education of the fish processor reveals very interesting trends in both Central and Western Regions. Fish
processors with no form of education produces less volume of fish compared to those with some level of education. The total volume produced per week in pans by fish processors with no schooling constitutes 47.6% for Central Region and 43.9% for the Western Region.
Table 17 Total volume processed per week by level of education in bumper season
Production volumes during the lean season
During the lean season the fish processors unit of measure is usually in pans and cartons. This is because during the lean season some of the processors purchase their fish stock from the cold store while others get some fish stock from the fishermen but often in limited stock. In the lean season, the total quantity of fish processed is 6,359 pans (2 large pans equivalent to 1 carton).
Table 18 Total volume processed during the lean season per week by level of education
Region/level of education
Volume processed per week (Pans)
Volume Processed per week (Cartons) Central 1,131 2,065 Middle School/JHS 365 1,050 No Schooling 398 608 Primary 368 407
SHS - -
Western 278 410 Middle School/JHS 109 18 No Schooling 143 155 Primary 26 37
SHS - 200
Overall 1,409 2,475
Number of Processing Trays Produced per Week during the bumper harvest
Table 19 indicates that, a total of 48,905 trays of fish is processed by the Smoked Fish Processors per week during the bumper season in both Central and Western Regions. On the average, a total of 6,488 trays of fish is processed per community in Central Region per week during the bumper season compared to 5,488 per community in the Western Region. The overall average of total trays processed per community during the bumper season is 6,113.
Table 19 Regional distribution of quantity of Trays processed per week
Region
Number of trays processed per week
Average trays processed per community
Central 32,442 6,488 Western 16,463 5,488 Overall 48,905 6,113
Table 20 Distribution of production volume by marital status
Marital
status Number Production Volume in Pans
Central 100 8,023
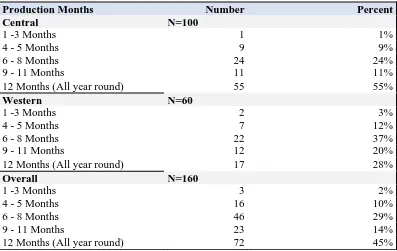
3.2.12 Period of Production in a Year
Overall, a lower percentage of the Smoked Fish Processors were engaged in processing activities all year round (12 months) representing 45%. This implies that 55% of the
processors do not undertake the fish processing activities all-year round. A greater proportion (55%) of the processors were engaged in processing activities between 1 to 11 months.
Table 21 Production months of fish processing activities by Region
Production Months Number Percent
Central N=100
Table 22 Processors engaged in fish smoke processing activities during the off-season
Processors engaged in fish smoke
processing during off season Number Percent
Central Region (N=100)
No 25 25%
Yes 75 75%
Western Region
(N=60)
No 28 47%
Yes 32 53%
Overall (N=160)
No 53 33%
Yes 107 67%
The key informants attributed the regional dynamics in the production months to the following;
In the central Region most of the Smoked Fish Processors usually resort to the cold store during the lean season either from Tema or CIKO.
The off-takers in the Western Markets usually do not purchased iced fish (cold store) processed. That is there is not readily available market for iced fish processed (cold store).
The Fisheries Commission in the Western Region have duly sensitized the Smoked Fish Processors not to purchase the CIKO stock for processing.
The fish stock in the Western Region have depleted due to the presence of the fishing harbor and due to the oil drilling activities in the Region, the fishermen are not able to get substantial catch during the lean season.
The processors in the Central Region usually process the iced fish for the Greater Accra markets. There exist readily available markets for the processed iced fish for the processors in the Central Region compared to the Western.
3.2.13 Type of Fish Stock Processed
Table 23 Stock of fish processed
Fish Stock Processed Number Percent
Central Region (N=100)
Barracuda 42 42%
Tuna 49 49%
Sardinella 98 98%
Horse Markrel 34 34%
Red Fish 30 30%
Anchovy 79 79%
Shrimps 1 1%
Western Region (N=60)
Barracuda 45 75%
Tuna 25 42%
Sardinella 50 83%
Horse Markrel 16 27%
Red Fish 20 33%
Anchovy 36 60%
Shark 7 12%
Overall (N=160)
Barracuda 87 54%
Tuna 74 46%
Sardinella 148 93%
Horse Markrel 50 31%
Red Fish 50 31%
Anchovy 115 72%
shrimps 1 1%
Shark 7 4%
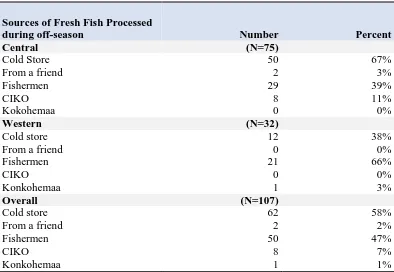
3.2.14 Sources of Fresh Fish Processed during the Off-season
Table 24 The Sources of fresh fish stock for processing during the off-season
Sources of Fresh Fish Processed
during off-season Number Percent
Central (N=75)
At the regional level, the main source of fresh fish processed in the off-season in the Western Region is fishermen (66%) and that of Central Region is from cold store (67%). In the
Central Region, 11% of the processors purchase their fresh from CIKO during the off-season. During the focus group discussions, the discussants indicated that the main source of fresh fish processed during the off-season is from the cold stores at Tema fishing harbor and the other major cold stores in Takoradi.
3.2.15 Other Economic livelihood Activities outside the fishing industry
Apart from the fish processing activities undertaken, the some of the processors are also engaged in other diversified sources of income. Results from the study indicate that 36% of the processors are engaged in other economic livelihood activities outside of the fishing industry.
Table 25 Engagement in other economic livelihood activities by Region
Region/Engage other Economic
livelihoods Number Percent
Central (N=100)
Engaged in other economic livelihoods 34 34%
Western (N=60)
Engaged in other economic livelihoods 23 38%
Overall (N=160)
Engaged in other economic livelihoods 57 36%
3.2.16 Other Economic Livelihood Activities
Table 26 indicates that, for the proportion of Smoked Fish Processors engaged in other
Table 26 Other Economic Activities outside of the fishing industry
Economic livelihood Activities Number Percent
Central (N=32)
Petty Trading 15 46.9%
Farming 4 12.5%
Agro Processing 4 12.5%
Livestock rearing 2 6.3%
Food Vendor 5 15.6%
Vocational 2 6.3%
Western (N=22)
Petty Trading 11 50.0%
Farming 1 4.5%
Agro Processing 0 0.0%
Livestock rearing 0 0.0%
Food Vendor 7 31.8%
Vocational 3 13.6%
Overall (N=54)
Petty Trading 26 48.1%
Farming 5 9.3%
Agro Processing 4 7.4%
Livestock rearing 2 3.7%
Food Vendor 12 22.2%
Vocational 5 9.3%
During the focus group discussion, the processors mentioned that diversified livelihood activities outside of the fishing industry are usually undertaken during the lean season and its intensity goes down during the bumper season because much focus is centered on processing activities to maximize the opportunity. They also indicated that during the bumper season, financial and material resources are mostly channeled towards fish processing with little injection in the alternative livelihoods outside of the fishing industry.
3.3 The Business Assets and Operation of Smoked Fish Processors
Fish smoking processing is an intensive economic livelihood activity that requires some key inputs and equipment. The scale of the business is determined by the number of employees and the equipment base of the processors characterized by the working capital base. There are distinctively various levels and categories of Smoked Fish Processors spanning from micro to large scale processors. There are unique features that influence the operation of the micro, small, medium and large scale Smoked Fish Processors in the country and each category is characterized by the employees, assets and working capital base of the processor.
UNIDO’s Definition of MSMEs for Developing Countries Large - firms with 100+ workers
Medium - firms with 20 - 99 workers Small - “ “ 5 - 19 workers
Micro - “ “ < 5 workers
The definition of MSMEs by the National Board for Small Scale Industries remains the most appropriate for country context.
“The National Board for Small Scale Industries describes Micro and Small Enterprises as those enterprises employing 29 or fewer workers. Micro enterprises are those that employ
between 1-5 people with fixed assets not exceeding 10,000 USD excluding land and building. Small enterprises employ between 6 and 29 or have fixed assets not exceeding
100,000 USD, excluding land and building.
The National Board for Small Scale industries (NBSSI) further classified MSMEs as follows: Micro enterprise: less than 5 employees;
Small enterprise: 6 - 29 employees;
Medium enterprise: 30 - 99 employees; and Large enterprise: 100 and more employees.
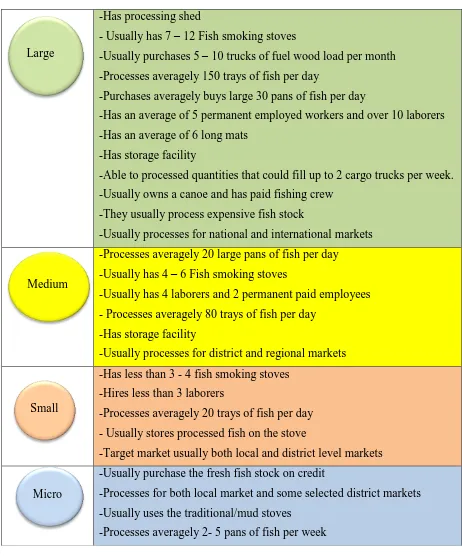
The study among other things assessed the employee, asset and working capital base of the processors. During the focus group discussion sessions with the processors, the discussants clearly outlined the criteria that should be used in identifying the MSMEs processors and the socio-economic characteristics that distinguishes the level of scale of the smoked fish
Table 27 Criteria for identifying the MSMEs within the Fish Smoke Processing Business
Large
-Has processing shed
- Usually has 7 – 12 Fish smoking stoves
-Usually purchases 5 – 10 trucks of fuel wood load per month -Processes averagely 150 trays of fish per day
-Purchases averagely buys large 30 pans of fish per day
-Has an average of 5 permanent employed workers and over 10 laborers -Has an average of 6 long mats
-Has storage facility
-Able to processed quantities that could fill up to 2 cargo trucks per week. -Usually owns a canoe and has paid fishing crew
-They usually process expensive fish stock
-Usually processes for national and international markets
Medium
-Processes averagely 20 large pans of fish per day -Usually has 4 – 6 Fish smoking stoves
-Usually has 4 laborers and 2 permanent paid employees - Processes averagely 80 trays of fish per day
-Has storage facility
-Usually processes for district and regional markets
Small
-Has less than 3 - 4 fish smoking stoves -Hires less than 3 laborers
-Processes averagely 20 trays of fish per day - Usually stores processed fish on the stove
-Target market usually both local and district level markets
Micro
-Usually purchase the fresh fish stock on credit
-Processes for both local market and some selected district markets -Usually uses the traditional/mud stoves