MANAGEMENT PROJECT (SFMP)
Independent Evaluation Report on
the Morrison Stove
For more information on the Ghana Sustainable Fisheries Management Project, contact: USAID/Ghana Sustainable Fisheries Management Project
Coastal Resources Center
Graduate School of Oceanography University of Rhode Island
220 South Ferry Rd.
Narragansett, RI 02882 USA
Tel: 401-874-6224 Fax: 401-874-6920 Email: [email protected]
Citation: Odjidja, E., Yeboah, D., Abgekpornu, H., Manu, S. and K. Beran. (2016). Morrison Stove Independent Evaluation Report. The USAID/Ghana Sustainable Fisheries Management Project (SFMP). Fisheries Commission, Ministry of Fisheries and Aquaculture Development, and Coastal Resources Center,
Graduate School of Oceanography, University of Rhode Island. Narragansett, RI. GH2014_ACT088_CRC. 58 pp.
Authority/Disclaimer:
Prepared for USAID/Ghana under Cooperative Agreement (AID-641-A-15-00001), awarded on October 22, 2014 to the University of Rhode Island, and entitled the USAID/Ghana Sustainable Fisheries Management Project (SFMP).
This document is made possible by the support of the American People through the United States Agency for International Development (USAID). The views expressed and opinions contained in this report are those of the SFMP team and are not intended as statements of policy of either USAID or the cooperating organizations. As such, the contents of this report are the sole responsibility of the SFMP team and do not necessarily reflect the views of USAID or the United States Government.
Detailed Partner Contact Information:
USAID/Ghana Sustainable Fisheries Management Project (SFMP) 10 Obodai St., Mempeasem, East Legon, Accra, Ghana
Telephone: +233 0302 542497 Fax: +233 0302 542498 Brian Crawford Chief of Party [email protected]
Najih Lazar Senior Fisheries Advisor [email protected] Patricia Mensah Communications Officer [email protected]
Bakari Nyari Monitoring and Evaluation Specialist [email protected] Don Robadue, Jr. Project Manager, CRC [email protected]
Justice Odoi USAID Administrative Officer Representative [email protected]
Kofi.Agbogah #3 Third Nautical Close,
Nungua, Accra, Ghana
[email protected] Daasgift Quality Foundation
Headmaster residence, Sekondi College Sekondi, Western Region, Ghana 233 243 326 178
For additional information on partner activities:
CRC/URI: http://www.crc.uri.edu CEWEFIA: http://cewefia.weebly.com/
DAA: http://womenthrive.org/development-action-association-daa Daasgift:
https://www.facebook.com/pages/Daasgift-Quality-Foundation-FNGO/135372649846101 Friends of the Nation: http://www.fonghana.org Hen Mpoano: http://www.henmpoano.org
SNV: http://www.snvworld.org/en/countries/ghana SSG Advisors: http://ssg-advisors.com/
ACKNOWLEDGEMENTS
We would like to thank the Fisheries Commission Post-Harvest and Monitoring and
Evaluation Unit of the Ministry of Fisheries and Aquaculture Department for promoting the idea of an independent evaluation for the Morrison stove piloted through SFMP and
promoted via SNV Netherland development Organization. We particularly wish to thank Madam Doris Yeboah for dedicating her time and guidance of this research and to Mr. Samuel Manu for his immense support and collaboration regarding this important task and for taking time to participate in community field surveys.
We commend the entire enumeration team, which includes Doris Yeboah, Joseph Effah Ennin, Prince Akwabeng, Promise Gavor, Samuel Manu, Fuseina Issah, Michael Kodie, Salahudeen, Hayford Agbekpornu, Patrick Boafo, Anthony Appiah and others for their tireless commitment during data collection. This acknowledgement would not be complete without acknowledging the technical input and efforts of Emmanuel Victor Odjidja,
Monitoring, Evaluation and Communications Officer at Sustainable Fisheries Management Project and Dr. Brian Crawford, Chief of Party.
ACRONYMS
CRC Coastal Resources Center
CR Central Region
CSIR Council for Scientific Research DAA Development Action Association
DF Degrees of Freedom
FC Fisheries Commission
FAO Food and Agriculture Organization of the United Nations FRI Food Research Institute
GIS Geographic Information System GoG Government of Ghana
GPS Geographic Positioning System IFSS Improved Fish Smoking Stove IR Intermediate result
MOFAD Ministry of Fisheries and Aquaculture Development M&E Monitoring and Evaluation
NAFPTA Ghana National Fish Processors and Traders Association NGO Non-Government Organization
NS Not significant
PAH Polycyclic Aromatic Hydrocarbon
SFMP Sustainable Fisheries Management Project of USAID Ghana SNV Netherlands Development Organization
TABLE OF CONTENTS
Page
Acknowledgements ... iii
Acronyms ...iv
Table of Contents ... v
List of Figures ... vi
List of Tables ...vii
Executive Summary ...1
Introduction ...4
Report Layout ... 4
SFMP Overview ... 4
Background ... 4
Purpose of the Independent Evaluation ...4
Methodological Overview ...5
Survey Design ... 5
Area of the Study ... 5
Sampling ... 6
Sample Size Calculation ... 7
The Survey Instrument ... 7
Survey Implementation ... 7
Enumerator Recruitment and Training... 7
Pre-testing the Questionnaire ... 8
Field Work ... 8
Survey Limitations ... 8
Findings Morrison Stove Beneficiaries ... 9
Individual Characteristics of Respondents ... 9
Information on processing activities ... 10
Control Group (Non-beneficiaries) ... 25
Traders... 27
Focus group discussions ... 29
Discussion...31
Recommendations ...33
LIST OF FIGURES
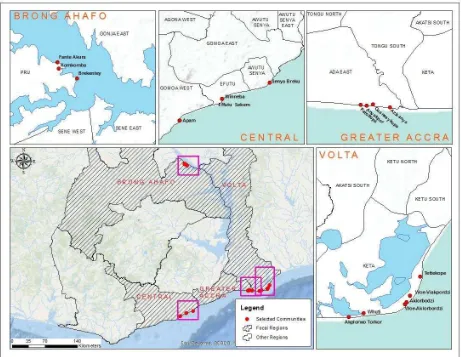
Figure 1. Regions and communities where the surveys were carried out ... 6
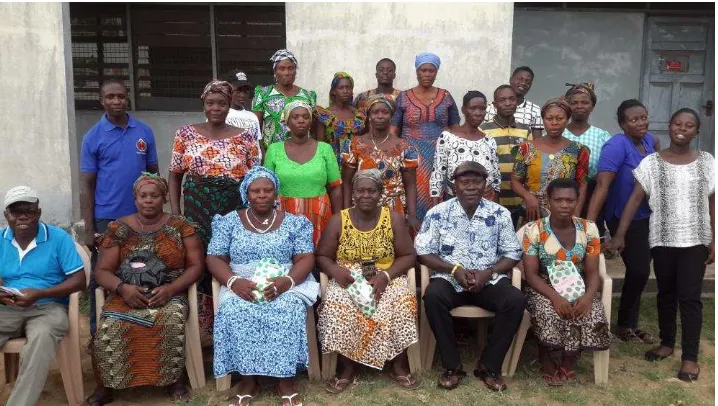
Figure 2: Cross-section of focus group participants ... 8
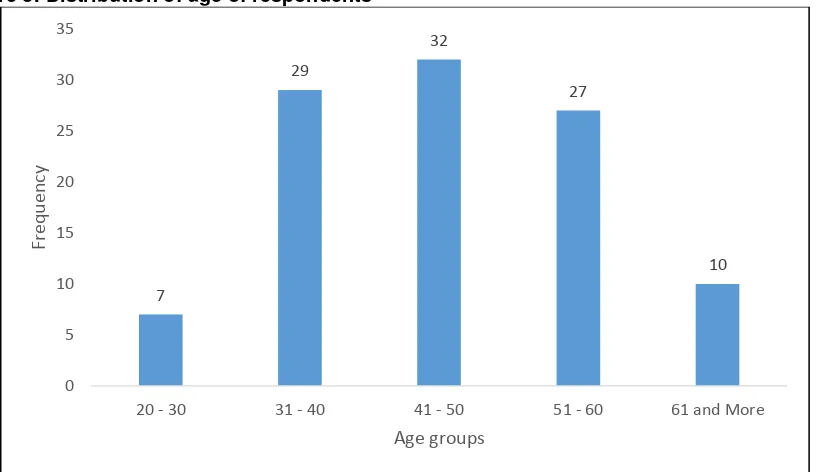
Figure 3: Distribution of age of respondents ... 9
Figure 4: Reasons for preference of Morrison stove ... 14
Figure 5: Challenges using Morrison stove ... 24
Figure 6: Types of non-adopters ... 25
Figure 7: Reasons for stove preference ... 29
Figure 8: Focus group discussion in session in the Central region ... 30
LIST OF TABLES
Table 1: Types of groups sampled in the survey ... 6
Table 2: Number of beneficiaries sampled per region (N=105) ... 9
Table 3: Descriptive statistics for age of respondents (N=105) ... 9
Table 4: Gender of respondents (N=105) ... 10
Table 5: Descriptive statistics for number of dependents (N=105) ... 10
Table 6: Percent Distribution of Religion of respondents by Region ... 10
Table 7: Type of business activity (% of respondents) undertaken per region ... 11
Table 8: Type of fish processing ... 11
Table 9: Most important type of fish processed per region ... 12
Table 10: Comparing types of fish processed with preference of Morrison stove ... 12
Table 11: Previous processing technology used before the Morrison stove ... 13
Table 12: Preference of Morrison stove to others ... 13
Table 13: Future stove purchase decision ... 14
Table 14: Method of stove acquisition per region ... 15
Table 15: Awareness of support to acquire Morrison stove ... 15
Table 16: Level of ease of Morrison stove per region ... 16
Table 17: Ease of use when loading trays ... 16
Table 18: Ease of use when unloading trays ... 17
Table 19: Perception of affordability of Morrison stove ... 17
Table 20: Profitability of fish products from Morrison ... 18
Table 21: Perception of price of fish products from Morrison ... 18
Table 22: Perception of sales of fish using Morrison ... 19
Table 23: Preference for fish using Morrison ... 19
Table 24: Difference in fish smoked using Morrison ... 20
Table 25: Difference in taste of fish using Morrison vs. previous technology ... 20
Table 26: The stove which is producing better tasting fish ... 20
Table 27: Color difference of smoked fish between Morrison vs. previous technology ... 21
Table 28: Occurrence of fish breakage using Morrison vs. previous technology ... 21
Table 29: Frequency of repeated smoking to preferred moisture content by stove type ... 22
Table 30: Comparison of current and previous stove size ... 22
Table 31: Development of defects in Morrison ... 23
Table 32: Ease to access repairs for maintenance after a defect ... 23
Table 33: Expectation of further improvement to Morrison stove ... 24
Table 34: Consideration of adoption of Morrison stove per region... 25
Table 35: Number of non-users (control group) sampled per region (N=48) ... 26
Table 36: Descriptive statistics for age of respondents (N=48) ... 26
Table 37: Since when did you hear of the Morrison stove ... 26
Table 38: Source of awareness of Morrison stove ... 27
Table 39: Number of traders sampled per region (N=38)... 27
Table 40: Descriptive statistics for age of respondent (N=38) ... 27
Table 41: Descriptive statistics for years trading smoked fish ... 28
Table 42: Stove preference by region ... 28
Table 43: Customers’ stove preference by region ... 28
Table 44: Benefits of using Morrison stove by region ... 29
EXECUTIVE SUMMARY
The Sustainable Fisheries Management Project (SFMP) recognizes the importance of value chain and post-harvest improvements within the fish processing sector in Ghana. This sector is dominated by women who process small pelagics and other species caught by artisanal fishermen. Fish smoking is the most widely used method of processing in Ghana. Nearly 80 percent of small pelagics, the primary species landed, is consumed in the smoked form. Inefficient fish smoking technology has prompted introduction of the Morrison stove, an Improved Fish Smoking Stove (IFSS).
Since its introduction, fish processors and fish traders have started using the Morrison stove. In order to evaluate their experience using the Morrison stove, which includes benefits and challenges of its use, an independent study was conducted among fish processors using the Morrison stove (N=105), those not, the control group (N=48) and traders, those who buy and sell fish smoked using a Morrison stove (N=38). The survey was conducted in four regions across Ghana, including Greater Accra, Central, Volta and Brong Ahafo. Findings from this study are summarized below:
To preface, this study differs from a previous Morrison stove beneficiary satisfaction survey conducted by the Netherlands Development Organization (SNV) in March, 2016. The survey conducted by SNV had limited representation (N=32) and was only conducted in one region, the Central region. Despite a smaller sample size and results from only one region, the findings from SNV’s survey mirror those in this report.
Prior to the Morrison stove, the majority of fish processors surveyed used Chorkor smokers. In all regions except for Greater Accra, the majority of respondents (71%) state they prefer the Morrison stove to others. In Volta and Brong Ahafo where the Morrison stove has been in use for a longer period of time, the preference rates are much higher (95 and 100 percent, respectively). In Greater Accra and Central region, approximately half prefer the Morrison stove to others. The reasons for their preference is less consumption of fuelwood, less smoke emission and better quality products, with specific mention to color, aroma and value. Future stove purchase decisions were also overwhelmingly in favor or the Morrison stove (66%). Methods of acquiring a Morrison stove vary by region and source. There is no one single financing mechanism being used, rather, a combination of means is seen. Awareness of financial support, however, does exist across all regions, albeit somewhat less known in Greater Accra. For example, in Greater Accra, some respondents could not remember the name of the NGO lending financial support.
The primary types of fish processed vary by region, size and market value. In Greater Accra and Volta, anchovies were identified as the primary type of fish being processed, whereas in the Central region, tuna and sardinella dominate. In Volta, mudfish along with other types of fish not included in the questionnaire are processed. Differences between the regions in size and weight of fish might explain why respondents encountered challenges with stove components, such as the mesh net size, depth of trays and interlocking feature of the Morrison stove’s trays. Respondents stated that different net sizes should accommodate different types of fish species. Specific challenges with the stove’s components are detailed in this report.
A large majority of respondents stated it was easy or very easy to load trays (74%), while others stated it was less or not easy at all to load trays (21%). Fifty-eight percent of survey respondents in the Central region stated it was not easy to construct, whereas respondents in Greater Accra, Volta and Brong Ahafo stated it was easy to construct (34, 31 and 50% respectively). Therefore, ease of use and construction of the Morrison stove warrants further inquiry to determine if or how it could impact the rate of adoption.
respondents in both Volta and Brong Ahafo perceive the Morrison stove to be affordable. The Morrison stove was heavily subsidized in these regions which may have contributed to this perception.
In regards to perceptions of profitability of fish products using Morrison stove, respondents in Greater Accra, Central and Volta confirmed no difference in profitability (69, 36 and 38% respectively). Thirty-three percent of respondents in the Central region stated that the
Morrison stove increased profits somewhat or greatly, and in Volta and Greater Accra 64 and 20 percent respectively stated the stove increased profits greatly or somewhat. Averaging across regions, forty-four percent of respondents said using the Morrison stove increases profitability somewhat or greatly, 46 percent stated no difference in profitability and less than 3 percent claimed the Morrison stove reduced profits. It is worthwhile to examine the
financial capacity of processors, to calculate profitability and understand market conditions which may impact profits independent of the type of stove used.
Respondents affirmatively state that there is a difference in the quality of fish smoked using Morrison versus the previous technology. However, there is no statistically significant difference regarding consumers’ preference for fish that has been processed using Morrison stove. To-date there is no significant difference in the perception of price or sales of fish products as a result of using Morrison stove technology. A potential explanation for the lack of difference in the perception of price could be attributed to the fact that fish smoked by Morrison was seen being mixed with fish smoked by other stoves without any deliberate attempt to distinguish between the two. Also, if a processor is not aware of positive product attributes or selling points, they may not be inclined to seek higher prices for fish smoked using a Morrison stove.
The response rate to specific questions about taste and color among survey respondents was low. Respondents in Greater Accra, Volta and Central region did not answer the question asking if there is a difference in taste of fish using Morrison versus previous smoking technology (74, 17, 38% respectively). However, when asked again which stove produced better tasting fish, among those who responded stated that Morrison produces better tasting fish over previous technology used (25 versus 2% on average across regions). With regards to the color of fish smoked by Morrison versus previous technology, fifty percent of
respondents across regions stated there is a color difference, which is considered to be a desirable product attribute. Nearly 10 percent of respondents across the regions claimed there was no difference in color, while 41 percent did not answer the question.
All regions confirmed very low or no breakage of fish while using the Morrison stove. The majority of the Morrison stoves and previous stoves used are double unit (75 and 50% respectively).
Fifty-nine of the 105 Morrison stove users stated the development of defects. Respondents were split over ease of access to repairs or maintenance after a defect developed. Other challenges reported included heaviness of trays, fewer trays, and inferior material. These challenges warrant further inquiry to determine how it might impact the rate of adoption, or could be corrected in subsequent scale up. Respondents in Greater Accra, Volta, Central and Brong Ahafo overwhelmingly stated they expect further improvement to Morrison stove technology (94, 55, 67 and 75% respectively).
adopters. The greatest majority of adopters are in Volta (88%) and Brong Ahafo (100%), whereas the greatest majority of non-adopters are in Greater Accra (69%). In the Central region, respondents are split almost evenly between adopters and non-adopters (52 and 48% respectively).
Non beneficiaries, referred to as the control group were separately surveyed. The control group consists of forty-eight processors in Greater Accra, Central, Volta and Brong Ahafo regions who have not been provided a Morrison stove by the projects. The purpose of
surveying non-beneficiaries is to understand the degree of awareness they have regarding the Morrison stove. Sixty-five percent of non-beneficiary fish processors stated they heard about the stove over one year ago. Their main source of awareness comes from other fish
processors (52%), followed by NGOs (25%). The media was not considered a source of awareness.
The majority of fish marketers, or traders state they prefer fish smoked by the Morrison stove versus other stoves (58%). When fish traders were asked about their customers’ preference between fish smoked by Morrison versus other technologies, forty-five percent state preference for Morrison fish products, whereas 5 percent state preference for Chorkor fish products. Among the reasons given for their preference is color, taste and aroma. However, when comparing traders to Morrison stove users, sixty-three percent of Morrison users state no difference between fish smoked by Morrison to other stoves and 22 percent state
preference for Morrison smoked fish is high. Here, the disconnect between traders’ and Morrison stove users’ preferences is worth further examination to determine if there is an unforeseen economic value or advantage in the marketplace for fish smoked by the Morrison stove.
INTRODUCTION
Report LayoutThis report is an independent evaluation of the Morrison stove commissioned by the Ministry of Fisheries and Aquaculture under direction of the Fisheries Commission Post-Harvest Unit with funding provided by the USAID/Ghana Sustainable Fisheries Management Project. This report offers a brief overview of the USAID/Ghana Sustainable Fisheries Management Project with emphasis on IR 4.5., tracking progress on activities on Value Chain and Post-Harvest Improvements. The methodology used to conduct this evaluation is also described, including a map of communities where survey respondents were sampled. Findings include demographic details and statistical analysis comparisons among stove adopters, control group (non-project beneficiaries) and traders across regions. Qualitative data, such as direct
observations and focus group discussions is also included. The report concludes with policy recommendations for the Morrison stove and other IFSSs.
SFMP Overview
The USAID/Ghana Sustainable Fisheries Management Project (SFMP) is a five-year project (October 2014 - October 2019) whose goal is to rebuild targeted marine fisheries stocks and catches through adoption of responsible fishing practices. As part of this effort, the project supports improvements in the value chain of smoked fish, important to tens of thousands of women fish processors and marketers. The SFMP project places emphasis on management of the small pelagic fishery due to the importance of these stocks to local and regional food security. Small pelagics represent a high nutritional value as a low cost food protein supply for millions of people. The SFMP focuses on improvements in the value chain of small pelagics in the Western and Central regions.
Background
Under SFMP, various trainings and activities, including research on IFSS technology has taken place. Trainings include educating stakeholders on fuelwood utilization, a major input in fish smoking, and sustainable exploitation levels of fuelwood species. A controlled cooking test conducted by the Food Research Institute (FRI) under the direction of the
Council for Scientific Research (CSIR) and SNV determined that the Morrison stove had fuel savings of 36.7% (below Energising Development requirements of 40% fuel savings). These results informed SNV’s scale-up efforts of IFSS in target areas, such as the Volta region where over 100 processors are using IFSS. To-date, approximately 50 Morrison stoves have been constructed by SFMP to serve as pilot demonstrations for fuel-efficiency. For nation-wide scaling, market-led strategies and business models were developed as a result of extensive surveys and focus group discussions among fish processors, traders and other private sector stakeholders.
Currently, research is being conducted to address polycyclic aromatic hydrocarbon (PAH) issues present in IFSS. A study found that fish smoked by a Morrison stove contained PAH level 2 depositions (potentially harmful to human health). In response, SNV recruited a team of stove experts (one international and three local experts) to address PAH concerns. This research is being carried out with the support of FRI and CSIR and the Fisheries
Commission.
PURPOSE OF THE INDEPENDENT EVALUATION
The purpose of the independent evaluation undertaken by the Monitoring and Evaluation Post-Harvest Unit at the Fisheries Commission, is to ground-truth, or validate previous assessments conducted by SNV Ghana regarding its performance and assess the level of satisfaction, awareness and knowledge among fish processors who have used the Morrison stove for more than six months prior to the start of the survey.
The objective of this report is to share results from data that was collected and analyzed based on various features and aspects of the Morrison stove from the perspective of adopters of Morrison stove technology. This report will also differentiate adopters from non-adopters. Fish processors who were not direct beneficiaries of the Morrison stove and are referred to the control group in this report. Additionally, traders or those who purchase smoked fish from fish processors were also surveyed in order to better understand or identify particular
attributes or special qualities of fish smoked using a Morrison stove. Together, the surveys specifically aim to:
Assess the knowledge base by users of the Morrison stove, and those not using it Assess ease of use of the Morrison stove compared to other fish smoking technology Determine fuel use efficiency of the Morrison stove
Describe product attributes and qualities of fish smoked by the Morrison stove, compared to others
Identify challenges and constraints faced by users of the Morrison stove
METHODOLOGICAL OVERVIEW
Survey DesignThe survey focused on posing questions to assess the performance of the Morrison stove and its socio-economic impacts on fish processors. Survey questions included the stove’s
performance and constraints regarding ease of use, capacity, quality and profitability. The use of quantitative and qualitative approaches was employed. Selected adopters were interviewed based on their experience using the Morrison stove. To qualify for selection in this study, adopters should have used the stove for more than 6 months. Information, such as awareness and willingness to adopt the Morrison stove was sought from current non-users, referred to as the control group in this report. Questions for traders focused on the quality of fish processed using Morrison stoves versus other stoves. Survey instruments used in the evaluation are located in Appendix.
Area of the Study
Figure 1. Regions and communities where the surveys were carried out
Sampling
The sample was drawn from a total population of 147 Morrison stoves constructed for 146 fish smokers. The total number of respondents surveyed in this evaluation is greater than the previous Morrison stove evaluation, conducted by SNV Ghana. The previous stove
evaluation conducted by SNV only surveyed Morrison stove beneficiaries in the Central region, which is currently supported by SFMP, and not beneficiaries from previous projects elsewhere. Table 1 highlights the types of groups sampled in the survey along with the sample size of each group.
Table 1: Types of groups sampled in the survey
Types of groups sampled Sample size
Beneficiaries of Morrison stove 105 Non-beneficiaries of Morrison stove 48
Sample Size Calculation
In selecting a sample size representative of this population was reached using an appropriate formula of
�� =�2∗ � ∗ 1 − �∁2
Where:
Z = Z value (1.96 selected for 95% confidence level)
p = percentage picking a choice, (.5 used for sample size needed) c = confidence interval
A confidence level of 95% (Z-value of 1.96) with a corresponding confidence interval (c) of 0.06 which resulted in a sample of 95 respondents. To accommodate non-responses, an additional 10% of adopters were further sampled leading to a total sample of 105 persons. In Central and Brong Ahafo, the sample were drawn from all communities whereas in Greater Accra and Volta regions samples of 4 and 5 communities were randomly selected from 7 and 13 respectively.
From a list of stoves users generated from SNV and SFMP project databases, then using random tables, the sample of persons to be interviewed was randomly drawn from this list. Fifteen percent of traders and those not using a Morrison stove, referred to as the control group in this study, were interviewed in each community to have an objective view on the performance of the stove and its popularity among fisher folks and to compare characteristics and reasons why others may not be using the stove. The assumption is that a non-user lives within 100 metres of the adopter and therefore will have more information on the
performance of the stove in order to make a decision whether or not to adopt the Morrison stove. To test this assumption, a sample was drawn from the selected communities. Traders were selected by asking beneficiaries, or users of the Morrison stove, to identify who they sold their product to. Qualitative data were acquired through focus group discussions made up of participants who were association executives from each community where the surveys took place.
The Survey Instrument
Three separate survey instruments were developed to collect information from corresponding respondents (see Appendix A). A paperless survey system was designed using Samsung Tablets. Kobotoolbox as the form-based application was used where completed survey instruments entered into the tablet were sent via cellular or Wi-Fi connections to a cloud database server. Data quality control and assurance was conducted by reviewing data stored in the cloud. Feedback was provided to the field team in-situ where initial concerns were identified with data entry or sample selection.
Survey Implementation
Enumerator Recruitment and Training
fisheries officer engaged a local hire to translate the meaning of some key words (including fish species) to ensure consistency in data collected.
Pre-testing the Questionnaire
The survey instrument was pretested in Dzita (a fishing community at Keta in the Volta Region). Based on feedback from this exercise, the questionnaire was revised to eliminate portions that directly attempted to calculate household income as well as a section that compared the fixed and variable cost of Morrison, Chorkor and other smoking technologies. The final survey instruments are contained in Appendix A.
Field Work
The field survey team was segregated into two sub-teams with one team conducting surveys in Greater Accra and the Central Region while the other worked in Brong Ahafo and Volta. Each team spent five days (including travel day) in each region Prior to collecting data, a fisheries officer and a local translator briefed the team on local names of fish species and other key words. The team split up in the communities to administer the questionnaires. The data collection ended in each community with a focus group discussion with executives of fish processors’ associations to brief them on the process of data collection and receive vital feedback on the perception and use of Morrison in their communities.
Figure 2: Cross-section of focus group participants
Survey Limitations
Although the survey met some challenges, these did not affect either the reliability or validity of analysis of selected variables. The number of respondents in this survey outweigh any likelihood of errors as a result of reliability or validity. Below are some challenges met.
1. Due to low financial literacy of the survey respondents, it was difficult for them to assess the difference in profitability between Morrison and other smokers.
3. In determining the frequency of repeated smoking attempts until preferred moisture level is achieved, it was noticed that moisture level of fish is dependent upon type of fish.
FINDINGS
This section provides a summary of results from the three types of groups surveyed, starting with beneficiaries of the Morrison stove.
Morrison Stove Beneficiaries
This section highlights findings from the sample of beneficiaries, or Morrison stove users. Table 2 showcases the number of beneficiaries sampled per region.
Table 2: Number of beneficiaries sampled per region (N=105)
Survey
Respondents Greater Accra Volta Central Region Brong Ahafo Total
Total 35 42 24 4 105
Individual Characteristics of Respondents
The mean age of the respondents interviewed was almost 47 years of age with a minimum of 24 years (only adults, age 18 years or over were interviewed) and a maximum of 75 years (Table 3).
Table 3: Descriptive statistics for age of respondents (N=105)
Mean Minimum Maximum Median SD
46.67 24 75 47 10.96
The distribution of age of the respondents across all regions is shown in Figure 3 below. There was no significant difference of age across regions (Chi-square =111.341, DF = 99, p-Value = 0.187).
Figure 3: Distribution of age of respondents
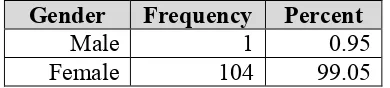
Table 4 shows the gender profile of survey respondents. As expected, the breakdown is predominantly female given the post-harvest fish processing sector is largely dominated by women in Ghana. Under SFMP, women are target beneficiaries of improved smoking technology.
Table 4: Gender of respondents (N=105)
Gender Frequency Percent
Male 1 0.95
Female 104 99.05
The majority of Morrison stove beneficiaries are married, followed by widowed and divorced. There were no significant differences in marital status by region (Chi-square =
15.213, DF = 15, p-Value = 0.436). Table 5 provides information about the number of
dependents by respondents. The mean is 7.33.
Table 5: Descriptive statistics for number of dependents (N=105)
Mean Minimum Maximum Median SD
7.33 1 30 6 4.64
The percent distribution of religion among the 105 respondents is shown in Table 6.
Christians made up the majority across all regions followed by Traditionalists (28.6%) in the Volta region. These differences are statistically significant.1
Table 6: Percent Distribution of Religion of respondents by Region
Religion Greater Region
Accra Volta Central Brong Ahafo Average All Regions
Christianity 97.14 69.05 87.50 100.00 83.81
Islam 0.00 0.00 4.17 0.00 0.95
Traditional 0.00 28.57 4.17 0.00 12.38
Other 2.86 2.38 4.17 0.00 2.86
Total 100.00 100.00 100.00 100.00 100.00
(Chi-square = 20.694, DF = 9, p-Value = 0.014, N= 105)
Forty-three percent of Morrison stove beneficiaries have not attended school. Of those who have attended school, the majority do not have more than a primary level education.. There is no statistically significant difference by region among education levels (Chi-square = 12.384,
DF = 18, p-Value = 0.827).
Information on processing activities
processing and trading. However, in the Volta and Greater Accra region the majority were involved in both fish processing and trading whereas in the Central and Brong Ahafo regions, there was much more specialization in fish processing only. These differences are statistically significant.
Table 7: Type of business activity (% of respondents) undertaken per region
Business type Greater Region
Accra Volta Central Brong Ahafo Average All Regions
No answer 0.00 0.00 8.33 0.00 1.91
Fish processing 37.14 35.71 62.50 100.00 44.76
Fish processing and
trading 62.86 64.27 29.17 0.00 53.33
Total 100.00 100.00 100.00 100.00 100.00
(Chi-square 18.687, DF = 6, p-Value = 0.005, N = 105)
Table 8 highlights the type of fish processing activity undertaken by survey respondents across regions. The majority of processors interviewed smoke fish and are engaged in other types of processing (54%) compared to 45 percent that only smoke fish. However, there is considerable differences between regions. Greater Accra has the highest percentage of survey respondents that engage in smoking and other types of processing, whereas the Central Region has the highest dependence on smoking only. The difference between regions is statistically significant.
Table 8: Type of fish processing
Type of fish processing Greater Region
Accra Volta Central Brong Ahafo Average All Regions
No answer 0.00 0.00 4.17 0.00 0.95
Only smoking 22.86 50.00 66.67 50.00 44.76
Smoking and other types of
processing 77.14 50.00 29.17 50.00 54.29
Total 100.00 100.00 100.00 100.00 100.00
(Chi-square = 16.295, DF = 6, p-Value = 0.012, N= 105)
Table 9: Most important type of fish processed per region
Types of fish processed
Region Greater
Accra Volta Central Brong Ahafo Average All Regions
No answer 0.00 0.00 4.17 0.00 0.95
Table 10 compares the types of fish processed with preference for the Morrison stove. Respondents linked greater preference for Morrison with species like sardinella, tuna and other types of fish and less preference for Morrison for anchovy. The difference is
statistically significant.
Table 10: Comparing types of fish processed with preference of Morrison stove
Type of fish
Preference for Morrison stove (percent of respondents)
The length of time survey respondents has used the Morrison stove varies across regions from one to more than two years. The difference is not significant (Chi-square = 11.735, DF = 9,
p-Value = 0.229).
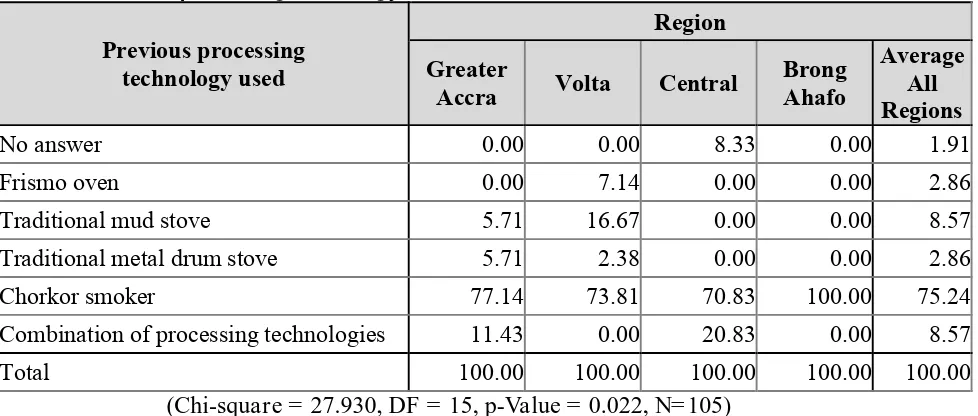
Table 11 shows the frequency distribution of processing technology previously used to the Morrison stove. There is a regionally statistically significant difference in the type of processing equipment previously used between Chorkor and other types of stoves.
Table 11: Previous processing technology used before the Morrison stove
Previous processing
Combination of processing technologies 11.43 0.00 20.83 0.00 8.57
Total 100.00 100.00 100.00 100.00 100.00
(Chi-square = 27.930, DF = 15, p-Value = 0.022, N= 105)
Table 12 shows preference of Morrison stove to others as stated by beneficiaries. Regionally, there is a statistically significant difference in favor of Morrison stove to others. It should be noted that in the regions where the Morrison smoker has been in use for a longer period (Brong Ahafo and Volta) the preference rates are much higher. Even in the Central and Greater Accra region, approximately half of the users prefer the Morrison smoker. Table 12: Preference of Morrison stove to others
Prefer
Figure 4 highlights reasons, provided by beneficiaries, in regards to why the Morrison stove is preferred over others. The primary reasons are less consumption of fuelwood and less smoke emission, which is consistent with SNV’s assessment2. Another noteworthy observation is that Morrison stove produces a better quality product. Further details are provided in later sections.
Figure 4: Reasons for preference of Morrison stove
Table 13 shows how beneficiaries respond to future stove purchasing decisions. The majority of survey respondents state that in the future, they would purchase a Morrison stove.
Regionally, the difference is statistically significant. The reasons given for purchasing this type of stove were less consumption of fuelwood, reduced processing time and production of a better-quality fish with specific mention to color, aroma and value.
Table 13: Future stove purchase decision
Future stove Purchase?
Region Greater
Accra Volta Central Brong Ahafo Average All Regions
No answer 2.86 0.00 12.50 0.00 3.81
Table 14 displays the method or ways which beneficiaries acquired the Morrison stove. In the Central region, beneficiaries acquired the Morrison stove through a subsidy from SFMP (33%) or by using a combination of methods (33%) including subsidies, bank loans, personal
70
Preference for Morrison stove over others
acquired solely through a subsidy from SNV, personal savings or other means. There is a statistically significant difference regionally.
Table 14: Method of stove acquisition per region
Method of acquisition Greater Region
Accra Volta Central Brong Ahafo Average All Regions
Table 15 indicates a degree of awareness among beneficiaries with regards to financial support to acquire the Morrison stove. Respondents in all regions confirmed affirmatively that they are aware of support to acquire the Morrison stove. The difference is statistically significant.
Table 15: Awareness of support to acquire Morrison stove
Awareness of
Seventy-eight percent of beneficiaries stated the Morrison stove was easy to use, while nineteen percent stated it was not easy to use (3 % did not answer the question). The differences are not statistically significant across regions (Chi-square = 8.601, DF = 6,
p-Value = 0.197). When survey respondents were asked to rank how easy it is to use the
Table 16: Level of ease of Morrison stove per region
How easy to use?
Region Greater
Accra Volta Central Brong Ahafo Average All Regions
No answer 2.86 0.00 16.67 0.00 4.76
Very easy 22.86 66.67 8.33 50.00 38.10
Easy 54.27 28.57 33.33 25.00 38.10
Less easy 2.86 4.76 20.83 25.00 8.57
Not easy 17.14 0.00 20.83 0.00 10.48
Total 100.00 100.00 100.00 100.00 100.00
(Chi-square = 46.469, DF = 12, p-Value < 0.001, N= 105)
Table 17 shows ease of loading trays on the Morrison stove with a large majority saying easy or very easy (74%). The differences are statistically significant regionally. Survey
respondents in Volta stated it was very easy (69%) to load trays while in the Central region and Greater Accra some respondents commented it was not easy to load trays (21 and 23% respectively).
Table 17: Ease of use when loading trays
Easy to load trays?
Region Greater
Accra Volta Central Brong Ahafo Average All Regions
No answer 2.86 0.00 16.67 0.00 4.76
Very easy 14.29 69.05 25.00 50.00 40.00
Easy 57.14 21.43 25.00 25.00 34.29
Less easy 2.86 7.14 12.50 25.00 7.62
Not easy 22.86 2.38 20.83 0.00 13.33
Total 100.00 100.00 100.00 100.00 100.00
(Chi-square = 44.854, DF = 12, p-Value < 0.001, N= 105)
Table 18: Ease of use when unloading trays
With regards to ease of construction of Morrison stove, survey respondents in the Central region stated it was not easy to construct (58%) while beneficiaries in Greater Accra, Volta and Brong Ahafo stated it was easy to construct (34, 31 and 50% respectively). The
difference is not statistically significant (Chi-square = 8.443, DF = 9, p-Value = 0.490).
Table 19 shows the perception of affordability of the Morrison stove per region. Survey respondents in Greater Accra and the Central region do not perceive the Morrison stove to be affordable (69 and 58% respectively), while beneficiaries in Volta and Brong Ahafo perceive Morrison as affordable (50%). There are statistically significant differences by region. Where the stoves have been in use for longer periods (Volta and Brong Ahafo regions), the
perception is they are more affordable. It should be noted that the initial cost for construction of the Morrison stove is more expensive than other stove types, but due to reduced fuel wood consumption, the overall returns on investment are higher in the long term. However, a higher cost stove may be a barrier for processors who may not be able to afford the higher up-front costs to purchase a Morrison smoker.
Table 19: Perception of affordability of Morrison stove
Affordable? Greater Region
Accra Volta Central Brong Ahafo All Regions Average
perceive a profitability advantage even though most acknowledge reduced fuel wood consumption. This disconnect has implications for extension programs which need to do a better job at convincing and demonstrating to processers the improved profitability of these stoves.
Table 20: Profitability of fish products from Morrison
Profitability of
Table 21 shows the frequency distribution of price perceptions using Morrison stove. More respondents stated seeing higher process than those responding to seeing lower prices, however, the majority perceived no difference in price perceptions of fish products using the Morrison stove. The difference is statistically significant. This question warrants further inquiry as to market conditions or other factors which can affect price perceptions.
Table 21: Perception of price of fish products from Morrison
Price perceptions
respondents in Volta stated they are able to sell fish more quickly (38%), whereas other respondents in Greater Accra, Volta and the Central region stated no difference (80, 60 and 38% respectively). The difference is statistically significant. Here again, market conditions should also be considered as influencing perception of sales in addition to the technology used.
Table 22: Perception of sales of fish using Morrison
Sales of fish using
Table 23 shows the frequency distribution for a processor’s preference for fish that has been processed using a Morrison stove, versus past stoves. While most said there is no difference (63%) whereas 22 % said preference for the Morrison smoked fish is high. Very few said preference is low (4%). In Greater Accra, Volta and the Central region, survey respondents stated no difference (80, 67 and 42% respectively). The difference is statistically significant.
Table 23: Preference for fish using Morrison
Preference for fish
Preference for fish from Morrison
is high 2.86 30.95 20.83 100.00 21.91
No difference 80.00 66.67 41.67 0.00 62.86
Preference for fish from Morrison
is low 5.71 0.00 8.33 0.00 3.81
Total 100.00 100.00 100.00 100.00 100.00
(Chi-square = 37.926, DF = 9, p-Value < 0.001, N= 105)
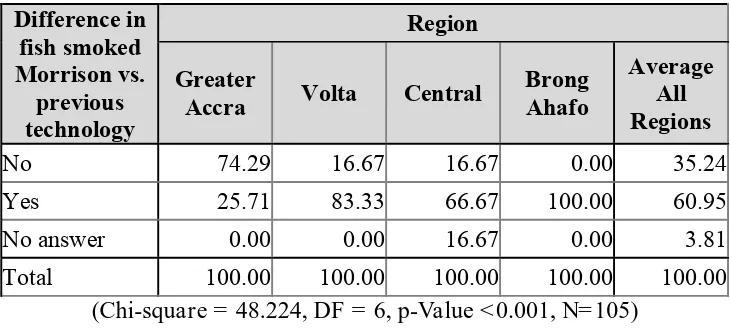
In the following tables, survey respondents comment on quality and quantity of processed fish produced using Morrison stove technology. Survey respondents were asked a general question of whether there is a difference noted in fish smoked using a Morrison stove versus fish smoked by previous smoking technology. Table 24 reveals that the majority of
Table 24: Difference in fish smoked using Morrison
Table 25 shows differences in taste of fish processed using the Morrison stove versus
previous smoking technology by region. Twenty-seven percent of respondents state there is a difference in taste, while 33 percent state no difference in taste. A number of beneficiaries in Greater Accra and the Central region chose not to answer the question (74 and 38%
respectively). The difference was statistically significant.
Table 25: Difference in taste of fish using Morrison vs. previous technology
Difference
Table 26 shows the frequency distribution of respondents stating which stove produces better tasting smoked fish. More respondents said the Morrison had better taste than previous technology (24% versus 2%). The difference is statistically significant. Many beneficiaries across all regions did not choose to answer the question, perhaps indicating that most do not perceive any taste difference.
Table 26: The stove which is producing better tasting fish
Table 27 shows difference in color of smoked fish between Morrison stove and previous smoking technology, as observed by survey respondents. Fifty percent of respondents stated there is a difference in color, while 9 percent did not perceive a difference in color. In Volta, seventy-one percent observe a color difference, while only 3 percent observe a difference in color in Greater Accra. Here again, some beneficiaries did not answer the question. The regional difference is statistically significant.
Table 27: Color difference of smoked fish between Morrison vs. previous technology
Difference in
Table 28 shows the frequency distribution of fish breaking up while smoking using Morrison versus previous technology. The majority of survey respondents in all regions do not report fish breakages using Morrison stove technology (100, 100, 63 and 50% respectively). In Brong Ahafo, reported breakage of fish was evenly split. The difference is statistically significant.
Table 28: Occurrence of fish breakage using Morrison vs. previous technology
Breakage
Table 29 highlights differences of frequency of repeated smoking to preferred moisture content between the Morrison stove and previous fish smoking technology. With the
Table 29: Frequency of repeated smoking to preferred moisture content by stove type
Frequency of repeated smoking to preferred moisture content
Stove Type
Morrison Previous technology
No answer 18.18 18.00
1 more time 30.30 22.00
2 more times 20.20 25.00
3 more times 10.10 16.00
4 or more times 3.03 5.00
None 15.15 11.00
No difference in frequency 3.03 3.00
Total 100.00 100.00
(Chi-square = 202.52, DF = 36, p-Value = < 0.001. N = 96)
Table 30 reveals differences in size of stove currently and previously used by survey respondents. Double unit stoves are used more than single unit stoves, both in current and previous fish smoking stove. Currently, a majority of respondents use a double unit stove over a single unit stove (75 and 14% respectively). The difference is statistically significant.
Table 30: Comparison of current and previous stove size
Size of stove
Current vs. Previous Stove
Current Previous
No answer 9.62 6.67
Single unit 14.42 41.91
Double unit 75.00 50.48
Triple unit 0.96 0.95
Total 100.00 100.00
(Chi-square = 73.94, DF = 9, p-Value < 0.001, N = 104)
Table 31 shows the frequency distribution of defects which have developed since using the Morrison stove according to survey respondents. In Greater Accra and the Central region, beneficiaries have confirmed the development of defects since its usage (77 and 67%
Table 31: Development of defects in Morrison
Development of a defect?
Region Greater
Accra Volta Central Brong Ahafo Average All Regions
No 22.86 61.91 25.00 75.00 40.95
Yes 77.14 35.71 66.67 25.00 56.19
No answer 0.00 2.38 8.33 0.00 2.86
Total 100.00 100.00 100.00 100.00 100.00
(Chi-square = 20.621, DF = 6, p-Value = 0.002, N= 105)
Survey respondents who confirmed development of a defect since using the Morrison stove (N=59), were asked if it was easy to access repairs for maintenance after development of a defect. Table 32 shows the frequency distribution of responses to that question. Forty-seven percent of respondents stated that it is not easy to access repairs, while 44 percent state it is easy to access repairs. In Volta region, eight percent stated it was easy, whereas in the Central region and Greater Accra respondents stated it was not easy (56 and 63% respectively). Focus group discussions in the Central region revealed poor communication of maintenance issues, which caused problems with request for repairs. The difference is statistically significant.
Table 32: Ease to access repairs for maintenance after a defect
Easy to access repairs
after defect?
Region Greater
Accra Volta Central Brong Ahafo Average All Regions
No 62.96 13.33 56.25 0.00 47.46
Yes 33.33 80.00 25.00 100.00 44.07
No response 3.70 6.67 18.75 0.00 8.48
Total 100.00 100.00 100.00 100.00 100.00
(Chi-square = 15.776, DF = 6, p-Value = 0.015, N= 59)
Figure 5: Challenges using Morrison stove
Table 33 shows the frequency distribution for expectation of further improvement to
Morrison stove. Survey respondents across all regions stated they expect further improvement to Morrison stove technology. The difference is statistically significant.
Table 33: Expectation of further improvement to Morrison stove
Expect
Table 34 shows the frequency distribution of beneficiaries who are regarded as adopters and non-adopters of Morrison smoking technology. The non-adopters were determined by analyzing responses to particular questions such as frequency of use (of Morrison), future purchase decisions (regarding Morrison) and preference for Morrison stove. There is a significant difference by region with regard to adopters versus non-adopters.
The greatest majority of non-adopters work in Greater Accra (69%). In the Central region, beneficiaries are somewhat split between adopters and non-adopters (52 and 48%
Table 34: Consideration of adoption of Morrison stove per region
Accra Volta Central Brong Ahafo Average All Regions
Adopter 31.43 88.10 52.17 100.00 61.54
Non-adopter 68.57 11.91 47.83 0.00 38.46
Total 100.00 100.00 100.00 100.00 100.00
(Chi-square = 29.273, DF = 3, p-Value< 0.001, N= 1043)
Figure 6 shows the different types of non-adopters (N=40). The first type of non-adopter is a beneficiary who stated that they have not used the Morrison stove in more than six months, does not prefer it over others and would not purchase a Morrison stove in the future. In this study, this type of non-adopter is referred to as an absolute non-adopter. The next type of non-adopter is referred to as a recidivist, or someone who has received the stove but hasn’t used it for more than six months to a year. The last type of non-adopter is a beneficiary who has used the stove within the last six months and but states that they would not purchase a Morrison in the future and that they do not prefer it over other stoves. In this study, this type of non-adopter is considered unconvinced. The three types are non-adopters are depicted in Figure 6 below.
Figure 6: Types of non-adopters
Control Group (Non-beneficiaries)
This section highlights findings from the control group of the Morrison stove evaluation where 48 persons were interviewed (N=48). This category is also referred to as the non-users of Morrison stove. Table 35 showcases the number of survey respondents, or
non-beneficiaries, sampled per region.
3 N=104 (instead of 105) because one person did not answer any of the three questions selected as criteria for
being an adopter vs. non-adopter.
Table 35: Number of non-users (control group) sampled per region (N=48)
Survey Respondents
Region
Greater Accra Volta Central Brong Ahafo Total
Total 15 17 13 3 48
Table 36 shows the mean age of the respondents interviewed which was 44 years of age with a minimum age 22 years and maximum age 78 years. There is no significance of age across regions (Chi-square = 93.285, DF = 78, p-Value = 0.114).
Table 36: Descriptive statistics for age of respondents (N=48)
Mean Minimum Maximum Median SD
44.08 22 78 43.50 14.12
With regards to processing technology, the non-beneficiaries, or control group most commonly used the Chorkor stove across all regions. The difference is not significant
(Chi-square = .17.694, DF = 21, p-Value = 0.668). Awareness of Morrison stove technology
among non-users exists, but is not significant across all regions (Chi-square = 2.247, DF = 3, p-Value = 0.523).
Table 37 shows the frequency distribution of when non-users first heard about Morrison stove technology. In all regions, most non-users heard about the Morrison stove about one year ago (40, 54, 100 and 33% respectively). The difference is statistically significant.
Table 37: Since when did you hear of the Morrison stove
When did you hear of
Table 38: Source of awareness of Morrison stove
Regarding whether or not a survey respondent, or non-user of Morrison stove would adopt Morrison stove technology, 29 survey respondents in Greater Accra, Central Volta and Brong Ahafo confirmed they would adopt Morrison (53, 54, 65 and 100% respectively), whereas 19 survey respondents stated they would not adopt Morrison (47, 46 and 35% respectively). The difference is not significant (Chi-square = 2.646, DF = 3, p-Value = 0.450).
The majority of survey respondents who stated they would not consider adopting Morrison technology did not provide a reason. Others simply stated they were not interested or provided high cost and inadequate knowledge of usage as a reason not to consider adopting Morrison stove. The difference between regions is not significant (Chi-square = 20.912, DF = 27, p-Value = 0.790).
Traders
This section highlights findings from the traders, or those who purchase smoked fish from fish processors. Thirty-eight traders were interviewed (N=38). Table 39 showcases the number of survey respondents, or traders, sampled per region.
Table 39: Number of traders sampled per region (N=38)
Survey Respondents
Region
Greater Accra Volta Central Brong Ahafo Total
Total 12 14 12 0 38
Table 40 shows the mean age of the respondents interviewed which was 44 years of age with a minimum age 24 years and maximum age 70 years. All the survey respondents were female.
Table 40: Descriptive statistics for age of respondent (N=38)
Mean Median Minimum Maximum SD
43.61 42.00 24.00 70.00 12.09
The primary occupation of survey respondents in the Central and Volta regions is smoked fish trading (50 and 64%), whereas in Greater Accra, respondents stated they were processors and traders (75%). The difference is not significant (Chi-square = 47.877, DF = 44, p-Value = 0.318).
Table 41: Descriptive statistics for years trading smoked fish
Mean Median Minimum Maximum SD
18.53 16.50 2.00 54.00 12.57
Traders in Greater Accra, Central and Volta stated they are aware of the various types of stove processing technology being used (92, 92 and 100% respectively). The difference is not significant. In Greater Accra, Central and Volta, traders stated they purchase smoked fish from processors using Morrison stove (67, 83 and 93% respectively). The difference is not significant (Chi-square = 1.231, DF = 2, p-Value = 0.540).
Table 42 shows survey respondents stating their own preference between Morrison’s fish products and fish smoked using other stove technologies. The majority of the survey respondents state preference for Morrison’s fish products over others (58 versus 26 percent respectively). The highest percentages are in Central and Volta region, where traders state their preference for Morrison’s fish products (50 and 93% respectively). The difference is statistically significant.
Table 42: Stove preference by region
Stove preference Region
Greater Accra Volta Central Average All Regions
No answer 41.67 0.00 8.33 15.79
Morrison's fish products 25.00 92.86 50.00 57.90
Others 33.33 7.14 41.67 26.32
Total 100.00 100.00 100.00 100.00
(Chi-square = 16.305, DF = 4, P-Value = 0.003, N = 38)
Table 43 shows survey respondents, or traders, stating their customers’ preference between fish smoked by Morrison stove and other technologies. There is substantially higher
preference for Morrison over Chorkor stove (45 and 5 percent respectively). In Central and Volta region, stated preferences are Morrison stove (50 and 64% respectively). A substantial number of respondents, however, also stated no preference. The regional difference is statistically significant.
Table 43: Customers’ stove preference by region
Stove preference Region
Greater Accra Volta Central Average All Regions
No preference 83.33 35.71 16.67 44.74
Chorkor 0.00 0.00 16.67 5.26
Morrison 16.67 64.29 50.00 44.74
No answer 0.00 0.00 16.67 5.26
Total 100.00 100.00 100.00 100.00
Figure 7: Reasons for stove preference
Focus group discussions
Qualitative methods, including focus group discussions and participant observations were used to enhance and validate results from the quantitative analysis. Focus group discussions were conducted by the Fisheries Commission and SFMP in Greater Accra, Volta and Central region from May-June, 2016. Table 44 captures some of the benefits of using the Morrison stove by region.
Table 44: Benefits of using Morrison stove by region
Benefits Greater Accra Region Central Volta
Produces better quality fish (uniform glossy color, better taste as a result of less smoke residue in flesh, drier)
Safer (fewer accidental burns to
Most of the benefits were attributed to better quality of smoked fish, fuel efficiency and less smoke emission from the Morrison stove. In the Volta region, participants stated increased demand for fish smoking using a Morrison stove, yet they were unsure if a price premium exists.
While participants in all regions cited demonstration trainings as a benefit, respondents in the Central and Volta region argued that more sensitization is needed to understand the benefits of using the Morrison stove, including its maintenance. In Volta, the use of local artisans for construction was considered a benefit.
Figure 8: Focus group discussion in session in the Central region
Table 45 below captures some of the challenges of using the Morrison stove by region. Table 45: Challenges of using Morrison stove by region
Challenges Region
Greater Accra Central Volta
Pricing (high cost and inconsistent between
communities) X X X
Number of trays (too few) X X
Quality of trays (durability of wood, handles, inconsistent depth
of trays) X X
Mesh size and material (size needs to accommodate different types of fish, better mesh material needed)
X X
Interlocking trays (makes
loading/unloading more difficult,
traps smoke) X
Clay stove (cracks more easily than cement, attracts termites, must be cleaned more frequently, deteriorates faster from rain)
X X X
Challenges were mainly related to the stove’s design, its delivery and the development of defects. With regards to design, participants stated the mesh size did not accommodate the various types, or sizes, of fish processed across regions. Almost all users were using the chimney, some stated it was due to lack of space in or around the house. The material used to construct the stove, clay, deteriorates from rain and most users do have their own sheds or sufficient roof to protect it from deterioration.
Figure 9: Damaged Morrison tray mesh, replaced with Chorkor tray mesh
The timing of the delivery of the Morrison stove did not coincide with the bumper season in Greater Accra, therefore users could not speak adequately about its performance based on low volumes of fish for processing. In the Central region and Greater Accra, respondents stated that there was a long waiting period from the time of payment, until its delivery, which was often incomplete (in particular, trays).
Most of the defects are related to its design. More clay is required to protect it from
deterioration, caused by rain and termites. In the Volta region, respondents stated the type of clay used is not native to the region and must be brought it at a higher cost. In the Central region, respondents stated high abandonment due to the development of defects and lack of knowledge on maintenance and repairs. Many of these challenges are consistent with findings in the quantitative analysis.
This report concludes with a discussion and policy recommendations based on results from this study and previous studies.
DISCUSSION
Eighty-eight of 105 survey respondents have been using the Morrison stove for a minimum of 6 months, a criteria used to participate in this study. While some processors in Greater Accra stated they had not gone through an entire fish processing cycle (including the bumper season), nearly all respondents were able to answer specific questions about the stove – a limitation noted in previous reports, such as SNV’s Beneficiary Satisfaction Report. This criteria and response rate adds credibility to the results discussed in this section.
Questions about profitability, sales or price premiums of fish smoked by the Morrison stove versus other stoves was difficult to obtain. In this study, survey respondents did not perceive a price difference (higher), increased sales or profitability as a result of using the Morrison stove. Possible reasons as to why it is difficult to obtain this sort of information could be that most fish processors have not exceeded primary school and may lack financial literacy to calculate profit margins, independent of the type of stove used. Also, data collectors observed fish smoked using the Morrison stove was being mixed with fish smoked by other stoves without any deliberate attempt to distinguish between the two. Processors should start by differentiating better quality fish smoked by the Morrison stove versus others in sales made to traders, the majority of whom also prefer Morrison smoked fish to Chokor smoked fish. This would help determine if a price premium exists. Regardless of whether a price premium exists, the cost savings and other advantages make the Morrison design clearly a superior smoking technology that should be promoted further among the fish processing industry. The majority of survey respondents in the Central Region (58%) and Greater Accra (69%) region did not perceive the Morrison stove to be affordable, while respondents in Volta (50%) and Brong Ahafo (50%) did perceive the stove to be affordable. Differences in
perceptions of affordability could be attributed to many factors, including subsidies available and utilized by processors in different regions.
This survey asked respondents to state the type of financing mechanisms used to acquire the Morrison stove. In the Volta region, the majority of the stoves were acquired using a subsidy from SNV (81%). Thirty-three percent of respondents in the Central region stated using a subsidy from SFMP to acquire the Morrison stove, along with other means, such as a subsidy from SNV (4%), and a bank loan or group purchase (4 and 8% respectively). In the Greater Accra region, processors relied on the following financial means to acquire a Morrison stove, personal savings (20%), a subsidy from SFMP (14%), a subsidy from SNV (14%), other (17%) or a combination of various means (29%). In the Greater Accra region, some
respondents stated they could not remember the name of the NGO lending financial support, which might explain a lesser reliance on subsidies in order to acquire the Morrison stove than in other regions, such as Brong Ahafo and the Volta region. In the Brong Ahafo region, respondents stated they relied on a subsidy from SNV (75%) and other (25%) means to acquire the Morrison stove. The Volta and Brong Ahafo region relied more on subsidies to acquire the Morrison stove than other regions did. Longer use of the stove and greater reliance on subsidies may impact the acceptance rate of the Morrison stove in these regions. Generally, awareness of support is high in all regions except for the Greater Accra Region where some respondents stated they could not remember the name of the NGO lending support. Based on these findings, availability and awareness of financing mechanisms clearly influence perceptions and possibly the rate of adoption. The affordability issues in Greater Accra and Central regions may be a draw-back for further and more rapid adoption of the technology in these regions. Since adoption in the Volta and Brong Ahafo regions was heavily subsidized, questions remain as to whether scale-up will occur on its own if no further subsidy is provided to new users.
The primary types of fish processed vary by region, size and market value. Respondents linked greater preference for Morrison with species like sardinella and tuna, found in the Central region and Greater Accra and less so for anchovy. Differences in size and types of fish might explain why respondents encountered challenges with the stove’s design, in particular with trays and mesh size. The depth of trays was inconsistent according to
components, such as mesh size and depth of trays should account for and accommodate the various types of fish being processed and sold. Inconsistencies and a one-size-fits all model may negatively impact adoption. Focus group discussions in the Central region revealed that processors are modifying the stove to suit their needs. Given this, the stove manufacturer should consider tailoring components to suit the needs of particular regions and sell them independently of the stove, or à la carte.
Fifty-nine of the 105 Morrison stove users stated the development of defects, primarily from respondents in the Greater Accra region and the Central region. Respondents were split over ease of access to repairs or maintenance after a defect developed. In the Volta region, for example, respondents stated that the cost of clay to repair the stove is high because it is not native to the region. In the Greater Accra region, respondents reacted to problems with clay by coating the stove with cement. This is another example of how users are adapting the stove to suit their needs. However, despite issues related to design or construction,
expectations of future improvements are high, especially in the Greater Accra region (94%). This is encouraging and should be considered as motivation to continue improving on this technology.
Within the control group and among traders, awareness of Morrison stove technology is high. The primary source of information comes from other processors, followed by NGOs. The media has not been considered a source of information. Communication between processors is more cost-effective and perhaps even more convincing than NGOs or the media. Utilizing these communication networks to convey information should be leveraged to facilitate adoption of the Morrison stove.
RECOMMENDATIONS
This section provides recommendations for further outreach and extension activities on improved fish smoker stoves based on findings from this survey, conducted by the Fisheries Commission and a previous survey, conducted by SNV. Outreach activities and next steps are also provided.
Highlight the stoves’ positive attributes among post-harvest fish smoking
stakeholders. Attributes of the Morrison stove include less consumption of fuelwood, less smoke emission or nuisance and better quality products. On a regulatory level, these attributes should be taken into account when developing higher quality, health and environmental standards for smoked fish in Ghana. On a marketing level, these attributes should be quantified to determine additional earning potential either through reduction of fuel wood costs or price premiums for better quality smoked fish. At this time, it is clear these positive attributes are not fully realized, or leveraged by
processors and traders. A controlled experiment to determine changes in profitability using the Morrison stove could be a next step. However, immediate outreach activities should focus on increasing awareness of the stove’s positive attributes. Awareness among processors can be communicated through messaging on murals or through mobile telephones, and through the use of demonstration stoves placed in large scale fish processing sites. Awareness should also be created among all supply chain actors, including traders, transporters and end-user markets.