SUSTAINABLE FISHERIES
MANAGEMENT PROJECT (SFMP)
Results Of Field Survey For The
i
This publication is available electronically on the Coastal Resources Center’s website at
http://www.crc.uri.edu/projects_page/ghanasfmp/
For more information on the Ghana Sustainable Fisheries Management Project, contact:
USAID/Ghana Sustainable Fisheries Management Project Coastal Resources Center
Graduate School of Oceanography University of Rhode Island
220 South Ferry Rd.
Narragansett, RI 02882 USA
Tel: 401-874-6224 Fax: 401-874-6920 Email: [email protected]
Citation: Asare, C., Nortey, D.D.N., Lazar N, Kankam, S. and Agbogah, K. (2015).
Results offield survey for the small pelagic fisheries profile. The USAID/Ghana Sustainable Fisheries Management Project (SFMP), Narragansett, RI: Coastal Resources Center, Graduate School of Oceanography, University of Rhode Island and Hen Mpoano, Windy Ridge – Takoradi. GH2014_ACT020_HM 52 pp.
Authority/Disclaimer:
Prepared for USAID/Ghana under Cooperative Agreement (AID-641-A-15-00001) awarded on October 22, 2014 to the University of Rhode Island and entitled; the USAID/Ghana Sustainable Fisheries Management Project (SFMP).
This document is made possible by the support of the American People through the United States Agency for International Development (USAID). The views expressed and opinions contained in this report are those of the SFMP team and are not intended as statements of policy of either USAID or the cooperating organizations. As such, the contents of this report are the sole responsibility of the SFMP Project team and do not necessarily reflect the views of USAID or the United States Government.
Cover photo: Small pelagic fish: top-right: anchovy; top-left: Chub Mackerel; bottom-left:
Detailed Partner Contact Information:
USAID/Ghana Sustainable Fisheries Management Project (SFMP) 10 Obodai St., Mempeasem, East Legon, Accra, Ghana
Brian Crawford Chief of Party [email protected]
Najih Lazar Senior Fisheries Advisor [email protected] Patricia Mensah Communications Officer [email protected] Bakari Nyari Monitoring and Evaluation Specialist [email protected]
Don Robadue, Jr. Program Manager, CRC [email protected]
Justice Odoi USAID Administrative Officer Representative [email protected] Kofi.Agbogah
SNV Netherlands Development Oganization #161, 10 Maseru Road,
E. Legon, Accra, Ghana 233 30 701 2440 Donkris Mevuta Kyei Yamoah [email protected] Friends of the Nation Parks and Gardens Adiembra-Sekondi, Ghana 233 312 046 180
Peter Owusu Donkor Spatial Solutions
[email protected] #3 Third Nautical Close,
Nungua, Accra, Ghana 233 020 463 4488
Thomas Buck
[email protected] SSG Advisors
182 Main Street
Burlington, VT 05401 (802) 735-1162
Victoria C. Koomson [email protected] CEWEFIA
B342 Bronyibima Estate Elmina, Ghana
233 024 427 8377 Lydia Sasu
Darkuman Junction, Kaneshie Odokor Highway
Accra, Ghana 233 302 315894 Gifty Asmah
[email protected] Daasgift Quality Foundation
Headmaster residence, Sekondi College Sekondi, Western Region, Ghana 233 243 326 178
For additional information on partner activities:
CRC/URI: http://www.crc.uri.edu CEWEFIA: http://cewefia.weebly.com/
DAA: http://womenthrive.org/development-action-association-daa Daasgift:
https://www.facebook.com/pages/Daasgift-Quality-Foundation-FNGO/135372649846101 Friends of the Nation: http://www.fonghana.org Hen Mpoano: http://www.henmpoano.org
SNV: http://www.snvworld.org/en/countries/ghana SSG Advisors: http://ssg-advisors.com/
iii
ACRONYMS
FC Fisheries Commission
HM Hen Mpoano
SFMP Sustainable Fisheries Management Project
TABLE OF CONTENTS
ACRONYMS ... iii
INTRODUCTION ... 1
SAMPLING STRATEGY ... 1
DEFINITION OF TERMS ... 2
Overview map ... 3
RESULTS ... 3
AGE DISTRIBUTION ... 3
National ... 3
Volta Region: ... 4
Greater Accra Region: ... 4
Central Region ... 5
Western Region ... 5
EDUCATION LEVEL... 6
National ... 6
Volta Region ... 7
Central Region ... 8
Western Region ... 9
MIGRATION PATTERN ... 10
National ... 10
Volta Region ... 11
Greater Accra Region ... 11
Central Region ... 12
Western Region ... 12
NUMBER OF DEPENDENTS... 13
National ... 13
Volta Region ... 14
Greater Accra Region ... 15
Central Region ... 16
Western Region ... 17
YEARS IN FISHING ... 18
National ... 18
Volta region ... 19
Greater Accra Region ... 19
Central Region ... 20
Western Region ... 20
SIZE OF CANOE ... 21
National ... 21
Volta Region ... 22
Greater Accra Region ... 22
Central region... 22
Western Region ... 23
TYPE OF GEARS ... 24
National ... 24
Volta region ... 25
Greater Accra Region ... 26
Central Region ... 26
Western Region ... 26
NUMBER OF FISHERMEN AND CANOES ... 27
v
Greater Accra Region ... 28
Central Region ... 28
Western Region ... 29
TYPES SMOKING UNITS ... 30
National ... 30
Volta Region ... 30
Greater Accra Region ... 31
Central Region ... 31
Western Region ... 32
HISTORICAL PERSPECTIVE OF FISHERIES ... 32
National ... 33
Volta Region ... 33
Greater Accra Region ... 34
Central Region ... 34
Western Region ... 34
CONCLUDING NOTES ... 35
Annex ... 36
Maps ... 36
Survey Questionnaires ... 38
LIST OF TABLES
Table 1: Number of purse seine and beach seine canoes and sample size ...1Table 2: Number of processors and sample size ...2
Table 3: Number of landing sites sampled per region ...2
LIST OF FIGURES
Figure 1: Overview map of selected communities for the small pelagic fisheries profile ..3Figure 2: Age distribution of fishermen surveyed from all selected communities in the four coastal regions ...4
Figure 3: Age distribution of fishermen surveyed in the Volta Region ...4
Figure 4: Age distribution of fishermen surveyed in selected communities in Greater Accra Region ...5
Figure 5: Age distribution of fishermen surveyed in selected communities in Central Region ...5
Figure 6: Age distribution of fishermen surveyed in selected communities in Western Region ...6
Figure 7: Education level of fishermen surveyed from all selected communities in the four coastal regions ...7
Figure 8: Education level of fishermen surveyed from the Volta RegionGreater Accra Region ...7
Figure 9: Education level of fishermen surveyed from selected communities in Greater Accra Region ...8
Figure 10: Education of fishermen surveyed from selected communities in Central Region ...9
Figure 11: Education level of fishermen surveyed from selected communities in Western Region ...10
vii
INTRODUCTION
This report summarizes the preliminary results of a field survey of fishermen and women in order to provide inputs for a small pelagic fisheries profile to be prepared under the USAID-funded Sustainable Fisheries Management Project (SFMP) in Ghana.
The activity was initiated in May 2015 to September of 2015 in 12 target communities across 64 landing sites (see overview map on page 3 for list of communities and landing sites). These communities are representative of the wide geographical spread of the project as well as record high landings of small pelagic fish as captured by Fisheries Commission (FC) in 2013 canoe frame survey.
The survey aimed at providing inputs to the under listed objectives of the small pelagic fisheries profile:
To guide fishery management strategies, potential fisheries capacity control and reduction plans, economic development initiatives (post-harvest), infrastructure investments and community and marine fisheries spatial planning.
Support FC with updated information on both fishermen and fish processors.
SAMPLING STRATEGY
The sampling strategy was based on the countrywide catch data and the 2013 canoe frame survey from the FC. These were used to select communities with high small pelagic landings across the four coastal regions; Volta Region was considered as a single ‘community’ for the purpose of the profile due to the predominance of beach seine fishery in this region. Canoes and fish processors in the selected communities were enumerated and the outcome of the enumeration was used to develop sample size proportional to both the canoe harvesting the small pelagic fish and number of fish processors in each of the selected communities using the “Probability Proportional to Landings” approach. The sample size was weighted by landings of 2012 for each region.
Table 1, 2 and 3 shows an overview of the sample size.
Table 1: Number of purse seine and beach seine canoes and sample size
Region Estimated no. of purse seine and beach seine Canoes
Sample size proportion
Volta 562 31 06%*
Greater Accra 809 178 22%
Central 370 65 18%
Western 486 136 28%
2
A total sample of 410 fishermen was then interviewed. This included 328 canoe owners and 82 crew members.
Table 2: Number of processors and sample size
Region Numbers of fish processors Sample size Proportion
Female Male Total
A total of 426 fish processors were selected and interviewed from the same landing sites where fishermen survey was carried out. It should be noted that respondents, both fishermen and fish processors, were not selected randomly and an opportunistic sampling strategy was used based on availability and willingness of individuals to participate in the survey. Hence, caution must be used in interpreting the results as it may not be representative of the
communities or regions sampled or of all fishermen and women involved in the small pelagic fishery nationally.
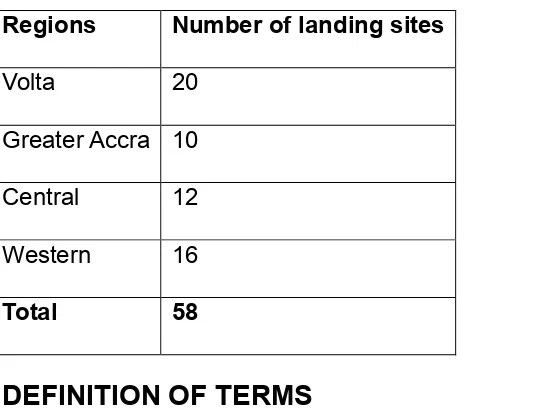
Table 3: Number of landing sites sampled per region
Regions Number of landing sites
Volta 20 Greater Accra 10 Central 12 Western 16
Total 58
DEFINITION OF TERMS
Fisherman: A fisherman or fisher is someone who captures fish and other animals from a
body of water, or gathers shellfish for food and/or employment.
Fish processor: A fish processor is someone who buys fish from a fisherman or fishmonger
Artisanal fisheries: Refer to the relative level of technology and capital used to operate
fishing gear to capture and land marine or inland fisheries resources.
Small scale fisheries: Refer to the size of the fishing unit relative to the overall fleet.
Overview map
Figure 1: Overview map of selected communities for the small pelagic fisheries profile
RESULTS
AGE DISTRIBUTION
The analysis of fishermen surveyed from the selected communities in the four coastal regions indicated that older generation dominated the fisheries in the traditional fishing communities, i.e., 51+ years along the coast. However the reverse is true in the cosmopolitan fishing communities like Tema, Elmina, Sekondi and communities with lots of migrant fishers like Half Assini.
4
Figure 2: Age distribution of fishermen surveyed from all selected communities in the four coastal regions
Volta Region:
Figure 3: Age distribution of fishermen surveyed in the Volta Region
Greater Accra Region:
5.6%
18-28 29-39 40-50 51+
P
Age Distribution of Fishermen Surveyed in Selected Fishing Communities in the Four Coastal Regions
Figure 4: Age distribution of fishermen surveyed in selected communities in Greater Accra Region
Central Region
Figure 5: Age distribution of fishermen surveyed in selected communities in Central Region
6
Figure 6: Age distribution of fishermen surveyed in selected communities in Western Region
EDUCATION LEVEL
At the national level, the education level among fishermen interviewed is relatively low. About 50% of fishermen have no formal education. Those who attended school have up to the basic education level, that is, Primary school up to Junior High School level.
Figure 7: Education level of fishermen surveyed from all selected communities in the four coastal regions
Volta Region
In the Volta, the education level of fishermen sampled was relatively high compared to other regions. The majority of small fishermen in the Volta region operate from beaches using beach seines. Although the majority of fishermen sampled are in the older generation they have basic formal education.
Figure 8: Education level of fishermen surveyed from the Volta RegionGreater Accra Region
8
significant proportion (17%) said they had some form of formal high school education, particularly in Tema and Prampram.
Figure 9: Education level of fishermen surveyed from selected communities in Greater Accra Region
Central Region
Figure 10: Education of fishermen surveyed from selected communities in Central Region
Western Region
10
Figure 11: Education level of fishermen surveyed from selected communities in Western Region
MIGRATION PATTERN
Ghanaian fishermen migrate from communities to communities in search of fish and other socio-economic drivers as explained by the interviewees. This migration take many forms, from short term movements over modest distances within the country to long distances across borders to Benin, Togo, Cote d’Ivoire, Liberia and as far north as Senegal. Their migration pattern hinges heavily on location of fish especially the small pelagics such as sardinella and anchovies. There seasonal pattern of movement of fishermen from their home landing site varies by region. Some migrate with their families to play an important role in marketing and fish processing but the majority migrate alone. The majority of fishermen move between July and December when small pelagics are migrating inshore and eastward. The migrants are organized and establish a code of behavior with the host communities or host country, respecting their rules and local etiquette.
Figure 12: Migration pattern of fishermen surveyed from selected communities in the four coastal regions
Volta Region
Figure 13: Migration pattern of fishermen surveyed in Volta Region
12
Figure 14: Migration pattern of fishermen surveyed from selected communities in Greater Accra Region
Central Region
Figure 15: Migration pattern of fishermen surveyed from selected communities in Central Region
Figure 16: Migration pattern of fishermen surveyed from selected communities in Western Region
NUMBER OF DEPENDENTS
As indicated by the fishermen sampled large family sizes are not uncommon among
fishermen with some marrying as much as 5 wives and some having as many as 15 children. However majority of those interviewed were married to one wife. The wives retail the fish and the children sometimes help in fishing expedition.
National
Figure 17: Number of wives of fishermen surveyed from the selected communities in the four coastal regions
Number of wives
Number of wives among fishermen sampled in selected communities in the four Coastal Regions
14
Figure 18: Number of children of fishermen surveyed from all the selected communities in the four coastal regions
Volta Region
Figure 19: Number of wives of fishermen surveyed in Volta Region
38%
Number of Children
Number of children among fishermen sampled in selected communities in the four coastal regions
Figure 20: Number of children of fishermen surveyed in the Volta Region
Greater Accra Region
16
Figure 22: Number of children of fishermen surveyed from the selected communities in Greater Accra Region
Central Region
Figure 24: Number of children of fishermen surveyed from the selected communities in Central Region
Western Region
18
Figure 26: Number of children of fishermen surveyed from the selected communities in Western Region
YEARS IN FISHING
Among the fishermen sampled in the selected communities along the four coastal regions, majority of them had more than 20 years of fishing experience. This confirms the long history and traditional ties of coastal communities with fishing. It is not just a livelihood but a way of life as expressed by some of the interviewees.
Figure 27: Fishing experience of fishermen surveyed from the selected communities in the four coastal regions
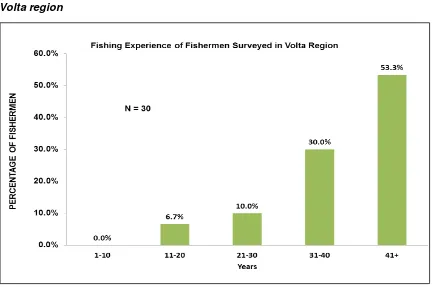
Volta region
Figure 28: Fishing experience of fishermen surveyed in Volta Region
Greater Accra Region
9%
1-10 11-20 21-30 31-40 41+
P
Fishing Experience Among sampled fishermen in Selected Communities along the Four Coastal Regions
20
Figure 29: Fishing experience of fishermen surveyed from the selected communities in Greater Accra Region
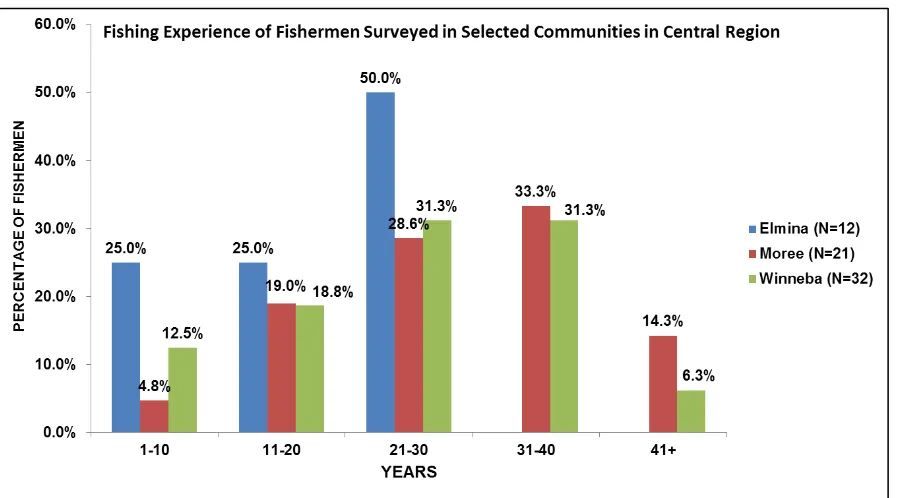
Central Region
Figure 30: Fishing experience of fishermen surveyed from the selected communities in Central Region
Figure 31: Fishing experience of fishermen surveyed from the selected communities in Western Region
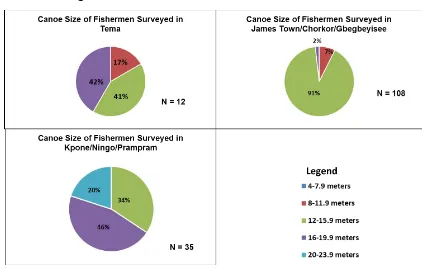
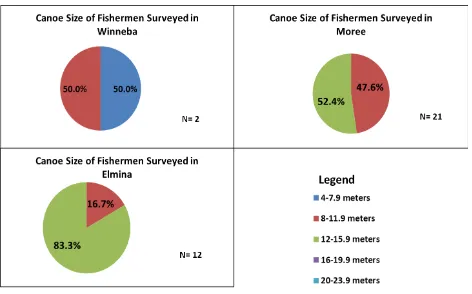
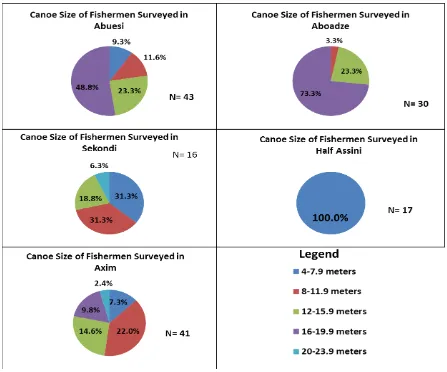
SIZE OF CANOE
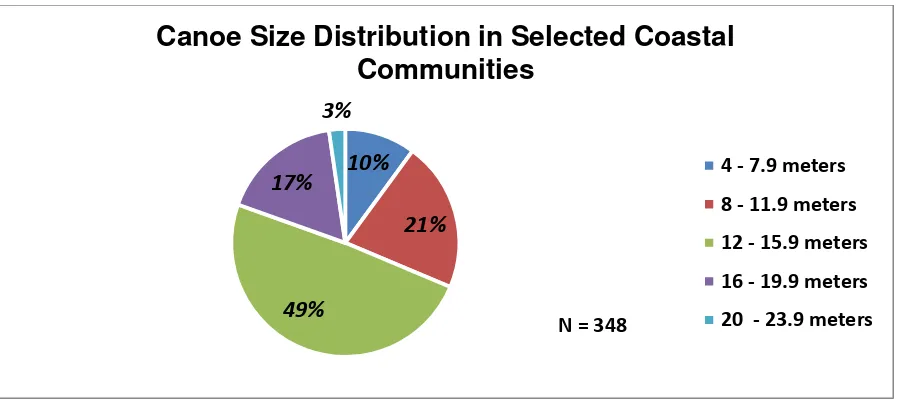
From the sample of fishermen in this survey, canoe size harvesting small pelagic in the artisanal fisheries sector are dominated by the 12-16 meters canoes. There are some extreme cases where sizes as large as 20 meters to 22 meters are recorded in places like Prampram and Half Assini. Smaller size canoes are used inshore close to lagoons and estuaries. National
Figure 32: Canoe size distribution from fishermen surveyed in the selected communities in the four coastal regions
10%
21%
49% 17%
3%
22 Volta Region
Figure 33: Canoe size distribution from fishermen surveyed in Volta Region
Greater Accra Region
Figure 34: Canoe size distribution from fishermen surveyed in the selected communities in Greater Accra Region
Central region
10%
56% 16%
18%
Canoe Size of Fishermen Surveyed in Volta Region
4 - 7.9 meters 8 - 11.9 meters 12 - 15.9 meters 16 - 19.9 meters
Figure 35: Canoe size distribution from fishermen surveyed in the selected communities in Central Region
24
Figure 36: Canoe size distribution from fishermen surveyed in the selected communities in Western Region
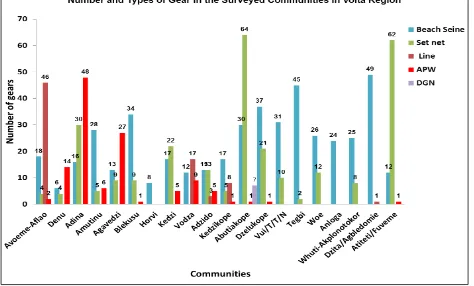
TYPE OF GEARS
Figure 37: Distribution of fishing gear types in the selected communities from the four coastal regions
Volta region
26 Greater Accra Region
Figure 39: Types of fishing gears in the selected communities in Greater Accra Region
Central Region
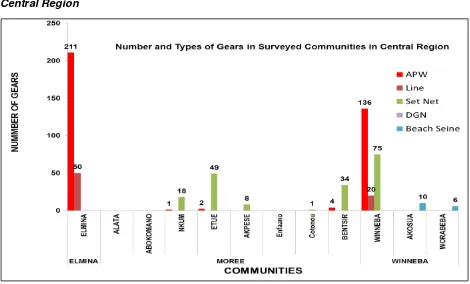
Figure 40: Types of fishing gears in the selected communities in Central Region
Figure 41: Types of fishing gears in the selected communities in Western Region
NUMBER OF FISHERMEN AND CANOES
The coast remains the most densely populated area in Ghana. The majority of people living in the coast are directly or indirectly involved in fishing activities. More work force are moving into fishing and more canoes enter into the fishery. According to census of fishermen and canoes in surveyed communities, fishermen in the selected communities outnumber the canoes by an average of 10 to 1 (i.e., for every one canoe constructed, there are 10 times the number of fishermen available). Everyone of this fishermen look forward to owning a canoe in a fishery faced with overcapacity and overfishing problem.
28
Figure 42: Number of fishermen and canoes harvesting small pelagic fish in Volta Region
Greater Accra Region
Figure 43: Number of fishermen and canoes harvesting small pelagic fish in selected communities in Greater Accra Region
Figure 44: Number of fishermen and canoes harvesting small pelagic fish in selected communities in Central Region
Western Region
30 TYPES SMOKING UNITS
Based on census of smoking unit conducted in 58 landing sites selected from the 4 coastal regions about three-fourth comprised of the traditional clay type (chorkor stove). There were a few improved stoves that were identified, they are the Morrison stove at New Takoradi and the Kosmos stove at Abuasi both in the Western Region.
National
Figure 46: Distribution of smoking units in the selected communities from the four coastal regions
Distribution of Smoking Units in the Surveyed Comminities from the Four Coastal Regions
Figure 47: Types of smoking units in selected communities in Volta Region
Greater Accra Region
Figure 48: Types of smoking units in selected communities in Greater Accra Region
32
Figure 49: Types of smoking units in selected communities in Central Region
Western Region
Figure 50: Types of smoking units in selected communities in Western Region
HISTORICAL PERSPECTIVE OF FISHERIES
the number of canoe and fishermen. Although the fishermen are aware of the decline, more canoes and fishermen continue to enter the fishery as indicated in the graphs below.
National
Figure 51: Perspective of change in the fisheries among fishermen surveyed in the selected communities from the four coastal regions
Volta Region
Figure 52: Perspective of change in the fisheries among fishermen surveyed in Volta Region
0
1960-1980 1980-2000 2000-PRESENT R
E
TIME LAPSE (YRS)
Perspective of changed in the Fisheries from the Selected Communities in the Four Coastal Regions
How many CANOES were fishing in your community?
How many FISHERMEN were involved in fishing in your community?
What was the average daily CATCH in kgs or pans?
N = 70
Perspective of Change in the Fisheries among Surveyed
34 Greater Accra Region
Figure 53: Perspective of change in the fisheries among fishermen surveyed in the selected communities in Greater Accra Region
Central Region
Figure 54: Perspective of change in the fisheries among fishermen surveyed in the selected communities in Central Region
Western Region
TIME LAPSE (YRS)
Perspective of Change in the Fisheries among Surveyed
Fishermen in Greater Accra Region N = 15
0
1960-1980 1980-2000 2000-PRESENT R
E
TIME LAPSE (YRS)
Perspective of Change in the Fisheries among fishermen
Figure 55: Perspective of change in the fisheries among fishermen surveyed in the selected communities in Western Region
CONCLUDING NOTES
Livelihood interventions: this should not be a one-size-fits-all approach.
Interventions should focus on the younger age brackets that are already looking for a way out of the fisheries.
Smoking units: space and available material should be considered in smoking unit
improvement. These factors influence smoking unit choice in fishing communities along the coast.
Communication strategy: a more practical communication options should be
considered when developing communication strategy for fisher folks. Dramas, sketches should be used for effective communication.
Migration: it takes many forms, from short term – short distance movement
in-country to long term – long distance movement to countries far away from home port. This should be considered in formulating policy for the sector
Older generation (40 years and above) forms a higher proportion of the population of fishermen in the small pelagic fishery surveyed.
General level of education among fishermen is low as a higher percentage of
fishermen surveyed in the selected communities were educated up to the basic level. Large family size is not uncommon among fishermen surveyed in the selected fishing
communities
1960-1980 1980-2000 2000-PRESENT RE
LAT
Perspective of Change in the Fisheries among Fishermen Surveyed in Western Region
36
ANNEX
38
Survey Questionnaires
DATA COLLECTION PROTOCOL
INTRODUCING THE PROJECT
The Sustainable Fisheries Management Project (USAID/SFMP) is a five-year initiative (October 1, 2014 – September 30, 2019) supported by the U.S. Agency for International Development (USAID-Ghana). It is implemented through a cooperative agreement with the University of Rhode Island (URI).
Implementing partners include Hen Mpoano, FON, SSG, CEWEFIA, DAA, DASGIFT and other key government, private sector and Non-Governmental Organizations (NGO)
stakeholders along the coast and in the fisheries sector.
The main goal of the USAID/SFMP Project is to support the Government of Ghana’s efforts to achieve reform of its fisheries sector by strengthening many of the enabling conditions necessary to end overfishing and rebuild small pelagic fisheries and to improve post-harvest processing conditions through effective tools and approaches in a participatory fisheries management process.
The annual sardinella catch from the canoe fishery has plummeted from just over 17,000 metric tons in 2012 from a high of 120,000 metric tons just a dozen years earlier.
Overfishing due to an increasing number of boats and fishers in an open access fishery and weak governance all contribute to the crisis. At risk are not only the livelihoods of more than 25,000 Ghanaians engaged in the fishery sector but also the food security of the nation and region.
Immediate action is needed to reverse this decline. The menu of potential management measures that can reverse this decline and rebuild the fishery are known and have proven effective elsewhere in the world. Needed are the applications of some combination of several of the following options:
Freeze on new canoes and licenses Closed seasons
Closed areas
Reduction on number of industrial vessels Promote best fishing practices
Promote new processing techniques Involve fishermen in direct management
These actions will only work if all the stakeholders including fishermen (canoe, semi-industrial and trawlers) fishmongers, processors and government agree to work together to ensure everyone follows the rules agreed to and are applied.
This questionnaire is designed to seek information on Small pelagic fisheries to improve management and inform policy decisions on the resource. Any information given will be used solely for such purposes. Your cooperation in answering these questions below shall be very much appreciated. You are assured that answers will be handled with strict confidentiality.
Please tick [ √ ] or fill in the blank spaces where appropriate and provide additional information or comment where necessary
TAXONOMY
What fish species do you harvest? Provide local names:
a. Pelagic fish species
Scientific names Local names
Round Sardine (Sardinella aurita) Flat Sardine (Sardinella maderensis) Anchovy (Engraulis encrasicolus) Chub Mackerel (Scomber japonicas) Ribbon Fish (Trachurus sp)
b. Demersal fish species
40
Canoe Fishermen Survey
1. Name: ……….Cell No………. 6. How many children do you have? :……….. 7. How many years have you been a fisherman? :……….
8. What is your principal fishery? □ Pelagic □ Demersal 9. Which type of gear(s) do you use?
□ APW □ Beach seine □ Set net □ Drift Gill Net (DGN □Hook & line
10.What other type of fishing are you engaged in? (Target species): ……… 11. Do you own a canoe? □Yes□No
12.If yes, fill the table below: How many?
Which year was the canoe built? What is the size of the canoe?
What is the horse power of the motor? Construction material of the canoe
13.How many crewmen work on the canoe(s)? :………..
14.How do you describe your fish catch from 2000-present? □Decreased □ Increased 15.How many days is your fishing trip?
:………..
17.What percentage of your personal/household income is derived from fishing income? :…
18.Where is your primary landing site?
:………
19.Do you migrate to fish? □Yes□No
a. If yes, where? :………
b. Which month of the year? :………
20.Do you belong to any type of fishermen’s organization? □Yes□No 21.If yes, name the organization(s):
………
22.Is your canoe(s) registered? □Yes□No 23.Do you have health insurance? □Yes□No 24.Do you have insurance for the canoe? □Yes □No 25.Any other comment/questions?
:………..
How many FISHERMEN were involved in fishing in your community?
What type of FISHING GEAR existed in your community?
How long was your fishing TRIP?
What was the average daily CATCH in kgs or boxes? What was the PRICE per Kgs or box?
42 a. Beach seine
b. Watsa
What was the average size of the PURSE SEINE used in your community?
What was the MESH SIZE of the PURSE SEINE used in your community?
What was the average LENGTH of the BEACH
SEINE used in your community?
What was the MESH SIZE of the BEACH SEINE used in your community?
What was the size of CREW MEMBERS per one canoe?
What was the SIZE of CREW hauling BEACH
SEINE?
What was the average HORSE POWER of the engine used for Canoe?
Fish Processors Survey 6. Level of education
□ never been to school □ primary school □ JHS □ SHS □ Tertiary 7. Do you come from this community?
□Yes□No (Migrant)
8. How many years have you been processing fish? :...
9. How do you process your fish? □ Smoking □ Frying □ Sun-Drying □ Salting □ Others-Please specify: ……….
14.Which fish species do you process? Please explain
□ Pelagic: ……… □ Demersal: ……… □ Both: ……… 15.Where do you get fish to process? □ Local fishermen □ Cold stores □ others (Please
specify): ……….
1960-1980 1980-2000 2000-PRESENT 18 What is the average price (GH¢) per pan/crate of
fish processed
19 Operating Costs (GH¢) for Processed fish a. Wood
b. Labour
c. Fish purchased d. Paper for packaging
e. Others (Please specify): ………
Peak season
Lean season 10.How many days in a week do you engage in fish processing?
11.How many hours per day did you process fish
12.How many pans/crate of fish (quantity) do you process per day 13.How many pans/crate of fish are kept on average per day for
44 20. Where do you market processed fish?
□ Community
□ Within Ghana (specify)……… □ Outside Ghana (specify)………
21. Number of dependents in households engaged in fish processing: ……….
22. Number of processing and storage facilities owned □ Oven………
□ Stove……… □ Freezer……….
□ Others (Please specify)………. 23. Are you a vessel/canoe owner? □Yes□No
24. If yes, how many vessel/canoe do you own? ... 26. Do you finance fishing expeditions? □Yes□No
26. If yes, how frequent do you finance expeditions? : ... 27. Are you ever asked for special favors (e.g. sex for fish) to buy fish from a fishermen? □Yes□No
28. Any other comment/questions?