CA
By WINSTON ASANTE and NICHOLAS JENGRE
i
This publication is available electronically on the Coastal Resources Center’s website at http://www.crc.uri.edu
For more information on the Integrated Coastal and Fisheries Governance project, contact: Coastal Resources Center, University of Rhode Island, Narragansett Bay Campus, 220 South Ferry Road, Narragansett, Rhode Island 02882, USA. Brian Crawford, Director International Programs at [email protected]; Tel: 401-874-6224; Fax: 401-874-6920.
For additional information on partner activities:
WorldFish: http://www.worldfishcenter.org Friends of the Nation: http://www.fonghana.org Hen Mpoano: http://www.henmpoano.org Sustainametrix: http://www.sustainametrix.com
Citation: Asante, W. and Jengre, N. (2012) Carbon Stocks and Soil Nutrient Dynamics in the Peat Swamp Forests of the Amanzule Wetlands and Ankobra River Basin. USAID Integrated Coastal and Fisheries Governance Program for the Western Region of Ghana. Accra: Nature Conservation and Research Centre. 45 pp.
Disclaimer: This publication is made possible by the generous support of the American people through the United States Agency for International Development (USAID)/Ghana. The contents of this report are the responsibility of the Integrated Coastal and Fisheries Governance (ICFG) Program and do not necessarily reflect the views of the United States Government. Associate Cooperative Agreement No. 641-A-00-09-00036-00 for “Integrated Coastal and Fisheries Governance (ICFG) Program for the Western Region of Ghana,” under the Leader with Associates Award No. EPP-A-00-04-00014-00.
Cover Photo: Two men among mangroves.
ii
ACKNOWLEDGEMENTS
This research was commissioned by the Coastal Resources Center (CRC), implementers of the “Hen Mpoano” project with funding from USAID.
We are extremely grateful to Mark Fenn and all of the CRC staff for their support, especially our most dependable driver and field assistant, Samuel Aikins, for the extra hand and wild adventure throughout the duration of the work. We further acknowledge the wonderful cooperation and support of the Chiefs and people in the areas where we conducted our field work.
iii
TABLE OF CONTENTS
ACKNOWLEDGEMENTS ... ii
Table of Contents ... Error! Bookmark not defined. EXECUTIVE SUMMARY ... iv
3.1 BIOMASS CARBON STOCKS ... 7
3.1.1 EFFECTS OF HYDROLOGY ON SPECIES DIVERSITY INDICES ... 9
3.2 SOIL CHEMICAL AND PHYSICAL PROPERTIES DYNAMICS ... 10
3.2.1 SOIL CHEMICAL PROPERTIES ... 10
3.2.2 SOIL PHYSICAL PROPERTIES ... 19
3.2.3 SOIL ORGANIC CARBON STOCKS ... 22
3.2.4. EFFECTS OF HYDROLOGY ON DISTRIBUTION OF SOIL NUTRIENTS .... 23
3.2.5. EFFECTS OF DEGRADATION AND DEFORESTATION ON DISTRIBUTION OF SOIL NUTRIENTS ... 24
4.0 DISCUSSION ... 26
4.1 BIOMASS CARBON STOCKS ... 26
4.2 SPECIES DIVERSITY INDICES ... 27
4.3 SOIL CHEMICAL AND PHYSICAL PROPERTY DYNAMICS ... 29
4.3.1 SOIL CHEMICAL PROPERTIES ... 29
4.3.2 SOIL PHYSICAL PROPERTIES (BULK DENSITY AND TEXTURE) DYNAMICS ... 29
4.3.3 SOIL ORGANIC CARBON STOCKS DYNAMICS ... 30
4.4 EFFECTS OF HYDROLOGY ON DISTRIBUTION OF SOIL NUTRIENTS ... 30
4.5 EFFECTS OF DEGRADATION AND DEFORESTATION ON DISTRIBUTION OF SOIL NUTRIENTS ... 31
4.6. EFFECTS OF HYDROLOGY ON TOTAL BIOMASS CARBON STOCKS ... 32
4.7. EFFECTS OF DEGRADATION AND DEFORESTATION ON DISTRIBUTION OF TOTAL BIOMASS CARBON STOCKS ... 33
5.0 CONCLUSIONS AND RECOMMENDATIONS ... 35
5.1. CONCLUSIONS ... 35
5.2. RECOMMENDATIONS ... 35
iv
EXECUTIVE SUMMARY
The long-term instability of the large amount of carbon stored in tropical peat lands is of major concern within the context of contemporary climate change as result of rapid deforestation and degradation. In Ghana, however, most land use change studies have concentrated on terrestrial vegetation, with very few research activities on the peat swamp forest. Of those studies that have been conducted, the majority have focused on faunal surveys and plant species identification. As a result, there is no available data on the role of peat swamp forests in carbon sequestration and the associated impacts of anthropogenic activities in these unique ecosystems. This research was commissioned as a first effort to understand the carbon stock and nutrient dynamics of the peat swamp forest in the greater Amanzule Wetlands, including the role of anthropogenic activities in the loss of accumulated carbon stores.
Data was collected on tree species, above ground biomass, soil carbon stocks, and soil nutrients from twenty-one sample plots (100 m x 100m) that were stratified according to hydrology (permanently flooded, seasonally flooded) and site condition (intact forest, degraded areas and deforested areas).
Results indicated that mean aboveground carbon stocks in intact peat swamp forest areas was 114.29 ± 15.92 MgC/ha, with degraded areas recording 71.27 ± 10.26 MgC/ha, and
deforested areas having 20.46 ± 12.12 MgC/ha.
Hydrology (permanent or seasonal inundation) had a clear impact on tree and soil biomass in the landscape. The seasonally flooded areas had the highest total carbon stocks, with
aboveground carbon being the dominant pool. However, permanently flooded areas had higher soil carbon content than the seasonally flooded plots.
In terms of site condition and anthropogenic activities, overall, intact forest plots had the highest total carbon stocks, followed by the deforested sites and then the degraded plots. When broken down according to the carbon pools, the intact sites recorded the highest above and below ground biomass levels, followed by the degraded sites. As a result of
anthropogenic activities, the deforested sites recorded the lowest above and below ground biomass carbon stocks because most of the sites were converted to agricultural crops (maize and cassava).
Unlike the biomass trends in the above and below ground pools, however, the highest carbon stocks in the soil component were recorded in the deforested sites. The reasons for these differences appears to be that deforestation activities, while removing aboveground biomass, leave large amounts of litter and woody debris to decompose into the soil. Therefore,
following deforestation the soil receives a significant input of soil organic carbon. These differences can be further explained by the fact that degradation (small-scale logging and firewood harvesting) reduces the amount of biomass in the aboveground pool, but do not significantly impact the soil pool as only minimal amounts of debris are left to decompose. Analysis of the major nutrients (N,P,K) and carbon content in the soil showed that all were significantly higher in the upper soil depth class (0-30 cm) than the lower soil depth class (30-100 cm), but that hydrology had a significant impact on nutrient distribution.
v
This peat swamp forest of the Amanzule Wetlands and Ankobra River basin is a truly unique landscape. Threats to the peat swamp forest, while still minimal, may be mounting,
1
1.0
INTRODUCTION
Globally, tropical peats cover approximately 11% of global peat lands (Page et al., 2010). Despite the relatively smaller area of tropical peats, compared to boreal and temperate peats, tropical peat lands are among the largest carbon stores (Jauhiainen et al., 2005; Rydin and Jeglum, 2006).
Like all tropical forests, peat swamp forest stores large amounts of carbon in plant biomass, with typical values in the range of 100-250 t C/ ha (Murdiyarso, Hergoualc’h & Verchot, 2010; Page et al., 2011). The incomplete decomposition of dead tree material, especially roots, has led to the slow but progressive accumulation of partially decomposed organic material (peat) over millennia and has given this ecosystem a very high carbon density. Peat (and carbon) accumulates as a result of a positive net imbalance between the high primary production in tropical ecosystems and incomplete organic matter decomposition in permanently saturated soil conditions (Hooijer et al., 2010; Wösten et al., 2008).
Figure 1 Schematic diagram of a tropical peat dome. The water table will be at or above the peat surface for much of the year, with limited drawdown during the dry season (typical range 30-40 cm) (Source: Verwer and van der Meer, 2010).
In a natural state, peat swamp forests are characterized by dense forest vegetation, thick (up to 20 m) peat deposits, and a groundwater table that is at or close to the peat surface
throughout the year (Hirano, Jauhiainen, Inoue, & Takahashi, 2009; Page et al., 2004;
Takahashi et al., 2002; Wösten et al., 2008). Surface peat is aerobic (unsaturated) only during relatively dry periods when the water table falls below the surface (Hirano et al., 2007, 2009; Jauhiainen et al., 2005; Jauhiainen et al., 2010).
2
sequestration must exceed that in decomposition losses (Jauhiainen et al., 2008; Jauhiainen et al., 2005, 2010).
Therefore the existence of extensive peat deposits demonstrates that the associated
ecosystems have functioned as a large net sink for atmospheric carbon at a millennial time scale (Page et al., 2010, 2004). Currently, however, the vast majority of the peat lands are to some extent degraded as a result of anthropogenic land use change and are emitting
accumulated carbon faster than it is being sequestered (Hooijer et al., 2010, 2011; Jauhiainen et al., 2010; Page et al., 2011). Deforestation, drainage, large-scale conversion to plantation agriculture, and regular fires has all resulted in increased carbon transfer to the environment and loss of carbon sequestration function. Invariably, optimum carbon storage in tropical peat requires a combination of high vegetation biomass (carbon sequestration potential), a water table that is near to or above the peat surface for most of the year, and a much-reduced rate of organic matter decomposition. Drainage and other disturbances lead to increased surface peat aeration and decomposition as well as carbon losses (Page et al., 2011).
The long-term instability of the large amount of carbon stored in tropical peat lands is of major concern within the context of contemporary climate change (Raupach & Canadell, 2010) due to the chance of rapid deforestation and degradation (Mc Morrow and Talip, 2001).
However in Ghana, most land-use dynamics studies have concentrated on terrestrial
vegetation, with little attention to these vital peat ecosystems and their ecosystem services. Only a few research activities have been carried-out in peat swamp forests, and the focus was primarily to conduct faunal surveys and plant species identification. There is no data on the role of peat swamp forests in carbon sequestration and the associated impacts from
anthropogenic activities.
3
2.0
METHODOLOGY
2.1 STUDY AREA
The sampling sites (see Figure 2) are located within the Amanzule River/Wetlands basin and the Ankobra River basin. The Amanzule Wetland (latitudes 4° 53' and 4° 46' North and longitude 2° 00' and 2° 05' west) is a community protected area in the Western Nzema Traditional Area of the Western Region. The catchment of both the Amanzule Wetland and the Ankobra River are contiguous and lie within the Wet Evergreen Forest Zone of Ghana. The Amanzule Wetland covers an area of approximately 100 sq. km. and is situated approximately 360 km west of Accra. The Ankobra River rises north-east of Wiawso, and flows about 190 km south to the Gulf of Guinea.
Figure 2 Map of the study area.
The soils in the study area are predominantly Forest Oxysols (Brammer, 1962). The hydrology is driven by six streams, one lake, and one outlet to the sea. It includes the freshwater
Amanzule lagoon, the coastal Amanzule lagoon and estuary, and the sandy beach between the Amanzule and Ankobra River, an area that is subject to seasonal flooding. It is a relatively
pristine complex consisting of a freshwater lagoon, forest, grasslands and rivers. It has the most extensive remaining stand of intact peat and swamp forest in Ghana. The area falls within Ghana’s High Forest Zone, and is within the equatorial climate zone, which is characterized by moderate temperatures, high rainfall and relative humidity. Specifically, it experiences a double-maxima pattern of rainfall with peaks in May-June and October-November each year. The average annual rainfall is 1,600 mm with the relative humidity being 87.5%. A mean annual temperature of 26° C has been recorded. However, there is a short dry season (Dec-Mar) during which period a northwesterly directional wind is experienced which brings slight harmattan conditions.
2.2 METHODS
Initially, the team conducted a reconnaissance survey in order to generate a better
4
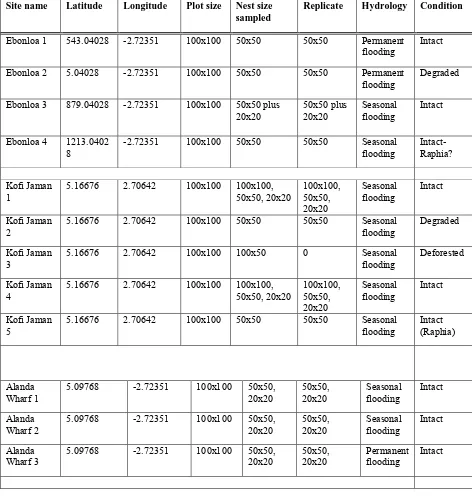
A total of twenty-one sample spots were selected (n=21) based on a two predominant
landscape variables; site condition (e.g. anthropogenic disturbance) and hydrology in order to capture an understanding of soil nutrient and carbon stock dynamics within the peat swamp forest area. Table 1 shows all sample plots, their location, plot size and design, forest condition and hydrology. Sample locations were initially stratified visually according to three categories; intact forest (n=17), degraded forest (n=2), and deforested (n=2). Intact forest was quite common, whereas degraded and deforested patches were comparatively difficult to locate, hence the comparatively small sample sizes. Intact areas were judged to be relatively undisturbed. Degraded areas were judge to be areas which had been disturbed but had not been converted to other land use types. Deforested areas were patches which have been converted to other land use types. While in the field, the team realized that within the intact forest, extensive patches of Raphia hookeri were common. Therefore, of the intact
forest sample plots, three were patches dominated by the palm species (n=3).
Samples plots were further stratified according to hydrology—permanently flooded and seasonally flooded. Four intact forest plots were permanently flooded (n=4) and 13 were seasonally flooded (n=13). The degraded sites were split between being permanently flooded (n=1) and seasonally flooded (n=1). The deforested sites were both seasonally flooded (n=2). A 100 by 100 m nested approach in plot design was used to capture the different diameter classes in the sample areas. The number of nests for each plot was based on the variation in the diameter classes. In order to achieve statistical robustness, each nest was replicated twice. Soil samples were taken at the four corners of each 100 x 100 m plot, and in the center to mimic the letter “z”. Soil samples were taken from seventeen plots (n=17) for the
determination of soil nutrients as an indication of fertility, including carbon stocks, as well as the determination of soil bulk density. Due to the flooded nature of the soil in four plots, it was impossible to collect accurate samples. A galvanized pipe (length = 100 cm; diameter = 5 cm) was driven into the soil up to the 100 cm mark to allow soil to fill it up. Soil samples were then taken at various depth intervals for laboratory analysis in the following order: 1-15 cm
15-30 cm 30-50 cm 50 -100 cm.
At each soil depth interval, due to the wet nature of the soil, samples were removed from the middle portion up to 5 cm, to give a representation of the particular soil depth and transported to Soil Science Laboratory of the Faculty of Agriculture, KNUST, for analysis.
The samples were air-dried, crushed and sieved through a 2 mm mesh. Soil pH was
determined in distilled water using a Glass electrode- Calomel electrode (McLean, 1982) MV Pracitronic pH meter. Soil pH was measured at a soil: solution ratio of 1: 2. Organic carbon was determined using the wet combustion method of Walkley and Black (1934). Total N was determined using the method of Bremmer (1965). Available phosphorus was determined using the method of Bray and Kurtz (1945). Exchangeable bases were extracted with 1.0 M
NH4OAc (pH 7.0), exchangeable K, Al and H in the extract were determined by flame
5
2.3 DATA COLLECTION
In each sampled nest, data was collected on the following parametres:• tree diameter (≥ 2 cm)
• tree height
• tree species
Soil samples were collected to generate data on the following parametres:
• soil nutrients
• bulk density
• soil texture
Table 1 Nested plot design at each site and site condition.
Site name Latitude Longitude Plot size Nest size sampled
Replicate Hydrology Condition
Ebonloa 1 543.04028 -2.72351 100x100 50x50 50x50 Permanent
flooding Intact Ebonloa 2 5.04028 -2.72351 100x100 50x50 50x50 Permanent
flooding Degraded Ebonloa 3 879.04028 -2.72351 100x100 50x50 plus
20x20 50x50 plus 20x20 Seasonal flooding Intact
Ebonloa 4 1213.0402
6
Site name Latitude Longitude Plot size Nest size sampled
Replicate Hydrology Condition
Alanda 1 5.11601 -2.72351 100x100 50x50, 20x20 50x50,
20x20 Seasonal flooding Intact Alanda 2 5.11601 -2.72351 100x100 100x100,
50x50, 20x20 100x100, 50x50, 20x20
Seasonal
flooding Intact
Alanda 3 5.11601 -2.72351 100x100 100x50,
50x50, 20x20 100x50, 50x50, 20x20
Seasonal
flooding Intact
Alanda 4 5.11601 -2.72351 100x100 50x50 50x50 Seasonal
flooding Intact (Raphia)
Aloapeke 1 4.99767 -2.72351 100x100 100x100,
50x50 100x100, 50x50 Seasonal flooding Intact Aloapeke 2 4.99767 -2.72351 100x100 100x100,
50x50, 20x20 100x100, 50x50, 20x20
Seasonal
flooding Intact
Aloapeke 3 4.99767 -2.72351 100x100 100x100 100x100, 50x50, 20x20
Seasonal
flooding Deforested
Twenen 1 5.02434 -2.72351 100x100 100x100,
50x50, 20x20 100x100, 50x50, 20x20
Permanent
flooding Intact
Twenen 2 5.02434 -2.72351 100x100 50x50, 20x20 50x50,
20x20 Permanent flooding Intact
2.4 DATA ANALYSIS
Data on tree parameters were analyzed to generate data on biomass and carbon stocks at intact, degraded and deforested sites, as well as seasonally and permanently flooded areas. Chave and colleagues’ (2005) allometric equation was used to generate aboveground biomass results, while belowground biomass was computed to be 20% of aboveground (IPCC GPG, 2003).
Soil bulk density was calculated using the equation;
��������������� (�/��3) =���������� − ���������ℎ�������
������������
����������������������� (��
ℎ�) =��������������� ×��������ℎ ×�������������
7
3.0 RESULTS
3.1 BIOMASS CARBON STOCKS
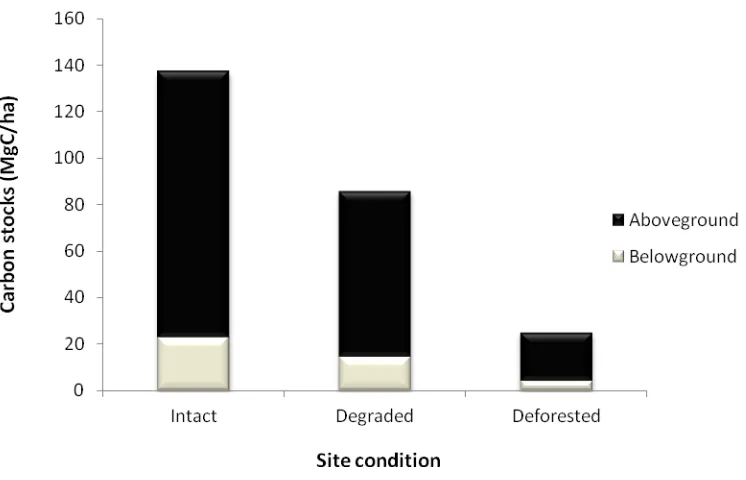
Results indicated that mean aboveground carbon stocks in intact areas was 114.29 ± 15.92 MgC/ha, with degraded areas recording 71.27 ± 10.26 MgC/ha, while that of deforested areas was 20.46 ± 12.12 MgC/ha. However, belowground carbon stocks for intact areas was 22.86 ± 3.18 MgC/ha, with degraded areas having 14.25 ± 2.05 MgC/ha, and that of deforested areas recording 4.09 ± 2.43. Figure 3 shows above and belowground carbon stocks under the different site conditions.
Figure 3 Above and belowground carbon stocks at different site conditions.
The mean difference between intact and degraded plots was 51.63 MgC/ha, while the mean difference between intact and deforested plots was 112.6 MgC/ha. Raphia palm constituted a major vegetation type in the site. The mean aboveground carbon stock of Raphia dominated patches was 49.31 ± 10.01, while the belowground carbon stock was 9.86 ± 0.84.
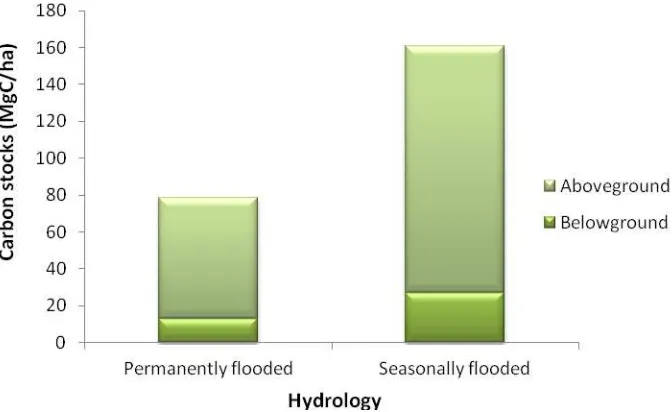
The influence of seasonality of the hydrological conditions at the site, in terms of duration of inundation showed that the permanently flooded areas had aboveground and belowground carbon stocks of 65.24 ± 11.83 and 13.05 ± 2.37 respectively, while that of seasonally flooded areas had aboveground and belowground carbon stocks of 133.92 ± 18.44 and 26.78 ± 3.69 respectively. Figure 4 shows the influence of hydrology on aboveground and
8
Figure 4 Influence of hydrological condition on above and belowground carbon stocks
Table 2 Aboveground and belowground carbon stocks in all the study areas.
CARBON STOCKS (MgC/ha)
TOTAL C STOCKS
SITE HYDROLOGY
FOREST
CONDITION ABG BG (MgC/ha)
Ebonloa 1 Permanent flooding Intact 62.01 12.402 74.412 Alanda Wharf 3 Permanent flooding Intact 103.44 20.688 124.128 Twenen 1 Permanent flooding Intact 56.58 11.316 67.896 Twenen 1 Permanent flooding Intact 38.91 7.782 46.692
Ebonloa 3 Seasonal flooding Intact 85.56 17.112 102.672 Kofi Jaman 1 Seasonal flooding Intact 111.99 22.398 134.388 Kofi Jaman 4 Seasonal flooding Intact 88.91 17.782 106.692 Alanda Wharf 1 Seasonal flooding Intact 126.19 25.238 151.428 Alanda Wharf 2 Seasonal flooding Intact 89.95 17.99 107.94 Alanda 1 Seasonal flooding Intact 98.06 19.612 117.672 Alanda 2 Seasonal flooding Intact 244.27 48.854 293.124 Alanda 3 Seasonal flooding Intact 86 17.2 103.2 Aloapoke 1 Seasonal flooding Intact 231.78 46.356 278.136 Aloapoke 2 Seasonal flooding Intact 176.47 35.294 211.764
Kofi Jaman 2 Seasonal flooding Degraded 56.76 11.352 68.112 Ebonloa 2 Permanent flooding Degraded 85.78 17.156 102.936
Kofi Jaman 3 Seasonal flooding Deforested 3.31 0.662 3.972 Aloapoke 3 Seasonal flooding Deforested 37.61 7.522 45.132
9
CARBON STOCKS TOTAL C
(MgC/ha) STOCKS
FOREST
SITE HYDROLOGY CONDITION ABG BG (MgC/ha)
Kofi Jaman 5 Seasonal flooding (Raphia) Intact 67.15 13.43 80.58
Alanda 4 Seasonal flooding (Raphia) Intact 54.95 10.99 65.94
3.1.1 EFFECTS OF HYDROLOGY ON SPECIES DIVERSITY INDICES
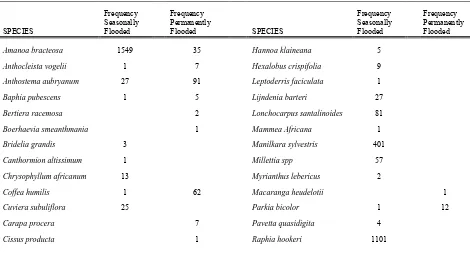
There were a total of 52 species recorded in all the sites (seasonally and permanently
flooded). Forty-one species were found in the seasonally flooded sites, while 31 species were identified in the permanently flooded sites. Twenty-one species only occurred in seasonally flooded areas, and 11 species were only identified in permanently flooded areas. Raphia
hookeri was the dominant species in the seasonally flooded sample areas, while Uapaca
paludosa was the dominant species in the permanently flooded area. Two species were
unknown and according to the botanist are yet to be identified. This is currently being validated. Table 4 shows the species identified and their frequency.
Shannon-Weiner diversity index (Shannon H') showed that the permanently flooded area was more diverse, and had a more even distribution (Shannon J') than the seasonally flooded area. Kulczynski’s species similarity index showed a similarity of 56.65% for the two site types.
Table 3 Species diversity indices at seasonally and permanently flooded sites.
Index Seasonal Permanent
Shannon H'
Table 4 Species identified and their frequency of occurrence at the seasonally and permanently flooded sites.
Frequency Frequency Frequency Frequency
Seasonally Permanently SPECIES Flooded Flooded
Amanoa bracteosa 1549 35
Seasonally Permanently SPECIES Flooded Flooded
Hannoa klaineana 5
Anthocleista vogelii 1 7 Hexalobus crispifolia 9
Anthostema aubryanum 27 91 Leptoderris faciculata 1
Baphia pubescens 1 5 Lijndenia barteri 27
Bertiera racemosa 2 Lonchocarpus santalinoides 81
Boerhaevia smeanthmania 1 Mammea Africana 1
Bridelia grandis 3 Manilkara sylvestris 401
Canthormion altissimum 1 Millettia spp 57
Chrysophyllum africanum 13 Myrianthus lebericus 2
Coffea humilis 1 62 Macaranga heudelotii 1
Cuviera subuliflora 25 Parkia bicolor 1 12
Carapa procera 7 Pavetta quasidigita 4
10
Frequency Frequency Frequency Frequency
SPECIES Seasonally Flooded Permanently Flooded SPECIES Seasonally Flooded Permanently Flooded
Cleistopholis patens 6 Sarcocephalus pobeguinii 35 1
Coelocaryon oxycarpum 9 Spondianthus preussi 78 8
Cynometra ananta 4 Symphonia globulifera 81 79
Diospyros chevalieri 25 9 Synsepalum brevipes 8
Euginea calophylloides 13 Syzygium rowlandii 140 136
Euginea afzelii 5 16 Tetracera offinis 1 12
Ficus tricopoda 9 13 Treculia Africana 23
Ficus vogeliana 1 Tricalysia coriacea 21
Garcinia smeathmannii 32 Tetrorchidium didymostemon 1
Gardenia imperialis 72 8 Tabernaemontana africana 8
Hallea ledermannii 54 90 Uapaca heudelotii 2 5
Hereteiria utilis 19 Uapaca paludosa 65 260
Vitex grandifolia 2 1
Xylopia rubescens 47 95
3.2 SOIL CHEMICAL AND PHYSICAL PROPERTIES DYNAMICS
Soil chemical properties presented in this section include pH, organic carbon, total nitrogen, available phosphorus, exchangeable potassium, exchangeable aluminium and exchangeable hydrogen. The results demonstrate soil nutrients distribution in the different sites and at different depth classes.
Though the soil samples were taken at different intervals up to a depth of 100 cm, the results are presented in two depth classes (0-30 and 30-100 cm). This is because the IPCC
recommends carbon accounting to the top 30 cm; however, the team also wanted to show what is happening at deeper depths.
3.2.1 SOIL CHEMICAL PROPERTIES
Soil pH
11
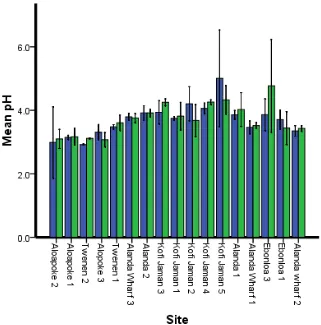
Figure 5 Soil pH variation at two depth classes at different sites
Soil Carbon Content
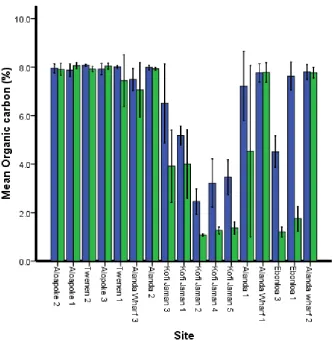
Soil organic carbon content showed significant difference between the two depth classes (0 – 30 cm and 30 – 100 cm) and the interaction between depth (F = 70.1, df = 1, P = ˂0.001) and site (F = 6.59, df = 16, P = ˂0.001).
12
Figure 6 Soil carbon content variation at two depth classes at different sites
Total Nitrogen (N)
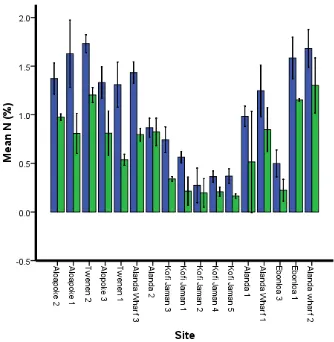
There was a significant difference in mean total N between the two depth classes (F = 173.29, df = 1, P = ˂ 0.001) and in the interaction between depth and site (F = 2.94, df = 16, P = 0.001).
13
Figure 7 Total Nitrogen variation at two depth classes at different sites
Potassium (K)
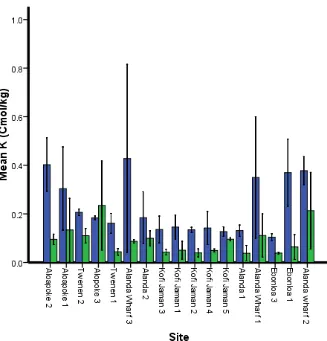
There was a significant difference in K content between the two depth classes (F = 55.74, df 1, P = ˂0.001), as well as in the interaction between depth and site (F = 1.92, df 16, P = 0.034).
14
Figure 8 Potassium content variation at two depth classes at different sites
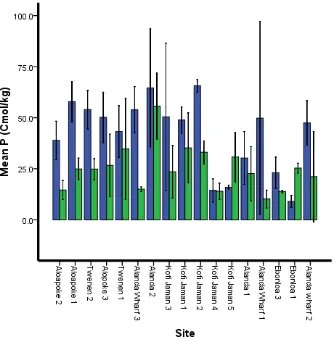
Phosphurus (P)
There was a significant difference in P content between the two depth classes (F = 42.18, df=1, P = ˂0.001), as well as the interaction between depth and site (F = 2.44, df 16, P = 0.006).
15
Figure 9 Phosphorus variation at two depth classes at different sites
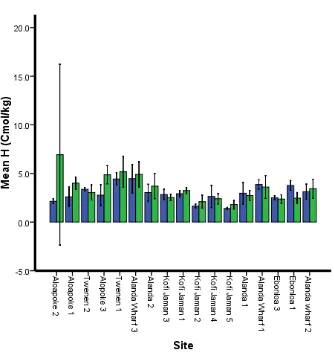
Hydrogen concentration (H)
16
Figure 10 Hydrogen content variation at two depth classes at different sites
Aluminium concentration (Al)
There was a significant difference in Al content between the two depth classes (F = 6.08, df=1, P = 0.016). The difference was also significant in the interaction between depth and site (F = 7.42, df = 16, P = ˂0.001).
17
Figure 11 Aluminium variation at two depth classes at different sites
Table 5 Distribution of pH, N, P, and K at two depth classes at different sites
Site
Depth /
cm pH SE
N
(%) SE P
(cmol/kg) SE K
(cmol/kg) SE
ALOAPOKE 2 0-30 2.99 0.33 1.37 0.07 38.88 5.61 0.40 0.11
30-100 3.10 0.30 0.98 0.07 14.60 2.91 0.10 0.01
ALOAPOKE 1 0-30 3.15 0.04 1.63 0.12 57.88 4.52 0.30 0.06
30-100 3.17 0.11 0.81 0.09 24.91 1.98 0.13 0.05
TWENEN 2 0-30 2.92 0.03 1.73 0.04 54.01 3.47 0.21 0.01
30-100 3.12 0.08 1.20 0.14 24.86 3.09 0.11 0.03
TWENEN 1 0-30 3.48 0.05 1.31 0.12 43.21 4.15 0.16 0.03
30-100 3.61 0.10 0.54 0.04 34.70 7.87 0.04 0.01 ALANDA WHARF
3 0-30 3.80 0.04 1.43 0.06 53.88 5.40 0.43 0.18
30-100 3.76 0.05 0.80 0.05 15.04 2.07 0.09 0.01
19
Table 6 Distribution of H, C, and Al at two depth classes at different sites
Site Depth / cm H (cmol/kg) SE C (%) SE Al (cmol/kg) SE
20
Overall, the lower soil class had a significantly higher bulk density than the upper soil class. However, only sites at Alanda Wharf 3, Kofi Jaman 3, Kofi Jaman 2, Alanda 1 and Ebonloa 1 recorded significantly higher bulk density in the lower soil class than the upper soil class. The other sites generally showed a similar bulk density between the depth classes. Figure 12 shows soil bulk density variation at two depths at different sites.
21
Table 7 Soil bulk density distribution at two depth classes at different sites
Site Depth / cm BD SE Site Depth / cm BD SE
Generally, the majority of sites had a sandy or sandy-loam texture, but clay was also evident at some of the sites. The Ebonloa sites were found to be of a sandy loam texture, and the Aloapoke, Twenen and Alanda Wharf sites were sand. Table 8 shows the soil texture distribution across the study area.
Table 8 Soil textural classes at different sites in the study area
22
SITE SAND SILT CLAY TEXTURE CLASS
% % % %
EBONLOA 1 76.47 13.73 9.80 SANDY LOAM
ALANDA WHARF 2 94.12 1.96 3.92 SAND ALANDA WHARF 3 80.39 9.80 9.80 LOAMY SAND
ALANDA 3 56.86 7.84 35.29 SANDY CLAY ALANDA 4 76.47 7.84 15.69 SANDY LOAM
EBONLOA 2 76.47 9.80 13.73 SANDY LOAM EBONLOA 4 76.47 11.76 11.76 SANDY LOAM
3.2.3 SOIL ORGANIC CARBON STOCKS
There was a significant difference in soil organic carbon stocks between the two depth classes (F = 26.97, df = 1, P = ˂0.001), as well as the interaction between depth and site (F = 1.86, df = 16, P = ˂0.041).
Overall, the lower soil depth class (30-100 cm) had a significantly higher soil carbon stock than the upper soil class (0-30 cm). At specific sites, however, the difference was only significant for Twenen 1, Kofi Jaman 3 and Alanda 1, where the soil organic carbon stocks were significantly higher at the lower depth class compared to the upper depth class. All other sites were generally found to have similar soil carbon stocks between the depth classes. Figure 13 shows soil organic carbon variation at two depths at different sites.
23
Table 9 Soil organic carbon stock distribution at two depth classes at different sites
Site
3.2.4. EFFECTS OF HYDROLOGY ON DISTRIBUTION OF SOIL NUTRIENTS
At the 0 – 30 depth class, pH, P and K remained generally unchanged between the seasonally flooded and permanently flooded areas. However, N, H, C and Al were higher at the
permanently flooded areas, while soil bulk density and carbon stocks were observed to be generally higher at the seasonally flooded areas.
24
Figure 14 Effects of hydrology on the variation of pH, N, K, Al, H, C content, and bulk density at two depth classes in seasonally and permanently flooded sites
Figure 15 Effects of hydrology on the variation of P and C stocks at two depth classes in seasonally and permanently flooded sites
3.2.5. EFFECTS OF DEGRADATION AND DEFORESTATION ON DISTRIBUTION OF SOIL NUTRIENTS
25
With regard to the 30 – 100 cm depth class, pH was generally constant for all the areas; however, N was highest at the intact area and lowest at the degraded area, with K being marginally higher at the deforested site. Al was highest at the deforested site, followed by the intact area, with the degraded area having the least Al concentration. But C content and carbon stocks were highest at the deforested site followed by the intact area, with the degraded site recording the lowest concentration. Figures 16 and 17 show effects of site condition on distribution of soil nutrients.
Figure 16 Effect of site condition on distribution of pH, N content, K, Al, H, C content and bulk density.
26
4.0
DISCUSSION
4.1 BIOMASS CARBON STOCKS
Contrary to most other tropical forests, peat swamp forests are generally characterized by the fact that aboveground carbon does not form the bulk of the total ecosystem carbon pool, since an important portion of the carbon is stored in the peat soil (Joosten, 2009). The results of this study suggest that the peats in Ghana exhibits similar characteristics and functions in terms of carbon storage and sequestration as globally known peat forests in South East Asia. Though logging in the study sites is not as intensive as commercial selective logging, its impact in reducing carbon stocks provides a useful indicators that these small scale illegal logging activities could be detrimental to carbon sequestration and other ecosystem functions that the peat swamp forests play in Ghana. For instance, degradation reduced soil carbon more than even deforestation. In terms of above and below ground stocks, the conversion of peat swamp forests to maize farms resulted in a decline of aboveground carbon stocks from 114.29 ± 15.92 to 20.26 ± 12.12 MgC/ha, and that of belowground from 22.86 ± 3.18 to 4.09 ± 2.42 MgC/ha, which translates into a loss of 112.6 MgC/ha, while degradation caused the loss of 51.63 MgC/ha. However, it also appears that soil carbon
Though degradation and deforestation of these peat swamp forests was not taking place on a large scale, it is instructive to understand that most upland and less swampy areas in
proximity to the peat swamp forests have already been converted to other land use types, such as food crop farms, fallows, and tree-crop plantations (oil palm, coconut, rubber), leaving the swamp forests as the only remaining intact forest. The inhabitants of these areas appear to be less inclined to convert the wetlands to other land use types, perhaps because of the labor required. However, discussions with some farmers indicated that there were attempts to convert some swamp forests to rice farms in the 1980s, but that these efforts were
unsuccessful due to difficulties with birds and other animals which fed on the budding grains and flowers.
Illegal, small scale logging is a major cause of degradation in the area. If unchecked, this could lead to a steady decline in the tree density of the swamp forests with a resultant effect on biomass and soil organic carbon. Importantly, most of these wetlands are community owned, thus outside of government control. There is evidence to suggest that most of the local governance systems that have kept these areas intact are increasingly losing their relevance; thus, exploitation is likely to increase, which could serve as a major threat to the peat swamp forest and its functional role.
Aboveground biomass also differs between natural peat swamp forest types, depending on their floristic composition and forest structure (Anderson, 1961). The occurrence of different forest types depends on the hydrology, chemistry and organic matter content of the peat, but these factors are in turn determined by the vegetation.
Figure 4 showed that the aboveground and belowground carbon stocks of the seasonally flooded areas are higher than that of the permanently flooded areas. This suggests the role of the hydrological condition and changing seasons on biomass. It is possible that the seasonally flooded areas have floristic composition and forest structure which is very much different from the permanently flooded areas. Indeed, the tree density at the seasonally flooded areas was higher than that of the permanently flooded areas. The higher tree density in the
27
rainy season; hence, recruitment could be higher, which could have an impact on the basal area.
Figure 18 Exploitation of swamp forest species for lumber and fuelwood.
4.2 SPECIES DIVERSITY INDICES
This swamp forest is a unique land cover type which is characterized by species specially adapted to swampy areas as evidenced by special adaptations in their root systems and physiology which enable the species to cope with the anaerobic conditions of the swamp. However, the hydrology of the landscape is such that some areas are seasonally flooded with water, while other areas are permanently inundated. The seasonally flooded areas are only fully covered with water during the rainy season (June to November), and during the dry season it assumes the nature of a terrestrial forest, with litter and twigs on the forest floor.
One of the indicators for assessing plant species diversity is the use of index of diversity, namely Shannon-Weaver diversity (H')(Shannon and Weaver, 1949; Ludwig and
Reynolds,1988)1.
1 Index H' denotes the number of species, number of individuals, and distribution of individuals for each plant
28
Though the seasonally flooded site recorded the highest number of individual species, with the permanently flooded recording the least, the latter was the most diverse (H) because it had species which were relatively evenly distributed. This could be due to the fact that the
seasonally flooded areas have many individuals of a particular species, with only a few individuals of other species. For instance, Raphia hookeri was only found in the seasonally
flooded area and had the highest frequency (1101 individual count) of all species encountered. Hence, the dominance of this species likely affected the diversity index,
resulting in the lower index value of the seasonally flooded, despite it being the most species rich. The diversity index values recorded can be classified as low, based on the classification of Istimo et al (2009), because only specialized species can survive in this unique type of landscape, which is only found in a few areas of the country.
As already noted, two species could not be identified and were sent to the University of Ghana herbarium for confirmation of their status and identity. It is possible that this unique habitat type harbours species which are endemic to such sites and therefore cannot be found in other parts of the country. Personal communication with the botanist engaged for the species identification showed that many of the species identified cannot be found in other ecological zones in the country.
29
Figure 20 Boles of the two unidentified species showing bark slashes
4.3 SOIL CHEMICAL AND PHYSICAL PROPERTY DYNAMICS
4.3.1 SOIL CHEMICAL PROPERTIES
It was evident that the pH and H of the soil was fairly constant from the upper depth class to the lower depth class, whereas Al was higher at the lower depth compared to the upper depth. These H and Al parameters are strongly associated with acidic conditions. Studies have shown that high concentrations of hydrogen ions (caused by the low pH of these peat soils at levels of pH 3.0-4.0) means that toxic components damaging the plant growth become more soluble. Toxic levels of manganese, iron, aluminium, phenols and tannins are common in the acid peat soils. Soil pH, therefore, is probably the single most important management factor controlling the amount of Al in the soil solution (Ismawi et al., 2012). Though these
parameters could have inhibitory effects on plant growth, it is possible that plant species which are found in the Amanzule Wetlands are well adapted to these site conditions. As one might predict, the major nutrients (N,P,K) and carbon content were higher in the upper soil depth class than the lower soil depth class. This indicates that these soil nutrients are within the reach of the roots. Satrio et. al. (2009) reported that total P was higher in peat soil because peat is an organic soil which contains large amount of decomposed organic matter. This could therefore account for the high levels of P recorded in the study area. However, Golchin et. al. (1995) stated that as the peat land is tempered with, decrease in organic matter leads to decrease in P.
Results of the study also indicated that soil nutrients are not uniformly distributed across the entire Amanzule Wetlands, but that there is significant variability which could be due to differences in biodiversity, which contribute different organic materials to the soil, as well as anthropogenic activities.
4.3.2 SOIL PHYSICAL PROPERTIES (BULK DENSITY AND TEXTURE) DYNAMICS
Bulk density reflects the soil’s ability to provide structural support, water and solute movement, as well as soil aeration. It is dependent on soil texture and the density of soil minerals (sand, silt, and clay) and organic matter particles, as well as their packing
30
structure have higher pore space and lower bulk density compared to sandy soils (USDA, 2008).
Soil bulk density was significantly higher at the lower depth class than the upper depth class. According a USDA (2008) report, soil bulk density typically increases with soil depth since subsurface layers have reduced organic matter, aggregation, and root penetration compared to surface layers and therefore contain less pore space. Subsurface layers are also subject to the compacting weight of the soil above them.
Additionally, soils are made up of sand, silt and clay. The difference between them is in the size of the soil particle (sand particles are larger than silt and silt particles are larger than clay), in their ability to hold nutrients and in their ability to hold water. Generally clay and silt hold nutrients and water better than sand. Soil can also contain organic matter, such as decomposed leaves or peat moss. Since sand does not hold water and nutrients very well, it should be noted that with most of the sites having either sand or sandy-loam texture, fertility could be low.
Soil type also bears an influence on the flooding condition of an area (Leonor and Pablo, 1998). Sandy loams are permeable, but have a low porosity as the grains are of many different sizes and therefore subjected to rhombic packing, in which the grains fill spaces.
Clay loams tend not to be permeable and have a higher porosity as the grains are of similar shape and subject to cubic packing allowing water to move between the grains (Venugopal et al., 2008).
4.3.3 SOIL ORGANIC CARBON STOCKS DYNAMICS
Soil organic carbon stocks were significantly higher at the lower soil depth than the upper soil depth, following the bulk density trend. It is also possible that the dimension of the depth classes could have contributed to the disparity in the figures. The upper soil depth was 30 cm, while that of the lower depth class was 70 cm.
4.4 EFFECTS OF HYDROLOGY ON DISTRIBUTION OF SOIL
NUTRIENTS
Many biogeochemical processes are unique in wetlands due to waterlogging and extensive accumulation of soil organic matter (Bridgham and Richardson, 1993). Hydrology is the dominant variable controlling ecosystem dynamics, influencing such diverse factors as redox potential, soil oxygen content, pH, nutrient and carbon cycling, community composition and wetland development (Day et al., 1988; Bridgham et al., 1991). Important attributes of the hydro-period are the frequency, timing, depth and duration of flooding or waterlogging (Bridgham and Richardson, 1993). Differences in hydrology among wetlands and ultimately their position on the landscape are often the underlying cause of differences in soil chemistry (Bridgham and Richardson, 1993).
Similarly as reported by Nye and Greenland (1960) and Cunningham (1963), soil organic matter declines rapidly after soil is exposed due to clearing activities. Soil organic matter begins to decline as soil temperature increases when exposed to sunlight due to loss of
canopy cover and shifts the equilibrium between accumulation and decomposition. When this condition occurs, decomposition rate will increase because of rapid activities of soil
31
carbon most utilized by microorganism and consequently change the value of total carbon in the peat soil.
Contrary to existing literature, this study found nutrients to be higher at the permanently flooded areas, with the seasonally flooded areas having the least, while in some instances soil nutrients remained generally unchanged between the permanently and seasonally flooded areas. One possible explanation is that samples were taken at the end of the dry season, when soil nutrients might have been at their lowest, but that these values should increase with flooding during the rainy season. According to Bridgham and Richardson (1993), differences in hydrology among wetlands and ultimately their position on the landscape are often the underlying cause of differences in soil chemistry. While this study did stratify site selection based on hydrology, landscape position was not considered.
4.5 EFFECTS OF DEGRADATION AND DEFORESTATION ON
DISTRIBUTION OF SOIL NUTRIENTS
Generally forest disturbances result in a high residue load which will decompose and contribute organic materials to the soil. This causes an increase in specific soil nutrients through decomposition.
This study found that soil nutrients were variably distributed within the Amanzule Wetlands. Though anthropogenic activities such as deforestation or conversion of some parts of the swamp forests to agriculture, as well as degradation through small-scale logging contributed to changes in the distribution of soil nutrients in the landscape, variability of soil nutrients was also evident within the intact areas that were sampled. For instance, at the 0 – 30 cm depth class, pH and bulk density were marginally higher at the degraded sites, but remained fairly unchanged at the intact and deforested areas. Given that the intact areas were stratified according to seasonal and permanent flooding, it is possible that hydrology could have confounded the results, given that hydrology had an impact on the distribution of soil nutrients.
32
Figure 21 Hydrological condition of the landscape. 1 is permanently flooded, and 2 is seasonally flooded.
4.6. EFFECTS OF HYDROLOGY ON TOTAL BIOMASS CARBON
STOCKS
Figure 16 clearly demonstrates that the hydrology of the landscape (permanent and seasonal inundation) had an impact on tree biomass in the landscape. The seasonally flooded area had higher total carbon stocks, with aboveground being the dominant pool. However, the soil pool in the permanently flooded was higher than that of the seasonally flooded.
From the species diversity analysis, it was observed that the seasonally flooded had more species and a higher number of individuals than the permanently flooded areas, factors which could account for the high carbon stocks in the seasonally flooded area.
The permanently flooded plots, on the other hand, had higher soil carbon stocks than the seasonally flooded areas. This could be due to the fact that the anaerobic conditions in the permanently flooded area created a condition for carbon to accumulate, while at the
seasonally flooded area, decomposition through microbial processes, high temperatures and other factors could have resulted in the loss of carbon stocks.
33
Figure 22 Effects of hydrology on total carbon stocks
4.7. EFFECTS OF DEGRADATION AND DEFORESTATION ON
DISTRIBUTION OF TOTAL BIOMASS CARBON STOCKS
Overall, intact forest plots had the highest total carbon stocks, followed by the deforested area, and then the degraded plots. When broken down according to the different carbon pools, the intact sites recorded the highest above and below ground biomass levels, followed by the degraded sites. As a result of anthropogenic activities, the deforested sites recorded the lowest above and below ground biomass carbon stocks because most of the sites wereconverted to agricultural crops (maize and cassava).
34
Figure 23 Effects of site condition on total carbon stocks
Figure 24 Site conditions in the landscape. 1 is an intact area, 2 is a degraded area and 3 is a deforested area.
35
5.0
CONCLUSIONS AND RECOMMENDATIONS
5.1. CONCLUSIONS
The data generated shows that the peat swamp forest in the Amanzule Wetlands is a unique and complex landscape that is affected by varying hydrological regimes and a diversity of potentially endemic or niche-specific tree species. It is also a place that appears to be increasingly coming under threat, and subsequently impacted by anthropogenic activities; specifically, conversion to food crop farms or degradation as a result of firewood harvesting or small-scale logging. While the biodiversity value of the Amanzule Wetlands has been widely recognized by numerous national and international NGOs and research institutions over the years, this study is the first effort to quantify its value from a climate change mitigation perspective.
As with peat forest swamps globally, the Amanzule Wetlands and Ankobra River basin contain high carbon stocks, primarily in the above ground and soil carbon pools. Biomass carbon stocks were highest in the intact peat swamp forest areas, followed by the degraded plots. The deforested areas recorded the lowest biomass carbon stocks in the landscape. This underlines the importance of protecting this forest type and its carbon stock. However, it is also interesting to confirm that significant carbon stores are located within the soil. While deforestation might lead to short term gains in soil carbon stocks, one can also assume that over time, if converted plots are put under agriculture or exposed to a change in conditions that these carbon stocks could rapidly be lost. Therefore, the value of conserving the peat swamp forest from a climate perspective applies to both the above ground carbon as well as the soil carbon stocks.
The biodiversity benefits of protecting the wetlands are further highlighted by this study, suggesting that conservation of both permanently flooded and seasonally flooded areas is critical due to significant differences in diversity (Shannon-Weiner index) and species richness. In addition, the species that were identified are clearly adapted to the waterlogged conditions, and therefore are relatively rare in Ghana and across the sub-region; two of the species may even be new species which are endemic to this type of terrain.
One interesting aspect coming out of the soil nutrient analysis is that while most nutrients are located in the top 30 cm of the soil (making them available for root uptake) the actual carbon stocks and bulk density of the soil increased with depth. Therefore, it is possible that if threats increase or portions of the landscape will inevitably be converted to agricultural land-uses, then a climate smart agriculture play / soil carbon option could be pursued in which appropriate crops and low-till activities would enable the conservation of these significant soil carbon stocks in the lower soil depths (30-100 cm).
5.2. RECOMMENDATIONS
1. Further stratification of the landscape: Results of the study clearly show that
hydrology and site condition (intact forest, degraded, deforested) significantly impact nutrient and biomass dynamics. Therefore, any future research efforts should use a stratification strategy that prioritizes site selection across permanently flooded and seasonally flooded lands, followed by other land-use variables of interest.
36
converted to other land use types. Such data will aid in future decision making about potential conservation and/or management strategies, including the potential for a carbon finance project (establishing REDD+ project baseline, soil carbon options, climate-smart agriculture options).
3. Establishment of permanent monitoring plots: There is need for the establishment of Permanent Sample Plots (PSPs) in different hydrological and disturbance regimes. This would provide long term information on total swamp forest carbon sequestration as well as nutrient and biomass dynamics (rates of recruitment, growth and mortality); such information is crucial for judging sustainable exploitation rates of a fragile ecosystem or assessing other management and use options.
4. Measurement of fuelwood going out of the system: There is the need to account for the actual amount of biomass that is being lost through fuelwood extraction / logging in order to clarify the amount of residue that is decomposing into the soil. This would provide a better understanding of carbon cycling within the system as a result of anthropogenic activities. It would also help to inform potential management strategies, including REDD+ feasibility.
37
REFERENCES
Bouyoucos, G. J. 1962. Hydrometer method improved for making particle size analyses of soils. Agronomy Journal 53: 464-465.
Brammer, H. 1962. Soils: in Agriculture and Landuse in Ghana. J.B Wills (ed)., Oxford University Press London , Accra, New York. Pp 88-126.
Bray, R.H. and L.T. Kurtz,. 1945. Determination of total, organic and available forms of phosphorus in soils. Soil Sci., 59: 39-46.
Bridgham, S.D., Pastor, J., Janssens, J.A., Chapin, C. & Malterer, T.J. 1996. Multiple limiting gradients in peatlands: A call for a new paradigm. Wetlands Nye and Greenland (1960).
Chapman, H. D and Pratt, P. F. 1961. Methods for analysis of soils, plants and waters, California: University of California. pp. 170-179. Chave et al (2005).
Day Jr., J.W., Conner,W.H., Ley-Lou, F., Day, R.H., Navarro, A.M.,1987. The productivity and composition of mangrove forests,Laguna de Terminos, Mexico. Aquatic Botany 27, 267e284.
Golchin A, Clarke P, Oades JM, Skjemstad JO (1995). The effects of cultivation on the composition of organic matter and structural stability of soils. Aus. J. Soil. Res., 33: 975-99.
Hergoualc’h, K. & Verchot, V., (2011). Stocks and fluxes of carbon associated with land use change in Southeast Asian tropical peatlands: A review. Global Biogeochemical Cycles, 25. Doi:10.1029/2009GB003718.
Hergoualc’h, K. & Verchot, V., (2011). Stocks and fluxes of carbon associated with land use change in Southeast Asian tropical peatlands: A review. Global Biogeochemical Cycles, 25. Doi:10.1029/2009GB003718.
Hirano, T., Jauhiainen, J., Inoue, T. & Takahashi, H. (2009). Controls on the Carbon Balance of Tropical Peatlands. Ecosystems, 12, 873-887.
Hirano, T., Segah, H., Harada, T., Limin, S., June, T., Hirata, R., & Osaki, M. (2007). Carbon dioxide balance of a tropical peat swamp forest in Kalimantan, Indonesia. Global Change Biology, 13, 412-425.
Hooijer, A., Page, S. E., Jauhiainen, J., Lee, W. A., Idris, A., & Anshari, G. (2011). Land subsidence and carbon loss in plantations on tropical peatland: reducing uncertainty and implications for emission reduction options. Biogeosciences Discussions. Hooijer, A., Page, S., Canadell, J. G., Silvius, M., Kwadijk, J., Wösten, H., & Jauhiainen, J.
(2010). Current and future CO2 emissions from drained peatlands in Southeast Asia. Biogeosciences, 7, 1505-1514.
Hooijer, A., Page, S., Canadell, J. G., Silvius, M., Kwadijk, J., Wösten, H., & Jauhiainen, J. (2010). Current and future CO2 emissions from drained peatlands in Southeast Asia. Biogeosciences, 7, 1505-1514.
38
Ismawi, S. M., Gandaseca, S. and Ahmed, O. H. 2012. Effects of deforestation on soil major macro-nutrient and other selected chemical properties of secondary tropical peat swamp forest. International Journal of Physical Sciences Vol. 7(14), pp. 2225 – 2228. Istomo. 2006. Kandungan Fosfor dan Kalsium pada tanah dan Biomassa Hutan Rawa gambut (Studi kasus di Wilayah HPH PT. Diamond Raya Timber, Riau). Journal Management Hutan Tropika,Vol.XII,No. 3, September-December 2006.
Istomo., Wibowo, C and Wibisono, I. T. C. 2009. Plant diversity and biomass content in relation to wise use of tropical peat land. Proceedings of Bogor Symposium and Workshop on Tropical Peatland Management, Bogor, Indonesia.
Jauhiainen, J., Limin, S., Silvennoinen, H. & Vasander, H. (2008). Carbon dioxide and methane fluxes in drained tropical peat before and after hydrological restoration. Ecology, 89, 3503–3514.
Jauhiainen, J., Silvennoinen, H., Hämäläinen, R., Kusin, K., Limin, S., Raison, R. J., & Vasander, H. (2011). Nitrous oxide fluxes from tropical peat with different
disturbance history and management. Biogeosciences Discussions, 8, pp.5423–5450. Jauhiainen, J., Takahashi, H., Juha, Heikkinen, E. P., Martikainen, P. J., & Vasander, H.
(2005). Carbon fluxes from a tropical peat swamp forest floor. Global Change Biology, 11, 1788-1797.
Jauhiainen, J., Vasander, H., Jaya, A., Takashi, I., Heikkinen, J., & Martiinen, P. (2004). Carbon balance in managed tropical peat in Central Kalimantan, Indonesia. In J. Päivänen, (Ed.), Proceedings of the 12th International Peat Congress. Tampere, Finland.
Jauhiainen, J., Vasander, H., Rieley, J., & Page, S. E. (2010). Tropical Peat Carbon Gas Interaction: Technical report 2. Leicester, United Kingdom: University of Leicester. Joosten, H. 2010. The Global Peatland CO2 Picture. Wetlands International, Ede, 33 pp Ludwig, J.A. and J.F. Reynold. 1988. Statistical Ecology : A Primer on Methods and
Computing. JohnWiley&Sons. New York.
Mc Morrow, J and Talip, M. A. 2001. Decline of forest area in Sabah, Malaysia: Relationship to state policies, land code and land capability. Global Environmental Change-Human and Policy Diemensions, 11, 217-230.
Mclean, E. O. 1982. Soil pH and lime requirement. In: Page AL, Miller RH, Keeney DR (eds). Methods of Soil Analysis. Part 2. 2nd ed. Agron. Monogr.9. ASA and SSSA. Madison, WI. pp 199-224. Walkley and Black (1934)
Murdiyarso, D., Hergoualc’h, K and Verchot, L. V. 2010. Opportunities for reducing
greenhouse gas emissions in tropical peatlands. PNAS. Vol 107: 46. PP 19655-19660. Page, S. E., Rieley, J. O. & Banks, C. J. (2011). Global and regional importance of the
tropical peatlands carbon pool. Global Change Biology, 17, 798-818.
Page, S. E., Wüst, R. & Banks, C. (2010). Past and present carbon accumulation and loss in Southeast Asian peatlands. PAGES News, 18(1), 25-26.
39
Raupach, M.R. & Canadell, J.G. (2010). Carbon and the Anthropocene. Current Opinion in Environmental Sustainability, 2, 2010-218.
Rydin, H and Jeeglum, E. 2006. The biology of peatlands. Oxford University Press. Satrio AE, GandasecaS, Ahmed OH, Majid NMA (2009a). Effect of precipitation
fluctuation on soil carbon storage of a tropical peat swamp forest. Am. J. Appl. Sci., 6: 1484-1488.
Satrio AE, Gandaseca S, Ahmed OH, Majid NMA (2009b). Effect of Skidding
Operations on Soil Carbon Storage of a Tropical Peat Swamp Forest. Am. J. Appl. Sci., 5: 722-726.
Shannon, C. E. (1948) A mathematical theory of communication. The Bell System Technical Journal, 27, 379-423 and 623-656.
Takahashi, H., Simada, S., Ibie, B., Usup, A., Yudha, & Limin, S. H. (2002, August). Annual changes of water balance and a drought index in a tropical peat swamp forest of Central Kalimantan, Indonesia. In Rieley, J. O. & Page S. E. (Ed.), Proceedings of the International Symposium on Tropical Peatlands. Jakarta, Indonesia.
USDA, 2008. Soil quality indicators. USDA Natural Resource Conservation Service.
Veerwer, C. C and Van der Meer, P.J. 2010. Carbon pools in tropical peat forests – towards a reference value for forest biomass carbon in a relatively undisturbed peat forest in southeast Asia. Wagenigen, Alterra, Alterra report, 2108. 64 pp.
Venugopal, P. D., Huston, G., Pelkey, N. W., and Bhalla, R. S. 2008. Restoration of Mangrove Habitats. In Studies on Vulnerability and Habitat Restoration along the Coromandel Coast., eds. Bhalla, R. S., Ram, S., and V. Srinivas. 1st ed. Pondicherry, India.
Wösten, J. H. M., Clymans, E., Page, S., Rieley, J., & Limin, S. (2008). Peat-water