A Systematic Literature Review on
Fault Prediction Performance
in Software Engineering
Tracy Hall, Sarah Beecham, David Bowes, David Gray, and Steve Counsell
Abstract—Background: The accurate prediction of where faults are likely to occur in code can help direct test effort, reduce costs, and improve the quality of software.Objective: We investigate how the context of models, the independent variables used, and the modeling techniques applied influence the performance of fault prediction models.Method:We used a systematic literature review to identify 208 fault prediction studies published from January 2000 to December 2010. We synthesize the quantitative and qualitative results of 36 studies which report sufficient contextual and methodological information according to the criteria we develop and apply. Results:The models that perform well tend to be based on simple modeling techniques such as Naive Bayes or Logistic Regression. Combinations of independent variables have been used by models that perform well. Feature selection has been applied to these combinations when models are performing particularly well.Conclusion:The methodology used to build models seems to be influential to predictive performance. Although there are a set of fault prediction studies in which confidence is possible, more studies are needed that use a reliable methodology and which report their context, methodology, and performance comprehensively.
Index Terms—Systematic literature review, software fault prediction
Ç
1
I
NTRODUCTIONT
HISSystematic Literature Review (SLR) aims to identify and analyze the models used to predict faults in source code in 208 studies published between January 2000 and December 2010. Our analysis investigates how model performance is affected by the context in which the model was developed, the independent variables used in the model, and the technique on which the model was built. Our results enable researchers to develop prediction models based on best knowledge and practice across many previous studies. Our results also help practitioners to make effective decisions on prediction models most suited to their context.Fault1 prediction modeling is an important area of research and the subject of many previous studies. These studies typically produce fault prediction models which allow software engineers to focus development activities on fault-prone code, thereby improving software quality and
making better use of resources. The many fault prediction models published are complex and disparate and no up-to-date comprehensive picture of the current state of fault prediction exists. Two previous reviews of the area have been performed in [1] and [2].2 Our review differs from these reviews in the following ways:
. Timeframes. Our review is the most contemporary
because it includes studies published from 2000-2010. Fenton and Neil conducted a critical review of software fault prediction research up to 1999 [1]. Catal and Diri’s [2] review covers work published between 1990 and 2007.
. Systematic approach. We follow Kitchenham and
Charters [3] original and rigorous procedures for conducting systematic reviews. Catal and Diri did not report on how they sourced their studies, stating that they adapted Jørgensen and Shepperd’s [4] methodology. Fenton and Neil did not apply the systematic approach introduced by Kitchenham and Charters [3] as their study was published well before these guidelines were produced.
. Comprehensiveness.We do not rely on search engines
alone and, unlike Catal and Diri, we read through relevant journals and conferences paper-by-paper. As a result, we analyzed many more papers.
. Analysis. We provide a more detailed analysis of
each paper. Catal and Diri focused on the context of studies, including: where papers were published, year of publication, types of metrics used, datasets used, and modeling approach. In addition, we report
. T. Hall and S. Counsell are with the Department of Information Systems
and Computing, Brunel University, Uxbridge, Middlesex UB8 3PH, United Kingdom. E-mail: {tracy.hall, steve.counsell}@brunel.ac.uk.
. S. Beecham is with Lero—The Irish Software Engineering Research Centre,
University of Limerick, Tierney Building, Limerick, Ireland. E-mail: [email protected].
. D. Bowes and D. Gray are with the Science and Technology Research
Institute, University of Hertfordshire, Hatfield, Hertfordshire AL10 9AB, United Kingdom. E-mail: {d.h.bowes, d.gray}@herts.ac.uk.
Manuscript received 21 Oct. 2010; revised 10 July 2011; accepted 13 Sept. 2011; published online 30 Sept. 2011.
Recommended for acceptance by D. Sjøberg.
For information on obtaining reprints of this article, please send e-mail to: [email protected], and reference IEEECS Log Number TSE-2010-10-0312. Digital Object Identifier no. 10.1109/TSE.2011.103.
1. The term “fault” is used interchangeably in this study with the terms “defect” or “bug” to mean a static fault in software code. It does not denote a “failure” (i.e., the possible result of a fault occurrence).
2. Note that two referencing styles are used throughout this paper; [ref#] refers to papers in the main reference list while [Sref#] refers to papers in the separate systematic literature review list, located before the main reference list.
on the performance of models and synthesize the findings of studies.
We make four significant contributions by presenting:
1. A set of 208 studies addressing fault prediction in software engineering from January 2000 to December 2010. Researchers can use these studies as the basis of future investigations into fault prediction.
2. A subset of 36 fault prediction studies which report sufficient contextual and methodological detail to enable these studies to be reliably analyzed by other researchers and evaluated by model users planning to select an appropriate model for their context. 3. A set of criteria to assess that sufficient contextual
and methodological detail is reported in fault prediction studies. We have used these criteria to identify the 36 studies mentioned above. They can also be used to guide other researchers to build credible new models that are understandable, usable, replicable, and in which researchers and users can have a basic level of confidence. These criteria could also be used to guide journal and conference reviewers in determining that a fault prediction paper has adequately reported a study. 4. A synthesis of the current state of the art in software
fault prediction as reported in the 36 studies satisfying our assessment criteria. This synthesis is based on extracting and combining: qualitative information on the main findings reported by studies, quantitative data on the performance of these studies, detailed quantitative analysis of the 206 models (or model variants) reported in 19 studies which report (or we can calculate from what is reported) precision, recall, and f-measure perfor-mance data.
This paper is organized as follows: In the next section, we present our systematic literature review methodology. In Section 3, we present our criteria developed to assess whether or not a study reports sufficient contextual and methodological detail to enable us to synthesize a particular study. Section 4 shows the results of applying our assessment criteria to 208 studies. Section 5 reports the results of extracting data from the 36 studies which satisfy
our assessment criteria. Section 6 synthesizes our results and Section 7 discusses the methodological issues asso-ciated with fault prediction studies. Section 8 identifies the threats to validity of this study. Finally, in Section 9 we summarize and present our conclusions.
2
M
ETHODOLOGYWe take a systematic approach to reviewing the literature on the prediction of faults in code. Systematic literature reviews are well established in medical research and increasingly in software engineering. We follow the systematic literature review approach identified by Kitch-enham and Charters [3].
2.1 Research Questions
The aim of this systematic literature review is to analyze the models used to predict faults in source code. Our analysis is based on the research questions in Table 1.
2.2 Inclusion Criteria
To be included in this review, a study must be reported in a paper published in English as either a journal paper or conference proceedings. The criteria for studies to be included in our SLR are based on the inclusion and exclusion criteria presented in Table 2.
Before accepting a paper into the review, we excluded repeated studies. If the same study appeared in several publications, we included only the most comprehensive or most recent.
2.3 Identification of Papers
Included papers were published between January 2000 and December 2010. Our searches for papers were completed at the end of May 2011 and it is therefore unlikely that we missed any papers published in our time period as a result of publication time lags. There were four elements to our searches:
1. Key word searching using the search engines: ACM Digital Library, IEEExplore, and the ISI Web of Science. These search engines covered the vast TABLE 1
majority of software engineering publications and the search string we used is given in Appendix A. 2. An issue-by-issue manual reading of paper titles in
relevant journals and conferences. The journals and conferences searched are shown in Appendix B. These were chosen as highly relevant software engineering publications found previously to be good sources of software engineering research [4]. 3. A manual search for publications from key authors
using DBLP.3These authors were selected as appear-ing most frequently in our list of papers: Khoshgof-taar, Menzies, Nagappan, Ostrand, and Weyuker. 4. The identification of papers using references from
included studies.
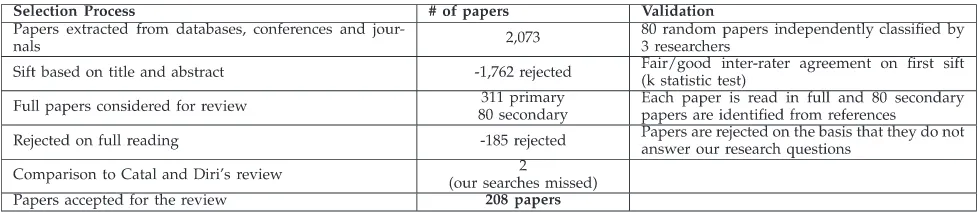
Table 3 shows that our initial searches elicited 2,073 papers. The title and abstract of each was evaluated and 1,762 were rejected as not relevant to fault prediction. This process was validated using a randomly selected 80 papers from the initial set of 2,073. Three researchers separately interpreted and applied the inclusion and exclusion criteria to the 80 papers. Pairwise interrater reliability was measured across the three sets of decisions to get a fair/good agreement on the first iteration of this process. Based on the disagreements, we clarified our inclusion and exclusion criteria. A second iteration resulted in 100 percent agreement between the three researchers.
We read the remaining 311 papers in full. This resulted in a further 178 papers being rejected. An additional 80 secondary papers were identified from references and, after being read in full, accepted into the included set. We also included two extra papers from Catal and Diri’s [2] review which overlapped our timeframe. Our initial searches omitted these two of Catal and Diri’s papers as their search terms included the word “quality.” We did not include this word in our searches as it generates a very high false positive rate. This process resulted in the 208 papers included in this review.
3
A
SSESSING THES
UITABILITY OFP
APERS FORS
YNTHESISThe previous section explained how we included papers which both answered our research questions and satisfied our inclusion criteria. This section describes how we identified a subset of those papers as suitable from which to extract data and synthesize an overall picture of fault prediction in software engineering. We then describe the extraction and synthesis process.
3.1 The Assessment Criteria
Our approach to identifying papers suitable for synthesis is motivated by Kitchenham and Charter’s [3] notion of a quality check. Our assessment is focused specifically on identifying only papers reporting sufficient information to allow synthesis across studies in terms of answering our research questions. To allow this, a basic set of information must be reported in papers. Without this it is difficult to properly understand what has been done in a study and equally difficult to adequately contextualize the findings reported by a study. We have developed and applied a set of criteria focused on ensuring sufficient contextual and methodological information is reported in fault prediction studies. Our criteria are organized into four phases described below.
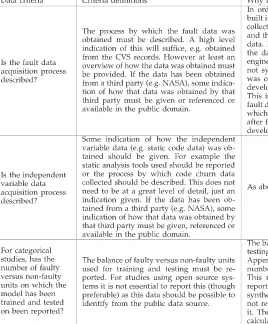
Phase 1: Establishing that the study is a prediction study. In this SLR it is important that we consider only models which actually do some form of prediction. Some studies which seem to be reporting prediction models actually turn out to be doing very little prediction. Many of these types of studies report correlations between metrics and faults. Such studies only indicate the propensity for building a prediction model. Furthermore, a model is only doing any prediction if it is tested on unseen data (i.e., data that were not used during the training process) [S112]. To be considered a prediction model it must be trained and tested on different data [6]. Table 4 shows the criteria we apply to assess whether a study is actually a prediction study.
3. http://www.informatik.uni-trier.de/~ley/db/.
TABLE 3
Paper Selection and Validation Process TABLE 2
Table 4 shows that a study can pass this criterion as long as they have separated their training and testing data. There are many ways in which this separation can be done. Holdout is probably the simplest approach, where the original dataset is split into two groups comprising: {training set, test set}. The model is developed using the training set and its performance is then assessed on the test set. The weakness of this approach is that results can be biased because of the way the data have been split. A safer approach is oftenn-fold cross validation, where the data are split into n groups fg1. . .gng. Ten-fold cross validation is
very common, where the data are randomly split into 10 groups, and 10 experiments carried out. For each of these experiments, one of the groups is used as the testing set, and all others combined are used as the training set. Performance is then typically reported as an average across all 10 experiments. M-N fold cross validation adds another step by generating M different N-fold cross validations, which increases the reliability of the results and reduces problems due to the order of items in the training set.
Stratified cross validation is an improvement to this process, and keeps the distribution of faulty and nonfaulty data points approximately equal to the overall class distribution in each of the n bins. Although there are stronger and weaker techniques available to separate training and testing data, we have not made a judgment on this and have accepted any form of separation in this phase of assessment.
Phase 2: Ensuring sufficient contextual information is reported.
We check that basic contextual information is presented by studies to enable appropriate interpretation of findings. A lack of contextual data limits the user’s ability to: interpret a model’s performance, apply the model appro-priately, or repeat the study. For example, a model may have been built using legacy systems with many releases over a long time period and has been demonstrated to perform well on these systems. It may not then make sense to rely on this model for a new system where the code has only recently been developed. This is because the number and type of faults in a system are thought to change as a system evolves [S83]. If the maturity of the system on which the model was built is not reported, this severely limits a model user’s ability to understand the conditions in which the model performed well and to select this model specifically for legacy systems. In this situation the model could be applied to newly developed systems with disappointing predictive performance.
The contextual criteria we applied are shown in Table 5 and are adapted from the context checklist developed by Petersen and Wohlin [7]. Our context checklist also overlaps with the 40 project characteristics proposed by Zimmermann et al. [S208] as being relevant to understanding a project sufficiently for cross project model building (it was impractical for us to implement all 40 characteristics as none of our included studies report all 40).
Context data are particularly important in this SLR as it is used to answer Research Question 1 and interpret our overall findings on model performance. We only synthesize papers that report all the required context information as listed in Table 5. Note that studies reporting several models based on different datasets can pass the criteria in this phase if sufficient contextual data are reported for one or more of these models. In this case, data will only be extracted from the paper based on the properly contextua-lized model.
Phase 3: Establishing that sufficient model building informa-tion is reported.
For a study to be able to help us to answer our research questions it must report its basic model building elements. Without clear information about the independent and dependent variables used as well as the modeling techni-que, we cannot extract sufficient data to allow synthesis. Table 6 describes the criteria we apply.
Phase 4: Checking the model building data.
Data used are fundamental to the reliability of models. Table 7 presents the criteria we apply to ensure that studies report basic information on the data they used.
In addition to the criteria we applied in Phases 1 to 4, we also developed more stringent criteria that we did not apply. These additional criteria relate to the quality of the data used and the way in which predictive performance is measured. Although we initially intended to apply these, this was not tenable because the area is not sufficiently mature. Applying these criteria would have resulted in only a handful of studies being synthesized. We include these criteria in Appendix C as they identify further important criteria that future researchers should consider when building models.
3.2 Applying the Assessment Criteria
Our criteria have been applied to our included set of 208 fault prediction studies. This identified a subset of 36 finally included studies from which we extracted data and on which our synthesis is based. The initial set of 208 included papers was divided between the five authors. Each paper was assessed by two authors independently TABLE 4
TABLE 6 Model Building Criteria
(with each author being paired with at least three other authors). Each author applied the assessment criteria to between 70 and 80 papers. Any disagreements on the assessment outcome of a paper were discussed between the two authors and, where possible, agreement estab-lished between them. Agreement could not be reached by the two authors in 15 cases. These papers were then given to another member of the author team for moderation. The moderator made a final decision on the assessment outcome of that paper.
We applied our four phase assessment to all 208 included studies. The phases are applied sequentially. If a study does not satisfy all of the criteria in a phase, then the evaluation is stopped and no subsequent phases are applied to the study. This is to improve the efficiency of the process as there is no point in assessing subsequent criteria if the study has already failed the assessment. This does have the limitation that we did not collect information on how a paper performed in relation to all assessment criteria. So if a paper fails Phase 1, we have no information on how that paper would have performed in Phase 4.
This assessment process was piloted four times. Each pilot involved three of the authors applying the assessment to 10 included papers. The assessment process was refined as a result of each pilot.
We developed our own MySQL database system to manage this SLR. The system recorded full reference details
and references to pdfs for all papers we identified as needing to be read in full. The system maintained the status of those papers as well as providing an online process to support our assessments of 208 papers. The system collected data from all authors performing assessments. It also provided a moderation process to facilitate identifying and resolving disagreements between pairs of assessors. The system eased the administration of the assessment process and the analysis of assessment outcomes. All data that were extracted from the 36 papers which passed the assessment is also recorded on our system. An overview of the system is available from [9] and full details are available from the third author.
3.3 Extracting Data from Papers
Data addressing our three research questions was extracted from each of the 36 finally included studies which passed all assessment criteria. Our aim was to gather data that would allow us to analyze predictive performance within individual studies and across all studies. To facilitate this, three sets of data were extracted from each study:
1. Context data. Data showing the context of each study were extracted by one of the authors. This data give the context in terms of: the source of data studied and the maturity, size, application area, and programming language of the system(s) studied. TABLE 7
2. Qualitative data. Data related to our research questions were extracted from the findings and conclusions of each study. This was in terms of what the papers reported rather than on our own interpretation of their study. This data supplemen-ted our quantitative data to generate a rich picture of results within individual studies.
Two authors extracted qualitative data from all 36 studies. Each author extracted data indepen-dently and compared their findings to those of the other author. Disagreements and omissions were discussed within the pair and a final set of data agreed upon.
3. Quantitative data. Predictive performance data were extracted for every individual model (or model variant) reported in a study. The performance data we extracted varied according to whether the study reported their results via categorical or continuous dependent variables. Some studies reported both categorical and continuous results. We extracted only one of these sets of results, depending on the way in which the majority of results were presented by those studies. The following is an overview of how we extracted data from categorical and con-tinuous studies.
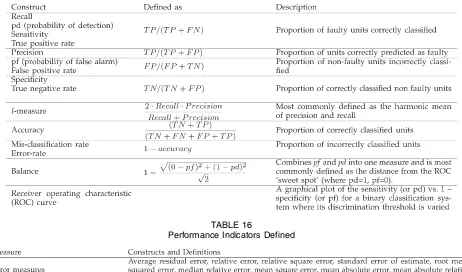
Categorical studies.There are 23 studies reporting catego-rical dependent variables. Categocatego-rical studies report their results in terms of predicting whether a code unit is likely to be fault prone or not fault prone. Where possible we report the predictive performance of these studies using precision, recall, and f-measure (as many studies report both precision and recall, from which an f-measure can be calculated). F-measure is commonly defined as the harmonic mean of precision and recall, and generally gives a good overall picture of predictive performance.4 We used these three measures to compare results across studies and, where necessary, we calculate and derive these measures from those reported (Appendix E explains how we did this conversion and shows how we calculated f-measure). Standardizing on the performance measures reported allows comparison of predictive performances across studies. Lessmann et al. [S97] recommend the use of consistent performance measures for cross-study compar-ison; in particular, they recommend use of Area Under the Curve (AUC). We also extract AUC where studies report this. Appendix D summarizes the measurement of pre-dictive performance.
We present the performance of categorical models in boxplots. Box plots are useful for graphically showing the differences between populations. They are useful for our results as they make no assumptions about the distribution of the data presented. These boxplots present the precision, recall, and f-measure of studies according to a range of model factors. These factors are related to the research questions presented at the beginning of Section 2; an example is a boxplot showing model performance relative to the modeling technique used.
Continuous studies. There are 13 studies reporting con-tinuous dependent variables. These studies report their results in terms of the number of faults predicted in a unit of code. It was not possible to convert the data presented in these studies into a common comparative measure; we report the individual measures that they use. Most measures reported by continuous studies are based on reporting an error measure (e.g., Mean Standard Error (MSE)), or measures of difference between expected and observed results (e.g., Chi Square). Some continuous studies report their results in ranking form (e.g., top 20 percent of faulty units). We extract the performance of models using whatever measure each study used.
Two authors extracted quantitative data from all 36 studies. A pair approach was taken to extracting this data since it was a complex and detailed task. This meant that the pair of authors sat together identifying and extracting data from the same paper simultaneously.
3.4 Synthesizing Data across Studies
Synthesizing findings across studies is notoriously difficult and many software engineering SLRs have been shown to present no synthesis [13]. In this paper, we have also found synthesizing across a set of disparate studies very challen-ging. We extracted both quantitative and qualitative data from studies. We intended to meta-analyze our quantitative data across studies by combining precision and recall performance data. However, the studies are highly dis-parate in terms of both context and models. Meta-analyzing this quantitative data may generate unsafe results. Such a meta-analysis would suffer from many of the limitations in SLRs published in other disciplines [14].
We combined our qualitative and quantitative data to generate a rich picture of fault prediction. We did this by organizing our data into themes based around our three research questions (i.e., context, independent variables, and modeling techniques). We then combined the data on each theme to answer our research questions. This synthesis is presented in Section 6.
4
R
ESULTS OF OURA
SSESSMENTThis section presents the results from applying our assessment criteria (detailed in Tables 4, 5, 6, and 7) to establish whether or not a paper reports sufficient con-textual and methodological detail to be synthesized. The assessment outcome for each study is shown at the end of its reference in the list of included studies.
Table 8 shows that only 36 of our initially included 208 studies passed all assessment criteria.5 Of these 36 finally included studies, three are relatively short [S116], [S110], and [S164]. This means that it is possible to report necessary contextual and methodological detail concisely without a significant overhead in paper length. Table 8 also shows that 41 papers failed at phase 1 of the assessment because they did not report prediction models as such. This includes studies that only present correlation studies or
4. Menzies et al. [10] claim that values of precision vary greatly when used with models applied to different datasets. However, reporting precision and recall via an f-measure effectively evaluates classifier performance, even in highly imbalanced domains [11], [12].
models that were not tested on data unseen during training. This is an important finding as it suggests that a relatively high number of papers reporting fault prediction are not really doing any prediction (this finding is also reported by [6]).
Table 8 also shows that 13 studies provided insufficient information about their data. Without this it is difficult to establish the reliability of the data on which the model is based. Table 8 also shows that a very high number of studies (114) reported insufficient information on the context of their study. This makes it difficult to interpret the results reported in these studies and to select an appropriate model for a particular context. Several studies passing all of our criteria anonymized their contextual data, for example, [S109] and [S110]. Although these studies gave full contextual details of the systems they used, the results associated with each were anonymized. This meant that it was impossible to relate specific fault information to specific systems. While a degree of commercial confidenti-ality was maintained, this limited our ability to analyze the performance of these models.
Of the 114 studies which did not report sufficient context information, 58 were based on NASA data (located in NASA MDP or PROMISE). This is because we could find no information about the maturity of the systems on which the NASA data are based. Maturity information is not given in either the MDP or PROMISE repository documentation and no included paper provided any maturity information. Turham et al. [15] report that the NASA data are from numerous NASA contractors for an array of projects with a wide range of reuse. This suggests that a range of maturities might also be represented in these datasets. No clear insight is given into whether particular datasets are based on systems developed from untested, newly released, or legacy code based on many releases. The only three studies using NASA data which passed the context phase of the assess-ment were those which also used other datasets for which full context data are available (the NASA-based models were not extracted from these studies). Whether a study uses NASA data (sourced from MDP or PROMISE) is shown at the end of its reference in the list of included studies.
Table 8 also shows that two studies failed the assessment due to the “other” reasons reported in Table 9.
5
R
ESULTSE
XTRACTED FROMP
APERSThis section presents the results we extracted from the 36 papers that passed all of our assessment criteria. The full set of data extracted from those papers are contained in our online Appendix (https://bugcatcher.stca.herts.ac.uk/ slr2011/). This online Appendix consists of the following.
1. Context of study table. For each of the 36 studies, the context of the study is given in terms of: the aim of the study together with details of the system(s) used in the study (the application area(s), the system(s), maturity, and size(s)).
2. Categorical models table. For each study reporting categorical results, each model is described in terms of the: independent variable(s), the granularity of the dependent variable, the modeling technique(s), and the dataset(s) used. This table also reports the performances of each model using precision, recall, f-measure, and (where given by studies) AUC. Some studies present many models or model variants, all of which are reported in this table.
3. Continuous models table. For each study reporting continuous results (including those reporting rank-ing results) the same information describrank-ing their model(s) is presented as for categorical models. However, the performance of each continuous model is reported in terms of either: the error measure, the measure of variance, or the ranked results (as reported by a study).
4. Qualitative data table. For each study a short summary of the main findings reported by authors is presented.
The remainder of this section contains boxplots illustrat-ing the performance of the models in relation to various model factors (e.g., modeling technique used, independent variable used, etc.). These factors are related to the research questions that we posed at the beginning of Section 2. The boxplots in this section set performance against individual model factors (e.g., modeling technique used). This is a simplistic analysis, as a range of interacting factors are likely to underpin the performance of a model. However, our results indicate areas of promising future research.
TABLE 9
Issues with the Measurement of Performance TABLE 8
The boxplots represent models reporting only categorical results for which precision, recall, and f-measure were either reported or could be calculated by us. Such models are reported in 19 of the 23 categorical studies (of the remaining four, three report AUC). We are unable to present boxplots for the 13 studies using continuous data as the measures used are not comparable or convertible to comparable measures.
Each boxplot includes data only where at least three models have used a particular factor (e.g., a particular independent variable like LOC). This means that the numbers (n) at the top of the boxplots will not add up to the same number on every plot, as factors used in less than three studies will not appear; the total of ns will therefore vary from one boxplot to the next. The boxplots contain performance data based on precision, recall, and f-measure. This is for all categorical models and model variants presented by each study (206 models or model variants). Some studies present many model variants while others present only one model. We also created boxplots of only the best results from each study. These boxplots did not change the pattern of good performances but only pre-sented limited information about poor performances. For that reason, we do not include these “best only” boxplots.
5.1 Performances of Models Reported in Individual Studies
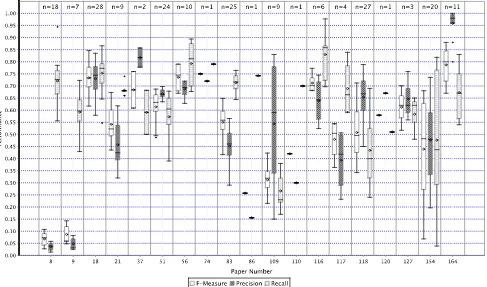
Fig. 1 is a boxplot of the performances of all the models reported by each of the 19 categorical papers (full details of which can be found in the online Appendix). For each individual paper, f-measure, precision, and recall is re-ported. Fig. 1 shows that studies report on many models or variants of models, some with a wide range of performances
(the details of these can be found in the Models Table in the online Appendix (https://bugcatcher.stca.herts.ac.uk/ slr2011/)). For example, Schro¨ter et al. [S154] present 20 model variants with a wide range of precision, recall, and f-measure. Many of these variants are not particularly competitive; the most competitive models that Schro¨ter et al. [S154] report are based on training the model on only the faultiest parts of the system. This is a promising training technique and a similar technique has also been reported to be successful by Zhang et al. [S200]. Bird et al. [S18] report 28 model variants with a much smaller range of perfor-mances, all of which are fairly competitive. Fig. 1 also shows the performance tradeoffs in terms of precision and recall made by some models. For example, Bird et al. [S18] report consistent precision and recall, whereas Moser et al. [S118] and Shivaji et al. [S164] report performances where precision is much higher than recall.
Fig. 1 also shows that some models seem to be performing better than others. The models reported by Shivaji et al. [S164], based on Naive Bayes, performed extremely competitively. In general Naive Bayes performed relatively well, see Fig. 8. However, Shivaji et al. [S164] also used a good modeling process, including feature selection and appropriate measures derived during model training. In addition, their dataset contained a relatively large proportion of faulty components, making it fairly balanced. This may improve performance by providing many exam-ples of faults from which the modeling technique can train. There are many good aspects of this study that mean it is likely to produce models which perform well.
On the other hand, the performance of Arisholm et al.’s models [S8], [S9] are low in terms of precision but
competitive in terms of recall. The two Arisholm et al. studies are different but use the same datasets. This low precision is reportedly because of the sampling method used to address the imbalance of the data used. Though the datasets used are also small relative to those used in other studies (148 KLOC), Arisholm et al.’s studies [S8], [S9] are interesting as they also report many good modeling practices and in some ways are exemplary studies. But they demonstrate how the data used can impact significantly on the performance of a model. It is also essential that both high and low performances be reported, as it is only by identifying these that our overall understanding of fault prediction will improve. The boxplots in the rest of this section explore in more detail aspects of models that may underpin these performance variations. Because the performances of Aris-holm et al.’s models [S8], [S9] are very different from those of the other studies, we have removed them from the rest of the boxplots. We have treated them as outliers which would skew the results we report in other boxplots.
5.2 Performances in Relation to Context Factors
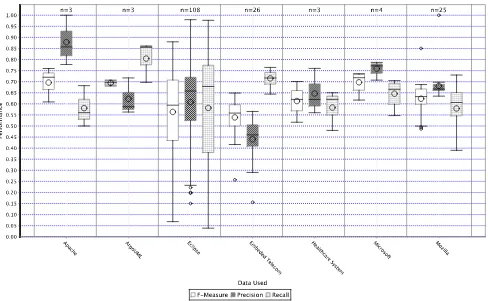
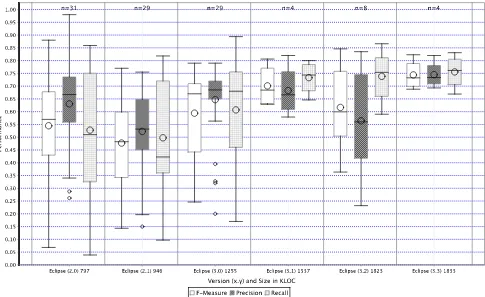
Fig. 2 shows the datasets used in the studies. It shows that 108 models reported in the studies are based on data from Eclipse. Eclipse is very well studied, probably because the fault data are easy to access and its utility has been well proven in previous studies. In addition, data already extracted from Eclipse are available from Saarland Uni-versity (http://www.st.cs.uni-saarland.de/softevo/bug-data/eclipse/) and PROMISE (http://promisedata.org/). Fig. 2 shows that there is a wide variation in model performance using Eclipse. Fig. 2 also suggests that it may be more difficult to build models for some systems than for
others. For example, the models built for embedded telecoms systems are not particularly competitive. This may be because such systems have a different profile of faults with fewer postdelivery faults relative to other systems. Developers of such systems normally prioritize reducing postdelivery faults as their embedded context makes fixing them comparatively expensive [S83].
Fig. 3 shows how models have performed relative to the size of systems on which they are based. Eclipse is the most common system used by studies. Consequently, Fig. 3 shows only the size of versions of Eclipse in relation to model performance. Fig. 3 suggests that as the size of a system increases, model performance seems to improve. This makes sense as models are likely to perform better given more data.
Fig. 4 shows the maturity of systems used by studies relative to the performance of models. The Context Table in the online Appendix shows how systems have been categorized in terms of their maturity. Fig. 4 shows that no immature systems are used by more than two models in this set of studies (i.e., wheren3).6 There seems to be little
difference between the performance of models using mature or very mature systems. This suggests that the maturity of systems may not matter to predictive performance.7 This finding may be linked to the finding we report on size. It may be that what was previously believed about the
Fig. 2. Data used in models.
6. An exception to this is found in studies [S11], [S133], where immature systems are used with promising performances reported (see the online Appendix for full details).
importance of maturity was actually about size, i.e., maturity is a surrogate for size. Indeed, there is a significant relationship between size and maturity in the data we report here. However, we do not have enough data to draw firm conclusions as the data we analyze contain no studies using immature systems. More research is needed to test for possible association between maturity and size and whether data extracted from immature systems can be used as a basis for reliable fault prediction.
Fig. 5 shows the language used in the systems studied in relation to the performance of models. We present only studies reporting the use of either Java or C/C++. There are
several single studies using other languages which we do not report. Fig. 5 suggests that model performance is not related to the language used.
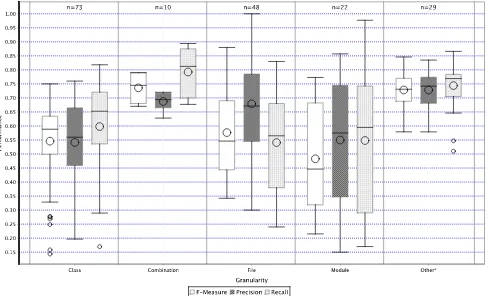
Fig. 6 shows model performance relative to the granularity of dependent variables (e.g., whether fault prediction is at the class or file level). It shows no clear relationship between granularity and performance. It does not seem to be the case that higher granularity is clearly related to improved performance. Models reporting at “other” levels of granular-ity seem to be performing most consistently. These tend to be high levels of granularity defined specifically by individual studies (e.g., Nagappan et al. [S120]).
5.3 Performance in Relation to Independent Variables
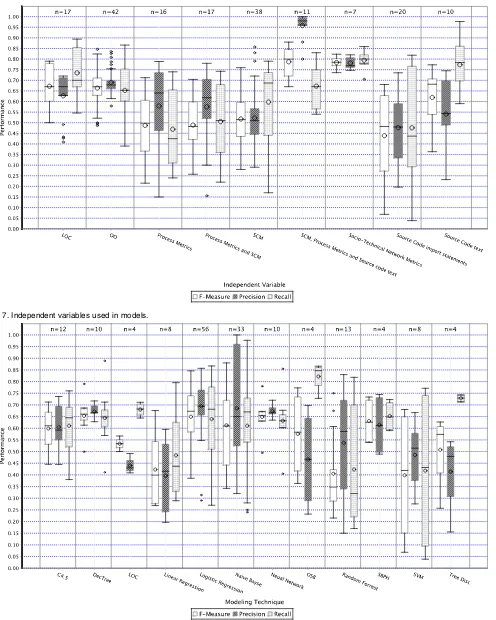
Fig. 7 shows model performance in relation to the independent variables used. The Categorical Models Table in the online Appendix shows how independent variables as expressed by individual studies have been categorized in relation to the labels used in Fig. 7. It shows that there is variation in performance between models using different independent variables. Models using a wide combination of metrics seem to be performing well. For example, models using a combination of static code metrics (scm), process metrics, and source code text seem to be performing best overall (e.g., Shivaji et al. [S164]). Similarly Bird et al.’s study [S18], which uses a wide combination of socio-technical metrics (code dependency data together with change data and developer data), also performs well (though the results from Bird et al.’s study [S18] are reported at a high level of granularity). Process metrics (i.e., metrics based on changes logged in repositories) have not performed as well as expected. OO metrics seem to have been used in studies which perform better than studies based only on other static code metrics (e.g., complexity-based metrics). Models using only LOC data seem to have performed competitively compared to models using other independent variables. Indeed, of these models using only metrics based on static features of the code (OO or SCM), LOC seems as good as any other metric to use. The use of source code text seems related to good performance. Mizuno et al.’s studies [S116], [S117] have used only source
code text within a novel spam filtering approach to relatively good effect.
5.4 Performance in Relation to Modeling Technique
Fig. 8 shows model performance in relation to the modeling techniques used. Models based on Naive Bayes seem to be performing well overall. Naive Bayes is a well understood technique that is in common use. Similarly, models using Logistic Regression also seem to be performing well. Models using Linear Regression perform not so well, though this technique assumes that there is a linear relationship between the variables. Studies using Random Forests have not performed as well as might be expected (many studies using NASA data use Random Forests and report good performances [S97]). Fig. 8 also shows that SVM (Support Vector Machine) techniques do not seem to be related to models performing well. Furthermore, there is a wide range of low performances using SVMs. This may be because SVMs are difficult to tune and the default Weka settings are not optimal. The performance of models using the C4.5 technique is fairly average. However, Arisholm et al.’s models [S8], [S9] used the C4.5 technique (as previously explained, these are not shown as their relatively poor results skew the data presented). C4.5 is thought to struggle with imbalanced data [16] and [17] and this may explain the performance of Arisholm et al.’s models.
6
S
YNTHESIS OFR
ESULTSThis section answers our research questions by synthesizing the qualitative and quantitative data we have collected. The qualitative data consist of the main findings reported by
each of the individual 36 finally included studies (presented in the Qualitative Data Table in our online Appendix). The quantitative data consist of the predictive performance of the individual models reported in the 36 studies (summarized in
Fig. 8. Modeling technique used.
the Categorical and Continuous Models Tables in our online Appendix). The quantitative data also consist of the detailed predictive performance data from 19 studies (206 models or model variants) comparing performance across models (reported in Section 5). This combination of data addresses model performance across studies and within individual studies. This allows us to discuss model performance in two ways. First, we discuss performance within individual studies to identify the main influences on model perfor-mance reported within a study. Second, we compare model performances across the models reported in 19 studies. This is an important approach to discussing fault prediction models. Most studies report at least one model which performs “well.” Though individual studies usually only compare performance within the set of models they present to identify their best model, we are able to then compare the performance of the models which perform well within a study across other studies. This allows us to report how well these models perform across studies.
6.1 Answering our Research Questions
RQ1: How does context affect fault prediction?
Analyzing model performance across the 19 studies in detail suggests that some context variables may influence the reliability of model prediction. Our results provide some evidence to suggest that predictive performance improves as systems get larger. This is suggested by the many models built for the Eclipse system. As Eclipse increases in size, the performance of models seems to improve. This makes some sense as models are likely to perform better with more data. We could find no evidence that this improved performance was based on the maturing of systems. It may be that size influences predictive performance more than system ma-turity. However, our dataset is relatively small and although we analyzed 206 models (or model variants) very few were based on immature systems. Our results also suggest that some applications may be less likely to produce reliable prediction models. For example, the many models built for embedded telecoms applications generally per-formed less well relative to other applications. Our results also show that many models have been built using Eclipse data. This corpus of knowledge on Eclipse provides a good opportunity for future researchers to meta-analyze across a controlled context.
The conventional wisdom is that context determines how transferrable a model is to other systems. Despite this, none of the 36 finally included studies directly investigate the impact on model performance of specific context variables such as system size, maturity, application area, or program-ming language. One exception is [S29], which demonstrates that transforming project data can make a model more comparable to other projects.
Many of the 36 finally included studies individually test how well their model performs when transferred to other contexts (releases, systems, application areas, data sources, or companies). Few of these studies directly investigate the contextual factors influencing the transfer-ability of the model. Findings reported from individual studies on model transferability are varied. Most studies report that models perform poorly when transferred. In fact, Bell et al. [S11] report that models could not be
applied to other systems. Denaro and Pezze` [S37] reported good predictive performance only across homogenous applications. Nagappan et al. [S122] report that different subsets of complexity metrics relate to faults in different projects and that no single set of metrics fits all projects. Nagappan et al. [S122] conclude that models are only accurate when trained on the same or similar systems. However, other studies report more promising transfer-ability. Weyuker et al. [S190] report good performance when models are transferred between releases of systems and between other systems. However, Shatnawi and Li [S160] report that the performance of models declines when applied to later releases of a system. Shatnawi and Li [S160] conclude that different metrics should be used in models used for later releases.
The context of models has not been studied extensively in the set of studies we analyzed. Although every model has been developed and tested within particular contexts, the impact of that context on model performance is scarcely studied directly. This is a significant gap in current knowledge as it means we currently do not know what context factors influence how well a model will transfer to other systems. It is therefore imperative that studies at least report their context since, in the future, this will enable a meta-analysis of the role context plays in predictive performance.
RQ2: Which independent variables should be included in fault prediction models?
Many different independent variables have been used in the 36 finally included studies. These mainly fall into process (e.g., previous change and fault data) and product (e.g., static code data) metrics as well as metrics relating to developers. In addition, some studies have used the text of the source code itself as the independent variables (e.g., Mizuno et al. [S116], Mizuno and Kikuno [S117]).
Model performance across the 19 studies we analyzed in detail suggests that the spam filtering technique, based on source code, used by Mizuno et al. [S116], Mizuno and Kikuno [S117] performs relatively well. On the other hand, models using only static code metrics (typically complexity-based) perform relatively poorly. Model performance does not seem to be improved by combining these metrics with OO metrics. Models seem to perform better using only OO metrics rather than only source code metrics. However, models using only LOC seem to perform just as well as those using only OO metrics and better than those models only using source code metrics. Within individual studies, Zhou et al. [S203] report that LOC data performs well. Ostrand et al. [S133] report that there was some value in LOC data and Hongyu [S56] reports LOC to be a useful early general indicator of fault-proneness. Zhou et al. [S203] report that LOC performs better than all but one of the Chidamber and Kemerer metrics (Weighted Methods per Class). Within other individual studies LOC data were reported to have poor predictive power and to be out-performed by other metrics (e.g., Bell et al. [S11]). Overall, LOC seem to be generally useful in fault prediction.
the findings from individual studies, several authors report that process data, in the form of previous history data, performs well (e.g., [S163], [S120]). D’Ambros et al. [S31] specifically report that previous bug reports are the best predictors. More sophisticated process measures have also been reported to perform well. In particular, Nagappan et al. [S120] introduce “change burst” metrics which demonstrate good predictive performance (however, these models per-form only moderately when we compared them against models from other studies).
The few studies using developer information in models report conflicting results. Ostrand et al. [S135] report that the addition of developer information does not improve predictive performance much. Bird et al. [S18] report better performances when developer information is used as an element within a socio-technical network of variables. This study also performs well in our detailed comparison of performances (Bird et al. [S18] report results at a high level of granularity and so might be expected to perform better). The models which perform best in our analysis of 19 studies seem to use a combined range of independent variables. For example, Shivaji et al. [S164] use process-based and SCM-process-based metrics together with source code. Bird et al. [S18] combine a range of metrics. The use of feature selection on sets of independent variables seems to improve the performance of models (e.g., [S164], [S76], [S18]). Optimized sets of metrics using, for example, feature selection, make sense.
RQ3: Which modeling techniques perform best when used in fault prediction?
While many included studies individually report the comparative performance of the modeling techniques they have used, no clear consensus on which perform best emerges when individual studies are looked at separately. Mizuno and Kikuno [S117] report that, of the techniques they studied, Orthogonal Sparse Bigrams Markov models (OSB) are best suited to fault prediction. Bibi et al. [S15] report that Regression via Classification (RvC) works well. Khoshgoftaar et al. [S86] report that modules whose fault proneness is predicted as uncertain can be effectively classified using the TreeDisc (TD) technique. Khoshgoftaar and Seliya [S83] also report that Case-Based Reasoning (CBR) does not predict well, with C4.5 also performing poorly. Arisholm et al. [S9] report that their comprehensive performance comparison revealed no predictive differences between the eight modeling techniques they investigated.
A clearer picture seems to emerge from our detailed analysis of model performance across the 19 studies. Our findings suggest that performance may actually be linked to the modeling technique used. Overall our comparative analysis suggests that studies using Support Vector Machine (SVM) techniques perform less well. These may be underperforming as they require parameter optimization (something rarely carried out in fault prediction studies) for best performance [18]. Where SVMs have been used in other prediction domains and may be better understood, they have performed well [19]. Models based on C4.5 seem to underperform if they use imbalanced data (e.g., Arisholm et al. [S8], [S9]), as the technique seems to be sensitive to this. Our comparative analysis also suggests that the models
performing comparatively well are relatively simple tech-niques that are easy to use and well understood. Naive Bayes and Logistic regression, in particular, seem to be the techniques used in models that are performing relatively well. Models seem to have performed best where the right technique has been selected for the right set of data. And these techniques have been tuned to the model (e.g., Shivaji et al. [S164]), rather than relying on default tool parameters.
7
M
ETHODOLOGICALI
SSUES INF
AULTP
REDICTION The methodology used to develop, train, test, and measure the performance of fault prediction models is complex. However, the efficacy of the methodology used underpins the confidence which we can have in a model. It is essential that models use and report a rigorous methodology. Without this, the maturity of fault prediction in software engineering will be low. We identify methodological problems in existing studies so that future researchers can improve on these.Throughout this SLR, methodological issues in the published studies came to light. During our assessment of the 208 initially included studies and the extraction of data from the 36 finally included studies methodological weak-nesses emerged. In this section, we discuss the most significant of these methodological weaknesses. These generally relate to the quality of data used to build models and the approach taken to measure the predictive perfor-mance of models.
7.1 Data Quality
The quality of the data used in fault prediction has significant potential to undermine the efficacy of a model. Data quality is complex and many aspects of data are important to ensure reliable predictions. Unfortunately, it is often difficult to assess the quality of data used in studies, especially as many studies report very little about the data they use. Without good quality data, clearly reported, it is difficult to have confidence in the predictive results of studies.
The results of our assessment show that data quality is an issue in many studies. In fact many studies failed our synthesis assessment on the basis that they either reported insufficient information about the context of their data or about the collection of that data. Some studies explicitly acknowledge the importance of data quality (e.g., Jiang et al. [S64]).
often needs to be cleaned (e.g., outliers and missing values dealt with [21]). Very few studies report any data cleaning (even in our 36 finally included studies).
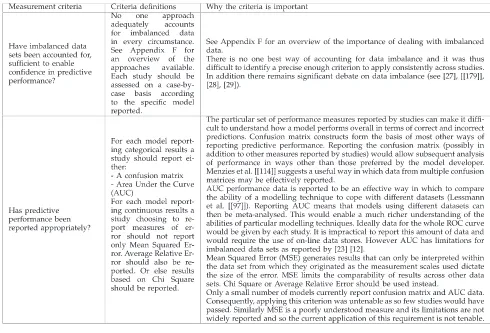
The balance of data (i.e., the number of faulty as opposed to nonfaulty units) on which models are trained and tested is acknowledged by a few studies as fundamental to the reliability of models (see Appendix F for more information on class imbalance). Indeed, across the 19 studies we analyzed in detail, some of those performing best are based on data with a good proportion of faulty units (e.g., [S164], [S37], [S11], [S74]). Our analysis also suggests that data imbalance in relation to specific modeling techniques (e.g., C4.5) may be related to poor performance (e.g., [S8], [S9]). Several studies specifically investigated the impact of data balance and propose techniques to deal with it. For example, Khoshgoftaar et al. [S76] and Shivaji et al. [S164] present techniques for ensuring reliable data distributions. Schro¨ter et al. [S154] base their training set on the faultiest parts of the system. Similarly, Seiffert et al. [S156] present data sampling and boosting techniques to address data imbalance. Data imbalance is explored further in Fioravanti and Nesi [S43] and Zhang et al. [S200]. Many studies seem to lack awareness of the need to account for data imbalance. As a consequence, the impact of imbalanced data on the real performance of models can be hidden by the performance measures selected. This is especially true where the balance of data is not even reported. Readers are then not able to account for the degree of imbalanced data in their interpretation of predictive performance.
7.2 Measuring the Predictive Performance of Models
There are many ways in which the performance of a prediction model can be measured. Indeed, many different categorical and continuous performance measures are used in our 36 studies. There is no one best way to measure the performance of a model. This depends on: the class distribution of the training data, how the model has been built, and how the model will be used. For example, the importance of measuring misclassification will vary de-pending on the application.
Performance comparison across studies is only possible if studies report a set of uniform measures. Furthermore, any uniform set of measures should give a full picture of correct and incorrect classification. To make models reporting categorical results most useful, we believe that the raw confusion matrix on which their performance measures are derived should be reported. This confusion matrix data would allow other researchers and potential users to calculate the majority of other measures. Pizzi et al. [22] provide a very usable format for presenting a confusion matrix. Some studies present many models and it is not practical to report the confusion matrices for all these. Menzies et al. [S114] suggest a useful way in which data from multiple confusion matrices may be effectively reported. Alternatively, Lessmann [S97] recommends that ROC curves and AUC are most useful when comparing the ability of modeling techniques to cope with different datasets (ROC curves do have some limitations [23]). Either of these approaches adopted widely would make studies more useful in the future. Comparing across studies reporting continuous
results is currently even more difficult and is the reason we were unable to present comparative boxplots across these studies. To enable cross comparison we recommend that continuous studies report Average Relative Error (ARE) in addition to any preferred measures presented.
The impact of performance measurement has been picked up in many studies. Zhou et al. [S203] report that the use of some measures, in the context of a particular model, can present a misleading picture of predictive performance and undermine the reliability of predictions. Arisholm et al. [S9] discuss how model performance varies depending on how it is measured. There is an increasing focus on identifying effective ways to measure the perfor-mance of models. Cost and/or effort aware measurement is now a significant strand of interest in prediction measure-ment. This takes into account the cost/effort of falsely identifying modules and has been increasingly reported as useful. The concept of cost-effectiveness measurement originated with the Simula group (e.g., Arisholm et al. [S9]), but has more recently been taken up and developed by other researchers, for example, Nagappan et al. [S120] and Mende and Koschke [S109].
7.3 Fault Severity
Few studies incorporate fault severity into their measure-ment of predictive performance. Although some faults are more important to identify than others, few models differentiate between the faults predicted. In fact, Shatnawi and Li’s [S160] was the only study in the final 36 to use fault severity in their model. They report a model which is able to predict high and medium severity faults (these levels of severity are based on those reported in Bugzilla by Eclipse developers). Lamkanfi et al. [24], Singh et al. [S167], and Zhou and Leung [S202] are other studies which have also investigated severity. This lack of studies that consider severity is probably because, although acknowledged to be important, severity is considered a difficult concept to measure. For example, Menzies et al. [S113] say that severity is too vague to reliably investigate, Nikora and Munson [S126] says that “without a widely agreed definition of severity we cannot reason about it” and Ostrand et al. [S133] state that severity levels are highly subjective and can be inaccurate and inconsistent. These problems of how to measure and collect reliable severity data may limit the usefulness of fault prediction models. Companies develop-ing noncritical systems may want to prioritize their fault finding effort only on the most severe faults.
7.4 The Reporting of Fault Prediction Studies
to replicate studies; it is also difficult for users to identify suitable models for implementation.
7.5 NASA Data
NASA’s publicly available software metrics data have proven very popular in developing fault prediction models. We identify all 62 studies which use NASA data in the reference list of the 208 included studies. The NASA data is valuable as it enables studies using different modeling techniques and independent variables to be compared to others using the same dataset. It also allows studies to be replicated. A meta-analysis of the studies using NASA data would be valuable. However, although the repository holds many metrics and is publicly available, it does have limitations. It is not possible to explore the source code and the contextual data are not comprehensive (e.g., no data on maturity are available). It is also not always possible to identify if any changes have been made to the extraction and computation mechanisms over time. In addition, the data may suffer from important anomalies [21]. It is also questionable whether a model that works well on the NASA data will work on a different type of system; as Menzies et al. [S112] point out, NASA works in a unique niche market, developing software which is not typical of the generality of software systems. However, Turhan et al. [S181] have demonstrated that models built on NASA data are useful for predicting faults in software embedded in white goods.
8
T
HREATS TOV
ALIDITYSearches. We do not include the term “quality” in our search terms as this would have resulted in the examination of a far wider range of irrelevant papers. This term generates a high number of false positive results. We might have missed some papers that use the term “quality” as a synonym for “defect” or “fault,” etc. However, we missed only two papers that Catal and Diri’s [2] searches found using the term “quality.” This gives us confidence that we have missed very few papers. We also omitted the term “failure” from our search string as this generated papers predominately reporting on studies of software reliability in terms of safety critical systems. Such studies of reliability usually examine the dynamic behavior of the system and seldom look at the prediction of static code faults, which is the focus of this review.
We apply our search terms to only the titles of papers. We may miss studies that do not use these terms in the title. Since we extend our searches to include papers cited in the included papers, as well as key conferences, individual journals, and key authors, we are confident that the vast majority of key papers have been included.
Studies included for synthesis. The 36 studies which passed our assessment criteria may still have limitations that make their results unreliable. In the first place, the data on which these models are built might be problematic as we did not insist that studies report data cleaning or attribute selection. Nor did we apply any performance measure-based criteria. So some studies may be reporting unsafe predictive performances. This is a particular risk in regard to how studies have accounted for using imbalanced data.
This risk is mitigated in the categorical studies, where we are able to report precision, recall, and f-measure.
It is also possible that we have missed studies which should have been included in the set of 36 from which we extracted data. Some studies may have satisfied our assessment criteria but either failed to report what they did or did not report it in sufficient detail for us to be confident that they should pass the criteria. Similarly, we may have missed the reporting of a detail and a paper that should have passed a criterion did not. These risks are mitigated by two authors independently assessing every study.
The boxplots.The boxplots we present set performance against individual model factors (e.g., modeling technique used). This is a simplistic analysis, as a number of interacting factors are likely to underpin the performance of a model. For example, the technique used in combination with the dataset and the independent variables is likely to be more important than any one factor alone. Furthermore, metho-dological issues are also likely to impact on performance; for example, whether feature selection has been used. Our boxplots only present possible indicators of factors that should be investigated within the overall context of a model. More sophisticated analysis of a larger dataset is needed to investigate factors influencing model performance.
Our boxplots do not indicate the direction of any relationship between model performance and particular model factors. For example, we do not investigate whether a particular modeling technique performs well because it was used in a good model or whether a model performs well because it used a particular modeling technique. This is also important work for the future. In addition, some studies contribute data from many models to one boxplot, whereas other studies contribute data from only one model. This may skew the results. We do not calculate the statistical significance of any differences observed in the boxplots. This is because the data contained within them are not normally distributed and the individual points represent averages from different sizes of population.
9
C
ONCLUSIONSFault prediction is an important topic in software engineer-ing. Fault prediction models have the potential to improve the quality of systems and reduce the costs associated with delivering those systems. As a result of this, many fault prediction studies in software engineering have been published. Our analysis of 208 of these studies shows that the vast majority are less useful than they could be. Most studies report insufficient contextual and methodological information to enable full understanding of a model. This makes it difficult for potential model users to select a model to match their context and few models have transferred into industrial practice. It also makes it difficult for other researchers to meta-analyze across models to identify the influences on predictive performance. A great deal of effort has gone into models that are of limited use to either practitioners or researchers.
reliable research procedures before we can have confidence in the conclusions of comparative studies.” Our criteria should be used by future fault prediction researchers. They should also be used by journal and conference reviewers. This would ensure that future studies are built reliably and reported comparably with other such reliable studies. Of the 208 studies we reviewed, only 36 satisfied our criteria and reported essential contextual and methodological details.
We analyzed these 36 studies to determine what impacts on model performance in terms of the context of models, the independent variables used by models, and the modeling techniques on which they were built. Our results suggest that models which perform well tend to be built in a context where the systems are large. We found no evidence that the maturity of systems or the language used is related to predictive performance. But we did find some evidence to suggest that some application domains (e.g., embedded systems) may be more difficult to build reliable prediction models for. The independent variables used by models performing well seem to be sets of metrics (e.g., combina-tions of process, product, and people-based metrics). We found evidence that where models use KLOC as their independent variable, they perform no worse than where only single sets of other static code metrics are used. In addition, models which perform well tend to use simple, easy to use modeling techniques like Naive Bayes or Logistic Regression. More complex modeling techniques, such as support vector machines, tend to be used by models which perform relatively less well.
The methodology used to build models seems to be influential to predictive performance. The models which performed well seemed to optimize three aspects of the model. First, the choice of data was optimized. In particular, successful models tend to be trained on large datasets which contain a relatively high proportion of faulty units. Second, the choice of independent variables was optimized. A large range of metrics were used on which feature selection was applied. Third, the modeling technique was optimized. The default parameters were adjusted to ensure that the technique would perform effectively on the data provided.
Overall we conclude that many good fault prediction studies have been reported in software engineering (e.g., the 36 which passed our assessment criteria). Some of these studies are of exceptional quality, for example, Shivaji et al. [S164]. However, there remain many open questions about how to build effective fault prediction models for software systems. We need more studies which are based on a reliable methodology and which consistently report the context in which models are built and the methodology used to build them. A larger set of such studies will enable reliable cross-study metaanalysis of model performance. It will also give practitioners the confidence to appropriately select and apply models to their systems. Without this increase in reliable models that are appropriately reported, fault prediction will continue to have limited impact on the quality and cost of industrial software systems.
R
EFERENCES FOR THE208 I
NCLUDEDSLR P
APERS[S1-S208]
References from this list are cited using the format [Sref#]). Each reference is followed by a code indicating the status of
the paper in terms of whether it passed (P) or failed (F) our assessment. An indication is also given as to the assessment phase a paper failed (1, 2, 3, 4, or 5). The use of NASA data by studies is also indicated (N). A paper (n) failing an assessment criterion in phase 2 which used NASA data would be coded: (Paper=n; Status=F, Phase=2, Data=N)
Please report possible problems with our assessment of these papers to: [email protected].
[1] R. Abreu and R. Premraj, “How Developer Communication Frequency Relates to Bug Introducing Changes,”Proc. Joint Int’l and Ann. ERCIM Workshops Principles of Software Evolution and Software Evolution Workshops, pp. 153-158, 2009. (Paper=1, Status=F, Phase=1).
[2] W. Afzal, “Using Faults-Slip-Through Metric as a Predictor of Fault-Proneness,” Proc. 17th Asia Pacific Software Eng. Conf.,
pp. 414-422, 2010. (Paper=2, Status=F, Phase=2).
[3] W. Afzal and R. Torkar, “A Comparative Evaluation of Using Genetic Programming for Predicting Fault Count Data,” Proc. Third Int’l Conf. Software Eng. Advances, pp. 407-414, 2008. (Paper=3, Status=F, Phase=2).
[4] W. Afzal, R. Torkar, and R. Feldt, “Prediction of Fault Count Data Using Genetic Programming,” Proc. IEEE Int’l Multitopic Conf.,
pp. 349-356, 2008. (Paper=4, Status=F, Phase=2).
[5] S. Amasaki, Y. Takagi, O. Mizuno, and T. Kikuno, “A Bayesian Belief Network for Assessing the Likelihood of Fault Content,”
Proc. 14th Int’l Symp. Software Reliability Eng.,pp. 215-226, Nov. 2003. (Paper=5, Status=F, Phase=2).
[6] C. Andersson and P. Runeson, “A Replicated Quantitative Analysis of Fault Distributions in Complex Software Systems,”
IEEE Trans. Software Eng.,vol. 33, no. 5, pp. 273-286, May 2007. (Paper=6, Status=F, Phase=1).
[7] E. Arisholm and L. Briand, “Predicting Fault-Prone Components in a Java Legacy System,”Proc. ACM/IEEE Int’l Symp. Empirical Software Eng.,pp. 8-17, 2006. (Paper=7, Status=F, Phase=4). [8] E. Arisholm, L.C. Briand, and M. Fuglerud, “Data Mining
Techniques for Building Fault-Proneness Models in Telecom Java Software,”Proc. IEEE 18th Int’l Symp. Software Reliability,pp. 215-224, Nov. 2007. (Paper=8, Status=P).
[9] E. Arisholm, L.C. Briand, and E.B. Johannessen, “A Systematic and Comprehensive Investigation of Methods to Build and Evaluate Fault Prediction Models,” J. Systems and Software,
vol. 83, no. 1, pp. 2-17, 2010. (Paper=9, Status=P).
[10] N. Ayewah, W. Pugh, J. Morgenthaler, J. Penix, and Y. Zhou, “Evaluating Static Analysis Defect Warnings on Production Software,” Proc. Seventh ACM SIGPLAN-SIGSOFT Workshop Program Analysis for Software Tools and Eng., pp. 1-8, 2007. (Paper=10, Status=F, Phase=1).
[11] R. Bell, T. Ostrand, and E. Weyuker, “Looking for Bugs in All the Right Places,” Proc. Int’l Symp. Software Testing and Analysis,
pp. 61-72, 2006. (Paper=11, Status=P).
[12] P. Bellini, I. Bruno, P. Nesi, and D. Rogai, “Comparing Fault-proneness Estimation Models,” Proc. IEEE 10th Int’l Conf. Eng. Complex Computer Systems,pp. 205-214, June 2005. (Paper=12, Status=F, Phase=2).
[13] A. Bernstein, J. Ekanayake, and M. Pinzger, “Improving Defect Prediction Using Temporal Features and Non Linear Models,”
Proc. Ninth Int’l Workshop Principles of Software Evolution: In Conjunction with the Sixth ESEC/FSE Joint Meeting, pp. 11-18, 2007. (Paper=13, Status=F, Phase=2).
[14] M. Bezerra, A. Oliveira, and S. Meira, “A Constructive RBF Neural Network for Estimating the Probability of Defects in Software Modules,” Proc. Int’l Joint Conf. Neural Networks,pp. 2869-2874, Aug. 2007. (Paper=14, Status=F, Phase=2, Data=N).
[15] S. Bibi, G. Tsoumakas, I. Stamelos, and I. Vlahvas, “Software Defect Prediction Using Regression via Classification,”Proc. IEEE Int’l Conf. Computer Systems and Applications,vol. 8, pp. 330-336, 2006. (Paper=15, Status=P).
[16] D. Binkley, H. Feild, D. Lawrie, and M. Pighin, “Software Fault Prediction Using Language Processing,” Proc. Testing: Academic and Industrial Conf. Practice and Research Techniques,pp. 99-110, Sept. 2007. (Paper=16, Status=F, Phase=1).