Harvard University
Working Paper No. 02-04When Does Leadership Matter? The Contingent
Opportunities View of CEO Leadership
Noam Wasserman
Harvard Business School
Nitin Nohria
Harvard Business School
Bharat N. Anand
Harvard Business School
April 2001
This paper can be downloaded without charge from the Social Science Research Network Electronic Paper Collection at:
“W
HEND
OESL
EADERSHIPM
ATTER?
T
HEC
ONTINGENTO
PPORTUNITIESV
IEW OFCEO L
EADERSHIP”
Noam Wasserman Harvard Business School
Nitin Nohria Harvard Business School
Bharat Anand Harvard Business School
Noam Wasserman Harvard Business School Baker West 180-C1 Boston, MA 02163 Tel: (617) 495-6215 Fax: (781) 998-2419
Email: [email protected]
Nitin Nohria
Harvard Business School Morgan Hall 339
Boston, MA 02163 Tel: (617) 495-6653 Fax: (617) 496-6554 Email: [email protected]
Bharat Anand
Harvard Business School Morgan Hall 245
Boston, MA 02163 Tel: (617) 495-5082 Fax: (617) 495-0355 Email: [email protected]
“W
HEND
OESL
EADERSHIPM
ATTER?
T
HEC
ONTINGENTO
PPORTUNITIESV
IEW OFCEO L
EADERSHIP”
ABSTRACT
Studies that have assessed the impact of CEOs on company performance have debated the
question of “Does leadership matter?” “Leadership” proponents state that leadership is a critical
factor, while “constraints” researchers argue that leaders are so constrained that they have little
impact on performance. We propose that this debate might be misdirected. Instead, the question
should be, “When does leadership matter?” We test a framework -- the “contingent opportunities view” -- that resolves the debate. We show that CEO impact differs markedly by industry, and
that CEOs have the most significant impact where opportunities are scarce or where CEOs have
slack resources.
This paper can be downloaded from the
INTRODUCTION
Does it matter who the CEO of a firm is? A review of the literature on leadership reveals
markedly different conclusions about how much impact CEOs will have on their companies’
performance. “Conventional” management theorists, to use Thomas’ (1988) term, posit that
CEOs can have a significant influence on the performance of their companies. From their perch
at the top of a company, CEOs are able to shape the company’s strategy, structure, and culture.
By doing so, CEOs are able to actively direct which opportunities their company will pursue
(Barnard, 1938). In contrast, more recently, organizational ecology researchers and others have
argued that CEOs are so constrained by their environments that they have little ability to affect
company performance. For instance, a company’s culture, the structure of its industry, and its
fixed assets are all inertial forces that reduce the CEO’s ability to take actions that will impact
the company (Hannan and Freeman, 1989).
We believe that the debate over CEO impact is misdirected. Instead of debating “Does leadership
matter?” the core question might instead be framed as, “When does leadership matter?” In the spirit of the latter question, we present a “contingent opportunities view” that reconciles these
divergent views, and then test its predictions in a large-sample study.
We depart from past approaches to understanding leadership in three major ways. First, past
studies – including the theoretical papers described above and almost all of the major empirical
studies of CEO leadership to date – have neglected to examine the contexts in which CEOs may
matter. Except for Lieberson and O’Connor’s (1972) study nearly three decades ago, they have
ignored the potential differences in CEO impact across industries (e.g., Weiner, 1978; Weiner
and Mahoney, 1981; Thomas, 1988). In contrast, using the contingent opportunities view as a
framework, we examine to what extent and under what circumstances leaders can have big or
small impacts on company performance, by examining how CEOs affect variations in company
performance.
Second, even those who have taken a contingent view of leadership have neglected critical
elements of the opportunity structure faced by corporate leaders. Perhaps the best known of
with their overall contingent approach, we disagree with their core conclusion that CEO impact
is greatest in situations characterized by plentiful opportunities. In particular, our contingent opportunities view of leadership posits that where opportunities are scarce, CEOs have a larger impact on company performance, but that in settings where opportunities are plentiful, they have
limited impact on company performance.
Third, the past studies have suffered from methodological problems that cast doubt on their
estimates of CEO impact. All four of the major studies (Lieberson and O’Connor, 1972; Weiner,
1978; Weiner and Mahoney, 1981; Thomas, 1988) have been plagued by one or more of the
following issues: small sample size, failure to control for company size, and narrow definitions
of company performance. We use an augmented variance-decomposition approach, a
42-industry panel data set, and add a new dependent variable to fix these problems and shed new
light on the issue of CEO leadership. Our results show conclusively that CEO effects vary
markedly by industry. Having established this basic tenet of the contingent opportunities view of
CEO leadership, we then explore the factors that account for the differing effects that CEOs can
have on their companies’ performance, and test hypotheses regarding the drivers of CEO impact.
Our theory and results have several important implications for organizations. For example, in
industries where CEO effects are large, boards of directors should be much more careful in
choosing a new CEO than in low-effect industries. Similarly, in high CEO-effect industries –
where CEO actions can have a big impact on company performance – boards should craft CEO
compensation packages that are very sensitive to company performance, while in low-effect
industries, the packages should be less sensitive to company performance.
LEADERSHIP VERSUS CONSTRAINT
Studies of leadership have diverged in their assessments of leaders’ impacts on company
performance. At one end stands the “leadership school,” which argues that leaders have a big
impact on company performance. At the other end, the “constraints school” claims that leaders
are too ruled by their constraints to affect performance.
While the literature on leadership is vast, very little theoretical work has been done about CEO
Economics journals included in the electronic JSTOR database yielded only six articles with the
words “CEO” or “Chief Executive” in their titles or abstracts. All but one of these was
concerned with compensation or stratification issues instead of leadership. Therefore, in trying
to get a picture of the CEO “leadership” versus “constraint” perspectives, we draw on the
CEO-specific work that has been done, but also draw heavily from the general leadership literature.
The Leadership School
Leadership researchers hold that by adapting their organizations’ missions, strategies, structures,
and cultures to their companies’ environments, CEOs can have a substantial impact on company
performance. Child (1972) states that CEOs make material strategic choices that can influence
firm performance. These strategic choices include “not only the establishment of structural
forms but also the manipulation of environmental features and the choice of relevant
performance standards.” (Child, 1972:2) Drucker is also a forceful advocate of the leadership
view: “In a competitive economy, above all, the quality and performance of the managers
determine the success of a business, indeed they determine its survival.” (Drucker, 1954:1)
Managers are the force within the firm that creates, perceives and pursues opportunities, and
therefore the force that drives differences in organizational performance. For example,
organizational leaders formulate a collective purpose that binds organizational members
(Barnard, 1938). Corporate leaders also adapt organizational structures in response to
technological and environmental changes (Lawrence and Lorsch, 1967; Woodward, 1965;
Thompson, 1967). Just as organizations’ contingencies vary markedly, the structures and
strategies crafted by organizational leaders will also differ, thereby producing large variations in
company performance. Leaders can also be critical change agents, by developing a vision and
strategy, establishing a sense of urgency, forming a “guiding coalition” to help them, creating
short-term wins to build momentum, and institutionalizing new approaches (Kotter, 1996).
However, because CEOs differ markedly in their skills and abilities, and in their perceptions and
beliefs, their actions will differ markedly. The resulting performance of their organizations will
vary considerably. Rotemberg and Saloner (1998) argue that a core task of CEO leadership is
having the vision to make idiosyncratic choices. Those leaders who have such a vision – “a bias
in favor of projects that are consistent with the CEO’s view of the likely evolution of the
who pursue personal interests, the CEO’s own interests can contribute significantly to variations
in company performance (Jensen and Meckling, 1977). For these reasons, leaders who make
idiosyncratic choices should increase the variation in company performance.
Another way in which CEO differences affect company performance is the way they entered
their current position. While CEOs who come into a company after the forced turnover of their
predecessors tend to improve company performance, CEOs usually hurt company performance
in two cases: natural turnover followed by an outsider successor, and forced turnover followed
by an insider successor (Khurana and Nohria, 1999). In addition, outsider CEOs have a higher
likelihood of making significant changes to organizational strategy (Wiersema, 1992).
For all of these reasons, leaders are expected to account for a large amount of the variation in
their companies’ performance.
The Constraints School
The constraints school holds that factors external to the CEO impose so many constraints on
CEO actions that CEOs have limited impact on company performance. Both external and
internal constraints tie a CEO’s hands, and prevent the CEO from having an impact on company
performance.
Hannan and Freeman state that inertia prevents executives from changing strategy and structure
quickly enough to react to changes in their environments. The sources of inertia include both
internal factors, such as internal politics, existing control systems, previous investments in fixed assets, and organizational norms, and external factors, such as competitive pressures and barriers to exit and entry. In short, “Inertial pressures prevent most organizations from radically
changing strategies and structures.” (Hannan and Freeman, 1989:22) Therefore, they conclude,
“[I]ndividual managers do not matter much in accounting for variability in organizational
properties” (Hannan and Freeman, 1989:43). Others state that existing power relationships will
cause inertia when attitudes and behaviors become increasingly institutionalized (Burkhardt,
1991). Culture researchers point out that the existence of subcultures and countercultures within
an organization can inhibit a leader’s efforts to change the organization (Martin, 1992). Even
successful and end up producing new patterns of dependence and interdependence (Pfeffer and
Salancik, 1978).
In addition, the confusion and complexity inherent in managerial decision making imposes
cognitive, organizational, and political constraints on decision makers (March and Simon, 1958;
Cyert and March, 1963; Simon, 1976). The impact that leaders can have is also limited by their
own unreflective behaviors that reflect taken-for-granted institutionalized beliefs and practices
(Powell and DiMaggio, 1991). Instead of having idiosyncratic views that shape their actions,
Pfeffer (1977) states that career ladders and institutionally-specified selection processes filter out
idiosyncratic people, resulting in relative homogeneity across CEOs.
As a result, top-level leaders will not be able to have much impact on organizational
performance, for they are severely constrained in their ability to make decisions or to produce
actions that will affect their companies. As a result, leaders are not expected to account for much
variance at all.
Empirical Studies of CEOs
The theoretical literature therefore posits conflicting predictions about how much impact CEOs
will have on company performance. Unfortunately, the empirical literature does not allow us to
settle this issue.
There have been four major empirical studies that have focused on CEO effects (Bowman and
Helfat, 1998). Lieberson and O’Connor (1972) conducted the first study nearly thirty years ago.
In a study of 167 major public companies from 1946-1965, they examined the impacts that each
of Year, Industry, Company, and Leader has on profit margins. Using a sequential
decomposition of variance (discounting first the Year effect, then Industry, then Company, and
then Leadership), they attributed variance in performance to each of the four factors. They found
that Leader effects account for 14.5% of the total variance in profit margins, and that industry
had the biggest impact on profitability, explaining 28.5% of the variance.
In a replication of Lieberson and O’Connor’s study, Weiner (1978) used a sample of 193
manufacturing companies over the period 1956-1974. She found that Leadership accounted for
Leader (called “stewardship” in their paper) explained 12.8% of the variance in profitability,
more in line with Lieberson and O’Connor’s results. More recently, in a replication study using
a sample of 12 U.K. retailing firms over the period 1965-1984, Thomas (1988) found that Leader
explains only 5.7% of the variance in profitability.
Pfeffer and Salancik present Lieberson and O’Connor’s study as support for their “external
control” position, stating that the study showed that “the magnitude of the administrative effect
was dwarfed by the impact of the organization’s industry and the stable characteristics of a given
organization.” (Pfeffer and Salancik, 1978:10) However, this interpretation of Lieberson and
O’Connor’s findings seems extreme. In their paper, to account for the time lag between CEO
actions and the resulting impact on profitability, Lieberson and O’Connor analyzed
forward-lagged measures of performance and found that “leadership influence on profit margins (.32)
exceeds that for either the industry (.273) or company (.222) effects.” Lieberson and O’Connor
themselves concluded that “the leadership effect on company performance does matter.”
(Lieberson and O’Connor, 1972:123)
In short, Lieberson and O’Connor’s (1972) study has been seen to support both the leadership
school and the constraints school. The other three studies since then (Weiner, 1978; Weiner and
Mahoney, 1981; Thomas, 1988) have only compounded the confusion over whether CEO
leadership matters.
THE CONTINGENT OPPORTUNITIES VIEW OF LEADERSHIP
In this paper, we propose and validate a perspective that begins to resolve this issue. Our
perspective builds on a theoretical paper by Hambrick and Finkelstein (1987) that they
themselves describe as “largely speculative.” First, they suggest that constraint – “the obverse of
discretion” – can vary by organization. The top managers of some organizations have more
discretion than do the top managers of other organizations, and that the discretion afforded a
particular top manager can vary over time. Where CEO discretion is high, the CEO (an
“Unconstrained Manager”) can have influence, and where it is low, the CEO (a “Titular
Figurehead”) cannot exceed “his or her discretionary bounds” without losing influence.
Hambrick and Finkelstein propose this theory of managerial discretion as “a bridge between
1987:403) The concept that CEO impact varies given the nature of the situation is also similar to
Fiedler’s formulation of contingent leadership (Fiedler, 1965; Fiedler, 1967).
This concept is contrary to the assumption that the constraints faced by CEOs are similar across
various situations (e.g., different industries). For example, Thomas states that, “Organizational
constraints are constant across samples, just as the constraints that are imposed on a racing driver
by the characteristics of the car are the same regardless of whether it is raced against identical
cars or very different ones.” (Thomas, 1988:398) Reasoning similarly, all three empirical studies
that built on Lieberson and O’Connor’s results neglected to examine industry-level effects, and
instead either explored the CEO effect at the aggregate level (Weiner, 1978; Weiner and
Mahoney, 1981) or examined CEO effect in a single industry (Thomas, 1988).
In contrast, we state that CEO leadership should vary by context, and propose the following
hypothesis:
Hypothesis 1: The Leader effect will vary by industry. In some industries, we will be
able to reject a null hypothesis that CEO effect is zero, while in other industries, we
will not be able to reject the null hypothesis.
More specifically, our contingent opportunities view focuses on two dimensions that affect the
level of CEO impact. The first class of drivers is the characteristics of a company’s external task
environment. When the external environment provides companies with relatively few
opportunities, it is critical that companies make the most of each opportunity, increasing the
CEO’s impact on performance. The second class of drivers is the resources available to a CEO.
If a CEO has ample resources to pursue opportunities when they arise, or to squander them even
when the opportunities are limited, he or she will be able to have a large impact on company
performance. In contrast, if the CEO has few resources, he or she will have a small impact on
company performance.
Scarce Opportunities and the External Task Environment
The two most important characteristics of the external environment are industry structure and the
exchange-constraint – the two major drivers of structural autonomy (Burt 1980) – have a powerful impact
on the CEO’s ability to take actions that impact company performance.
According to Burt’s (1992) theory of structural holes, Industry A is dependent on Industry B
when it buys or sells a significant portion of its output to Industry B. Furthermore, if there are
only a few members of Industry B, those members can co-ordinate their actions and thereby
increase their power over Industry A. Therefore, where Industry A sells a high percentage of its
input to Industry B or where Industry B has only a few members, Industry A will have a low
level of power and a low level of discretion in its actions. Also, when a corporation engages in
exchanges with actors who in turn exchange with each other, the corporation loses power and
therefore has less discretion. Conversely, where Industry A sells a small portion of its output to
Industry B, where Industry B has a lot of members, or where Industry A’s exchange partners do
not trade with each other, Industry A will have a high level of discretion.
According to Burt (1992), in industries with high exchange-constraint and concentration, the
opportunities to act are scarce. In such industries, the ability of a CEO to take advantage of
every opportunity is a crucial determinant of company performance, for the competitive
landscape is nearly “zero sum.” On the one hand, if the CEO can take advantage of a scarce
opportunity, it can seize competitive power. On the other hand, if the CEO misses a scarce
opportunity, it may be a long time before the company gets another chance, and in the meantime,
a rival – the one that did take advantage of the opportunity – has gained competitive power. In
the first case, the CEO’s actions would have a big positive impact on company performance,
while in the second case, the CEO would have a big negative impact on company performance.
In contrast, in industries where opportunities are plentiful and competition is “positive sum,” if a
CEO misses an opportunity, his company will be able to pursue another opportunity with relative
ease. Therefore, CEO actions will have much less impact on company performance.
In short, while at first it may seem counter-intuitive, this line of reasoning leads us to conclude
that where opportunities are scarce, CEO effects should be high. In contrast, in situations where
opportunities are plentiful, CEO effects should be low.
More concretely, we can take a quick look at two, very different, industries and see how their
(SIC 3660) is one in which we would expect to see a high CEO effect. Companies in this
industry design and manufacture telecommunications gear that they sell to
communications-service providers. At key junctures, these communications-service providers make huge investments in upgrading
their networks, buying from the Communications Equipment industry large amounts of
equipment to handle data networking, high-bandwidth transmission, and other critical
components of their telecommunications infrastructures. During the period covered by our
study, the Communications Equipment industry has had higher-than-average concentration and
very high exchange-constraint, leading us to predict that CEO effect will be large in the industry.
In contrast, the Meat Products industry (SIC 2010) is one in which we would expect to see a low
CEO effect. In this industry, concentration and exchange-constraint have both been far below
average, leading us to predict that CEO effect will be much lower than in the Communications
Equipment industry.
When we examine the I/O tables used by Burt for each of these industries, we find marked
differences in the patterns of their use of input commodities (which they have to buy from other
industries) and in their sales of outputs to other industries. As shown below, the Meat Products
industry (which is part of I-O industry number 14) buys 27% of its inputs from its main
input-industry and 24% from its second biggest. These two supplier industries are highly fragmented
with relatively low levels of concentration. On the other hand, the Communications Equipment
industry (part of I-O industry number 56) buys 40% of its main input from a single
input-industry, which in turn is relatively concentrated.
Use of Commodity Inputs
Meat Products
(from I-O industry #14)
Communications Equipment
(from I-O industry #56)
% Bought from Top 5 Industries 60,821 26.97% 8,193 40.23%
54,695 24.26% 1,970 9.67%
22,262 9.87% 1,472 7.23%
16,850 7.47% 1,418 6.96%
8,683 3.85% 782 3.84%
While the contrast is less stark when it comes to the selling of output, we see a similar pattern.
The Meat Products industry sells all but .3% of its output to a single I-O industry (eating and
drinking places/retailers). This industry has very low concentration, giving Meat Products many
alternative customers for its output. The Communications Equipment industry sells almost 6%
of its output to industries outside of its main buying industry, but the industry to which it sells
94% of its output is highly concentrated, making the opportunity to form supplier relationships
even more scarce and critical.
Selling of Outputs
Meat Products
(from I-O industry #14)
Communications Equipment
(from I-O industry #56)
% Sold to Top 5 Industries 325,129 99.74% 38,346 94.22%
497 0.15% 1,140 2.80%
136 0.04% 433 1.06%
84 0.03% 273 0.67%
39 0.01% 127 0.31%
Total Output 325,972 100.00% 40,700 100.00%
When we combine the I/O exchange-constraints of these industries with data on the degree of
industry concentration, we would predict that the CEO effect in Meat Products would be much
lower than the CEO effect in Communications Equipment.
We therefore pose the following two hypotheses regarding industry concentration,
exchange-constraint, and CEO effects.
Hypothesis 2: In industries characterized by high exchange-constraint, CEOs will
have higher CEO effects than in industries with low exchange-constraint.
Hypothesis 3: In industries characterized by high concentration, CEOs will have
higher CEO effects than in industries with low concentration.
Another driver of opportunities is the growth rate of an industry. When an industry is growing
quickly, CEOs have many opportunities to make strategic choices. For instance, a company’s
productive capacity, and which research and development projects to pursue. As argued above,
in industries where opportunities are abundant, if a CEO misses an opportunity, his company will
be able to pursue another opportunity with relative ease. Therefore, CEO actions will have much
less impact on company performance. In contrast, in slow-growth industries, opportunities are
scarcer, taking advantage of every opportunity is crucial, and CEO actions will have more impact
on company performance. We therefore pose the following hypothesis about industry growth
and CEO effect.
Hypothesis 4: In high-growth industries, CEOs will have lower CEO effects than in
industries with low levels of growth.
Resource Availability
When opportunities present themselves, CEOs must have the resources to pursue them. For
instance, they must be able to make a critical acquisition when it presents itself, to invest money
in developing a critical technology, or to roll out a large-scale marketing campaign at the right
time. In general terms, this view of the effects of resource availability is similar to Hambrick
and Finkelstein’s (1987) view of “managerial discretion.”
In many industries, debt-holders have a large claim on company resources. When a company is
highly leveraged, it must make high interest and principal payments, and therefore has little
money left with which to pursue opportunities. According to the “control hypothesis” in the
agency-theory literature, this reduces the amount of cash flow that the CEO can direct towards
investments or acquisitions, reducing the CEO’s power to affect company performance (Jensen,
1986). In addition, when a company has a high level of debt, the probability of defaulting on its
debt is high. Therefore, lenders will conduct much more stringent due diligence on the company
(and possibly make more demands on company management) before they are willing to lend the
company more money, further reducing the impact that a CEO can have on the company. For
both of these reasons, high leverage should constrain CEO actions.
We therefore pose the following hypothesis regarding leverage and CEO effect.
Hypothesis 5: CEOs in situations characterized by high levels of debt will have lower
Counteracting the “handcuffs of leverage” is the amount of slack at the CEO’s disposal. Slack
resources are those that the CEO can redirect relatively easily from low-opportunity areas toward
higher-opportunity areas. For instance, the CEO might be able to take uncommitted marketing
resources and invest them instead in further product development. While there is disagreement
in the literature about whether high levels of slack are helpful or harmful to an organization
(Nohria and Gulati, 1997), there is implicit agreement that high slack should be related to high
CEO effect. On the one hand, the opponents of slack argue that it is a sign of managerial
self-interest and waste. Having high slack will therefore harm company performance, resulting in
CEOs having a negative impact on company performance (Jensen and Meckling, 1976) and increasing the variance in company performance.
On the other hand, proponents of slack argue that slack provides CEOs with resources to manage
external demands and facilitates the experimentation that can be a boon to corporate
performance. For example, Galbraith argues that conflicting demands from external groups can
cause severe constraints for organizational leaders. However, one way for CEOs to cope with
competing demands is through the use of slack resources, such as extra people or assets that can
be redeployed easily (Galbraith, 1973). When CEOs can draw on organizational slack, they can
better satisfy competing demands, thereby reducing interdependence and increasing their impact.
They can take advantage of opportunities that would be missed by CEOs who don’t have such
slack (March and Simon, 1958). Similarly, “the larger the fund of uncommitted capacities, the
greater the organization’s assurance of self-control in an uncertain future” (Thompson, 1967).
Structurally, slack resources enable organizations to create loosely-coupled subunits that reduce
the pressure from environmental constraints, “for without slack, subunits could not be loosely
connected and could not respond to their immediate environments without affecting the entire
system” (Pfeffer and Salancik, 1978:275). Finally, high slack provides CEOs with more rewards
to disperse to subordinates who carry out the decisions of the CEO (Tannenbaum, 1968). For
these reasons, we would expect CEOs to have higher impact where there is high slack, and that
this will result in CEOs having a positive impact on company performance and thereby increasing the variance in company performance.
In short, both sides of the debate would agree that high slack should be affiliated with high CEO
impact on company performance, or due to the CEO’s having a large-but-bad impact on
company performance.) We therefore pose the following hypothesis regarding slack and CEO
effect.
Hypothesis 6: CEOs in situations characterized by high levels of slack will have
higher CEO effects than will CEOs in situations characterized by low levels of slack.
To illustrate this using the examples from above, we can examine resource availability in the
Communications Equipment and Meat Products industries. In the Meat Products industry, the
ratio of debt-to-assets has been above average and the level of slack (as measured by Selling,
General, and Administrative costs as a percentage of sales) has been far below average. In
contrast, in Communications Equipment, the level of debt has been about average while the level
of slack resources has been above average. Therefore, we would predict that CEO effect would
be higher in Communications Equipment than in Meat Products.
The Contingent Opportunities Matrix
The matrix below summarizes the predictions of the contingent opportunities view of leadership.
There are two critical dimensions driving the level of CEO effect: scarcity of opportunities,
which is a function of industry structure, dynamics, and growth, and resource availability, which
is a function of the levels of debt and slack. In “Impact” industries, where opportunities are
scarce and the CEO has the resources needed to pursue the opportunities that arise, the CEO
should have a large impact on company performance. At the other extreme, in “Impotence”
industries, opportunities are not scarce and the CEO is extremely resource constrained, so the
CEO should have little or no impact on company performance. In between the two extremes are
“Constrained” industries, where opportunities are scarce but the resources to pursue the
opportunities are not available, and “Munificence” industries, where resources are available but
the lack of scarce opportunities means that CEOs will not have a large impact on company
Scarcity of Opportunities
(industry concentration, exchange-constraint)
Low High
Low “Impotent” (Low CEO Effect)
“Constraint”
(Moderate CEO Effect)
Resource Availability
(low leverage, high slack)
High “Munificent” (Moderate CEO Effect)
“Impact”
(High CEO Effect)
It should be noted that some of our hypotheses conflict with predictions made by Hambrick and
Finkelstein (1987). They posit that high constraint situations will produce CEOs who are Titular
Figureheads that have little impact on company performance. In contrast, our contingent
opportunities view follows Burt’s reasoning that in industries with high constraint and
concentration, CEOs who take advantage of – or miss – scarce opportunities should have the
most impact on company performance. To revisit our industry comparisons from before, we
would predict that the CEO effect in the Communications Equipment industry would be high,
while Hambrick and Finkelstein might see the scarce-and-constrained opportunities in the
industry as producing Titular Figureheads.
METHODS
Past studies examining this issue have had mixed findings, and have suffered from
methodological and conceptual problems. A goal of this study is to rectify these problems. We
used an enhanced variance-decomposition approach, a more complete sample with more recent
data, and a better dependent variable to rectify these problems.
Sample
Our sample consists of a hierarchical data set (with CEOs within companies within industries
within years) of 531 companies from 42 industries. In contrast to Thomas’ study, we wanted to
all industries (defined at the 3-digit SIC level) that had at least eight companies with Compustat
data for the period 1979-1997. Forty two industries fulfilled these criteria and were included in
our data set. These industries included a wide variety of heavy manufacturing companies,
service providers, and other businesses, and a mix of both small and large companies. Appendix
1 shows these 42 industries.
Variables Used to Test Hypothesis 1
To test Hypothesis 1 (that CEO will vary by industry) and to calculate the CEO effects used to
test the remaining hypotheses, we used two different dependent variables to perform variance
decompositions. As independent variables, we used year, industry, company, and CEO
dummies.
Dependent Variable: Firm Performance
To measure firm performance, Schmalensee (1985) used return on assets (ROA), measured as
the ratio of operating income to total assets. The past empirical studies of CEO effect all used
the same or similar forms of profitability as their dependent variable. Therefore, we used ROA
as our first dependent variable.
However, the literature is replete with studies showing that such accounting-based measures of
performance as ROA are flawed. Accounting-based measures neglect the impact of inflation
(Whittington, 1983) and risk (Schmalensee, 1981). Accounting profit also reflects the past
actions of corporate leaders, for today’s performance is a result of the investments that past
managements made in corporate assets (McGahan, 1998). Because of time lags between CEO
actions and resulting changes in profitability (and asset base), ROA will not pick up the full
impact of Leader on company performance (possibly explaining the strong forward-lagged
effects that Lieberson and O’Connor found when using accounting-based profitability measures).
Finally, metrics like ROA include the value of tangible assets only, failing to incorporate such
intangible assets as brand equity and technical competencies. For some industries, such
intangible assets are a significant portion of corporate asset bases.
Therefore, in her study, McGahan (1998) proposes Tobin’s Q (the firm’s market value divided
reflects expectations that corporate actions will generate greater return from the company’s
assets than if those assets were outside the firm. A value less than 1 reflects expectations that
those assets could generate greater returns if they were deployed outside the firm. While
accounting profit reflects a firm’s past decisions, Tobin’s Q reflects a firm’s prospects for profitability (McGahan, 1998). Tobin’s Q should incorporate more information about company
performance, for when they are making investment decisions, stock-market investors consider a
wide range of company information that is not captured in ROA. For instance, Tobin’s Q can
incorporate some valuation of the corporation’s intangible assets, which is usually absent from
accounting statements and measures. Furthermore, because the market values of company stock
react more quickly to CEO actions, Tobin’s Q should suffer less from time lags. Therefore, we
used Tobin’s Q as the dependent variable in our second set of regression models. (More
specifically, because Tobin’s Q is log-normally distributed, we used the natural logarithm of
Tobin’s Q as our dependent variable.)
We repeated our approach separately for each of these two performance measures.
Independent Variables: Year, Industry, Company, and Leader
Company performance is a function of factors external to the firm and factors internal to the
firm. The two major categories of external factors are conditions related to the business cycle
and the structure of the company’s industry. Two major categories of important internal factors
are characteristics of the firm and the abilities of the company’s leaders.
Therefore, the “external” independent variables we tested are Year and Industry. Year effects reflect macro-economic conditions, such as the state of the financial markets and the stage in the
business cycle. Our panel data set includes company data from 1979-1997, so we tested Year
effects across 19 years. Industry effects reflect conditions that affect the competitive landscape among all companies in an industry. Such factors include switching costs, investments in fixed
assets that are common to all competitors in the industry, and barriers to entry and exit. Industry
effects arise when an industry’s performance consistently differs from the average performance
across all industries, given the year. To assess the Industry effect, we created dummy variables
The “internal” independent variables we tested are Company and Leader. Company effects reflect the competitive advantages or disadvantages unique to a particular company, and arise
when a company’s performance consistently differs from the average performance across all
companies in its industry, given the year. To assess the Company effect, we created dummy
variables for the 531 companies in our sample. Leader effects reflect the impact that the CEO of a company has on company performance. Leader effects arise when the CEOs makes decisions
that result in actions that affect company performance, and arise when a company’s performance
under a particular CEO consistently differs from the average performance across all of the
company’s CEOs. To assess the Leader effect, we collected the names of the chief executive
officer of each of our 531 companies across all 19 years in our sample. We gathered this
information from annual reports and from Dun & Bradstreet, Standard & Poor, and Moody’s
publications, and used the CEO at the end of the year in question. Our data set included a total
of 1,384 CEOs, for an average of 2.6 CEOs for each of our 531 companies. The average CEO
tenure across the entire data set was 7.0 years, with a high of 10.1 years in SIC 6790 (Other
Investing) and a low of 4.8 years in SIC 4810 (Telecommunications Services). Including 19
years of data in the data set allowed us both to have more CEOs within each company and to
reduce the problem of left and right truncation regarding CEO tenures.
Variables Used to Test Remaining Hypotheses
To test Hypotheses 2 through 6, we want to analyze the factors that affect the amount of CEO
effect. To do this, we used the same 42 industries as we used to test Hypothesis 1. The vector of
CEO effects computed in our test of Hypothesis 1 was our dependent variable, and our
independent variables were the factors hypothesized to have a large effect on CEO effect:
industry structure and resource availability.
Dependent Variable: CEO effect
To test these hypotheses, we wanted to analyze the factors that affect the level of CEO effect.
Therefore, our dependent variable is the vector of CEO effects (shown in Table 3) that we
calculated while testing Hypothesis 1. Given Tobin’s Q’s explanatory superiority in our test of
Hypothesis 1, for the remainder of our analyses, we used the CEO effects calculated in our
Independent Variables: Opportunity Scarcity and Resource Availability
As described above, we posit that CEO effect will be affected by industry structure and
dynamics, which drive the scarcity of opportunities, and by resource availability, which drives
the CEO’s ability to pursue opportunities. Therefore, to test these hypotheses, we modeled the
drivers of CEOs effect by using variables that dimensionalize industry and test the features of
industries that are associated with Leader effects.
We tested two central dimensions of industry structure: concentration ratios and
exchange-constraint measures. For the first of these, Burt (1982) used the input-output tables in the
Department of Commerce’s Survey of Current Business as measures of the structural
relationships (“constraints”) between industries. We therefore used the same constraints data as
he used. While concentration data is not readily available, we obtained Burt’s SIC-level
four-firm concentration ratios on all of our industries. These ratios are both log-normally distributed.
Therefore, we used the natural logarithms of these constraint and concentration ratios as our two
external constraint measures. (Because the effect of concentration on the CEO effect is likely to
depend on industry constraints, we introduced an interaction term that captures this non-linear
effect.) The mid-point of our data panel is 1987, so we used the 1987 benchmarks.
To test industry growth rate, our other indicator of opportunity scarcity, we computed each
industry’s average annual growth rate of sales revenue.
The resource availability factors that we tested were debt level, amount of slack, and cost
structure. For debt level, we used Compustat data to compute the industry average ratio of total
debt to firm assets. For slack, we used Compustat data to compute the industry average ratio of
SG&A to net sales. For cost structure, we used Compustat data to compute the industry average
ratio of COGS to net sales.
We used industry-level averages for these regressions, for two main reasons. First, the Burt
(1992) industry concentration and exchange-constraint numbers are at the industry level.
Second, each company has, on average, only three CEOs across the 19 years in the data set,
wanted to use the industry-level CEO effects (where all industries had at least 30 CEOs across
the 19 years in our data set).
Approach
At the end of their paper, Hambrick and Finkelstein pose the problem of how to measure CEO
discretion and impact (Hambrick and Finkelstein, 1987:400). One possible approach is event
analysis, which the leadership-succession literature has used to assess whether managers affect
performance. However, event analysis only looks at the leadership effect during the time after a
succession. In contrast, other empirical studies, such as the one by Lieberson and O’Connor
(1972), use variance decomposition to estimate the leadership effect. These studies are therefore
able to use the leader’s entire record – not just his performance after succession, but throughout
his tenure. In this sense, variance decomposition incorporates more data than does event
analysis. For this reason, we used a version of variance decomposition in this study.
Our approach to variance decomposition follows McGahan and Porter (1997). They build on
methods introduced by Schmalensee (1985) and Rumelt (1991) for disaggregating company
performance into components associated with industry, company, and other effects. Instead of
simply indicating whether a specific independent variable is significant, this method helps explain how important each factor is. Schmalensee (1985) disaggregated company performance into industry and firm effects, and was able to explain almost 20% of the variance in
performance by those factors. However, Schmalensee used only one year of data (1975), and
therefore couldn’t estimate the amount of performance explained by the year effect (a proxy for
macro-economic fluctuations). McGahan and Porter used 14 years of data (1981-1994) and
therefore were able to add year variables to the industry and firm variables. They conducted
hierarchical OLS regressions in which they regressed performance against year, against year and
industry variables, and against year, industry, and firm variables. Then, as an indicator of how
important each class of effects was in explaining company performance, they used the
incremental R2 generated by adding each variable to the regression. In total, they found that the
year, industry, and firm factors explained 52% of the variance in performance.
To study whether leadership matters, we extended McGahan and Porter’s (1997) approach to
explained by the Year, Industry, Company, and Leader effects. First, we created dummy
variables for each of these independent variables. Then, to test the leadership effect across the
entire sample, we apportioned the variance in company performance (our dependent variable) to
each of our independent variables by seeing how much additional variance was explained each
time we added the variable to the regression. We first ran a linear regression using our
dependent variable and Year, and noted the amount of variance explained by Year (“R2Year”).
Second, we added Industry to the regression, which now included Year and Industry as the
independent variables. The amount of additional variance explained (the difference between the
new regression’s R2 and R2Year) is the amount of additional variance explained by Industry
(“R2Industry”). Third, we added Company to the regression, which now included Year, Industry,
and Company as the independent variables. The amount of additional variance explained (the
new regression’s R2 minus R2Year+R2Industry) is the amount of additional variance explained by
Company (“R2Company”). Finally, we added Leader to the regression, which now included all four
independent variables. The amount of additional variance explained (the new regression’s R2
minus R2Year+R2Industry+R2Company) is the amount of additional variance explained by Leader
(“R2Leader”). It should be noted that this variance-partitioning procedure attributes shared
variation to higher-level factors in the hierarchy; for example, the variance shared by Year and
Industry is attributed to Year.
To test whether CEO effect varied by industry (Hypothesis 1), we ran these regressions at the
industry level. For each industry, we sequentially apportioned the variance in company
performance to Year, Company, and Leader by calculating the incremental variance explained by
adding each independent variable to the regression.
RESULTS
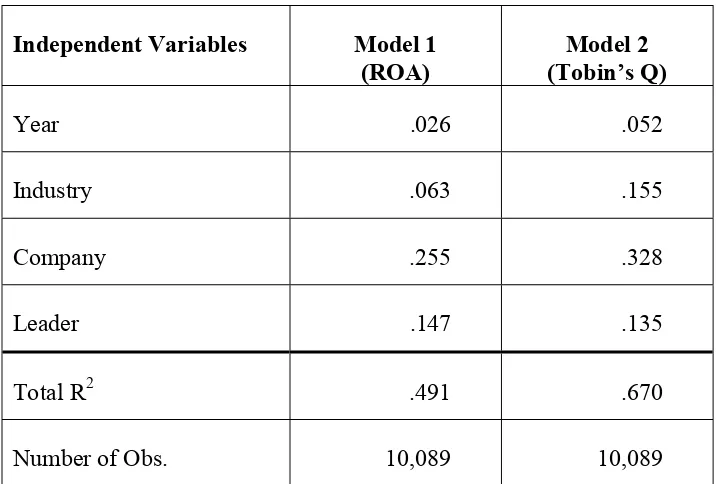
Table 1 presents the results of our aggregate regressions. Across the entire sample, when ROA
was used as the dependent variable, Company accounted for the most variance, followed by
Leader. Industry and Year explained much less of the variance. In total, using ROA, we were
able to explain a little less than half of the variance.
However, using Tobin’s Q, we were able to account for significantly more of the total variance
but it is followed by Industry and then Leader. Year follows far behind the others. In both the
ROA and the Tobin’s Q results, the Leader effects were significant at the p<.01 level.
[INSERT TABLE 1 HERE]
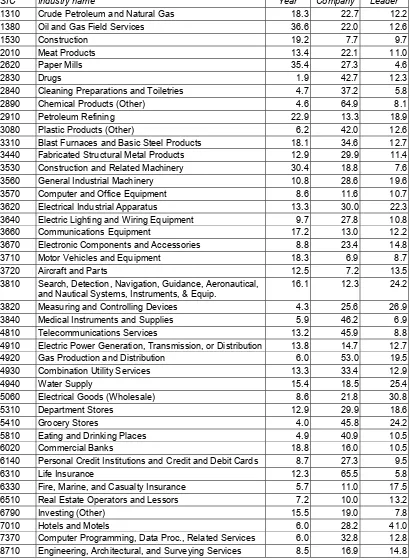
Table 2 presents the results of our industry-level analyses using ROA as the dependent variable.
In the ROA analysis, the Leader effect varied markedly across industries, from a low of 4.6% in
SIC 2620 (Paper Mills) to a high of 41.0% in SIC 7010 (Hotels and Motels). The Company
effect accounted for the highest percentage of variance in 26 of the 42 industries, the Leader
effect for the highest percentage in 8 industries, and the Year effect for the highest percentage in
8 industries.
[INSERT TABLE 2 HERE]
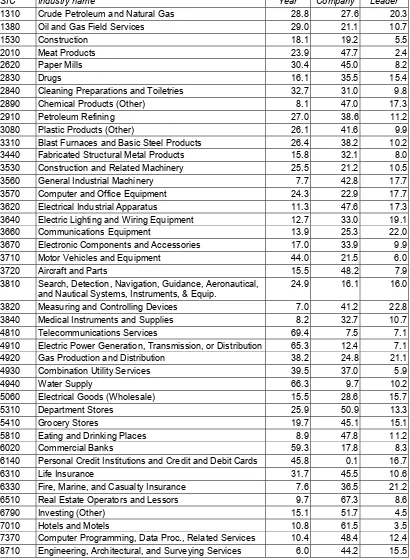
Table 3 presents the results of our industry-level analyses using Tobin’s Q as the dependent
variable. In the Tobin’s Q analysis, the Leader effect varied from a low of 2.4% in SIC 2010
(Meat Products) to a high of 22.8% in SIC 3820 (Measuring and Controlling Devices). The
Company effect accounted for the highest percentage of variance in 28 of the 42 industries and
the Year effect for the highest percentage in 14 industries. Leader did not account for highest
percentage of variance in any single industry in the Tobin’s Q analysis. In Table 2, the two
columns of CEO effects have a correlation of .21.
[INSERT TABLE 3 HERE]
Table 4 shows the correlation matrix for the independent variables that we used to test
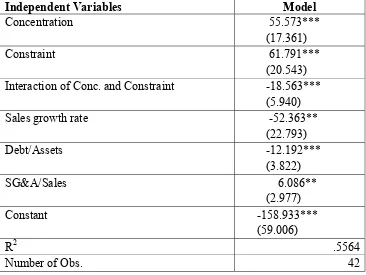
Hypotheses 2 through 6. Table 5 presents the results of this regression model.
[INSERT TABLE 4 HERE]
[INSERT TABLE 5 HERE]
As a whole, this regression of CEO effect on the three opportunity-scarcity indicators and the
two resource-availability indicators has an R2 of 55.6%. Looking first at opportunity scarcity,
concentration and exchange-constraint are both highly significant indicators (p<.01) of CEO
p<.05 level. Similarly, the resource availability factors are both significant, with debt/assets
highly significant (p<.01) and SG&A/sales significant at the p<.05 level.
DISCUSSION
Aggregate CEO Effects
In our aggregate analyses, Leader accounts for 14.7% of the variance in company performance
when using ROA as the dependent variable, and for 13.5% of the variance when using Tobin’s Q
as the dependent variable. Both of these results are consistent with Lieberson and O’Connor’s
result of 14.5%. The Leader effect is very significant (at p<.01).
In total, using Tobin’s Q as our dependent variable, we were able to account for 67% of the
variance in company performance using the Year, Industry, Company, and Leader factors. As
shown in Table 1, using ROA as the dependent variable accounts for less than half of the
variance in company performance, leaving a large amount of variance unexplained. Given all
the reasons described above for why Tobin’s Q is a good dependent variable (including its lower
susceptibility to lags and its incorporation of information about risks and intangible assets), we
used the results from our Tobin’s Q regressions as the basis for our testing of our other
hypotheses.
Adding Leader to McGahan and Porter’s (1997) year, industry, and firm variables leaves us with
less than a third of the variance unexplained. This compares favorably with past
variance-decomposition analyses, such as McGahan and Porter’s (1997) study, which was left with nearly
half of the variance unexplained. As shown by our results, the amount of unexplained variance
in company performance declines notably when the Leader effect is also included in the analysis.
Inter-industry CEO Effect Results
As noted above, all of the studies that followed Lieberson and O’Connor’s (1972) paper
neglected to examine industry-level results. Our results show that there are marked differences in
CEO effects between industries, no matter which dependent variable is used. Neglecting to
examine inter-industry differences is therefore dangerous. This is particularly true of
stores. Our results show that CEO effect in the department store industry (here, SIC 5310) may
not be representative of the overall CEO effect, making it hard to generalize from such a study.
In addition, our results show that CEOs have much more impact in some industries than in
others. In industries where the Year and Company effects are large, such as in SIC 4910
(Electric Power Generation, Transmission, or Distribution) where the two variables account for
78% of the variance in performance, CEOs take few actions that affect company performance.
(Later in this paper, we explore reasons why this might be true.) In industries where the Year
and Company effects are large, such as in SIC 3660 (Communications Equipment) where the
two variables account for less than 40% of the variance in performance, CEOs have a lot more
impact. In contrast to Thomas’ racing-driver analogy, CEOs can be faced with very different situations across different industries. CEOs in different industries are not driving identical cars, the other cars on the road are driving faster in some industries than in others, and the roads on which they are driving may be unpaved and steeply uphill, or paved and moderately downhill.
These results support Hypothesis 1, that CEO effect varies by industry. In some settings, CEO
impact is large, while in other settings, CEOs have little impact.
It is worth noting that high CEO impact can be both an advantage and a disadvantage. As noted
by Thompson (1967), deviant discretion – discretion that is inappropriate to the specific situation
– can be harmful. Therefore, industries with high CEO effects may in fact have a lot of CEOs
whose actions negatively impact company performance. The disadvantages of high CEO discretion are also noted by Hambrick and Finkelstein, who state that “if we had to choose as a
society between doing away with Figureheads or Unconstrained Managers, clearly it is the
Figureheads we would keep.” (Hambrick and Finkelstein, 1987:404)
One could argue that our inter-industry results are more or less random: in any sample of 42
industries, we should see some random variation in the amount of CEO effect observed across
industries. (While F-tests would enable us to exclude this possibility were our sample large
enough, the fact that we only have approximately 30 CEOs in each industry means that they are
unreliable here.) To test this argument, we ran Monte Carlo simulations on our data to assess the
CEO effects that would be observed if the effect was purely random. We randomly allocated
re-ran our variance-decomposition regressions as we had done with the actual performance data.
In 12 of the industries, the CEO effect was more than 5 percentage points (significant at the
p<.05 level) greater than was the random effect generated by the simulation, and in 5 of the
industries it was more than 10 percentage points greater. For a little more than half of the
industries, it was less than 1 percentage point greater than the Monte Carlo effect. This further
reinforces our conclusion that in some industries, CEO leadership matters a great deal, while in
other industries, it has little impact on company performance.
Figure 1 presents the actual CEO results versus the Monte Carlo CEO results. If the CEO effects
were purely random, all of the points plotted should fall along the 45ο line. As shown in the
figure, many of the industries are, indeed, close to this line. These industries are the ones where
CEOs are so constrained that they can have no more than a random effect on performance.
However, as is also shown, many industries lie noticeably above the 45ο
line. In these industries,
where the actual CEO effect is markedly higher than the Monte Carlo CEO effect, CEOs do have
a significant impact on company performance.
[INSERT FIGURE 1 HERE]
As a final test, we subtracted the (“baseline”) Monte Carlo CEO effects from the “actual” CEO
effects in Table 3 to get “randomness-adjusted” CEO effects. This measure was correlated .83
with the actual CEO effects, providing further support for our findings.
However, we should highlight four other issues with our analysis. First, our Leader variable uses
the CEO of the company to assess the impact of leadership on company performance. However,
if a change in CEOs also signals a change in the broader management team (for example, if each
CEO brings in a new CFO, COO, and CTO with him), then our Leader effect would indicate the
impact that management teams have on company performance, rather than the impact that an
individual CEO has on company performance. For this reason, the CEO effect may be less than
the Leader effect found in this study. Second, our variance-decomposition models do not lag
company performance when testing the amount of Leader impact. However, despite the ability
of Tobin’s Q to reduce the problem of lagged performance, for many CEO decisions (such as
major capital investments and attempts to change company culture) the impact of CEO actions
non-lagged Leader effect found in this study. Third, because we only introduced the Leader
variable after introducing all of the other variables to our regression models, our estimate of the
actual magnitude of the Leader effects may be a conservative estimate of the true Leader effect
in each industry. As a result of these limitations, while our relative estimates of Leader effect
across industries would probably not change much, our absolute estimates of Leader effects must
be interpreted with caution. Fourth, as Hambrick and Finkelstein (1987:378-389) point out, in
addition to the characteristics of the task environment and the characteristics of the internal
organization (both of which we test here), the characteristics of the specific CEO is a third
determinant of CEO effect. There are reasons to believe that differences in CEO characteristics
may not play a large role. For instance, Pfeffer (1977) argues that CEOs are relatively
homogeneous because career ladders filter out people with certain characteristics before they get
to the CEO position. Despite this (and despite it being beyond the scope of this study to assess
how individual characteristics affect the CEO’s impact on company performance), we plan to
study this issue in future work.
Opportunity Scarcity and Resource Availability
Our results also show that the scarcity of opportunities and the availability of resources are both
critical factors in determining how much impact a CEO can have on company performance.
While we have made some initial progress toward understanding the factors that contribute to
CEO effect, future research is required to understand more of the dynamics that underlie our
results from this study.
First, regarding the effects of opportunity scarcity, the results support Hypotheses 2 and 3, that
the industry’s level of exchange-constraint and concentration are critical indicators of CEO
impact. In industries highly constrained by their external relationships, companies have few
opportunities to act. Similarly, our results support Hypothesis 4, that in industries with low
growth rates, the opportunities to act are scarce and therefore CEO effect is high. In these
industries, there is a premium on a CEO’s ability to take advantage of every opportunity, for a
lost opportunity can be a grave setback. In such industries, CEO effect is high. In contrast, in
Second, with regards to internal firm characteristics, we find three significant factors. Our
results confirm the proposition that high debt handcuffs a CEO, strongly supporting Hypothesis
5. When a company is obligated to pay out a large percentage of its free cash flow to its debt
holders or risk being driven into bankruptcy, CEOs have very little impact on company
performance. In contrast, when debt holders have little claim on free cash flow, CEOs can
deploy the free cash flow to new investments or other activities that will change company
performance.
Our results also show strong support for Hypothesis 6. Slack plays a key role in determining the
impact that a CEO can have on company performance. When slack is low, CEOs will not have
resources with which to pursue scarce opportunities, and they will therefore have little impact on
company performance. However, when slack is high, CEOs can take advantage of opportunities
or proactively pursue projects that may change company performance. They can better satisfy
competing external demands that otherwise would constrain them. Alternatively, CEOs with
high slack may also waste company assets at a faster rate, thereby having a big negative impact
on company performance. In either case, slack is a key factor in CEO impact.
It should be noted that some of the external and internal independent variables we tested are not
completely “exogenous.” However, there are reasons think that this may not be of concern. On
the one hand, while they can play a strong role in determining the level of CEO impact, CEOs
can also help determine those factors. For example, CEOs can affect their firms’ debt levels and
spending on SG&A. They can attempt to change the industry segments in which their firms
compete, thereby affecting the firm’s external constraints. On the other hand, we conducted our
analysis at the industry level, and individual CEOs should have less ability to affect
industry-level variables than they do at the company industry-level. Furthermore, in our sample, the intra-industry
differences in debt level and SG&A are much lower than the differences across industries, which
indicates that CEOs have at best partial control over these variables. One reason for the lack of
intra-industry variation may be the need to adhere to accepted industry standards to maintain
legitimacy (Powell and DiMaggio, 1991). We agree with Pfeffer and Salancik (1978) that even
CEOs who are constrained can take action to change those constraints. For example, in order to
gain control over the resources their organizations need, managers can adapt or alter the
or growth; negotiate the environment by forming associations and joint ventures, and by creating
interlocking directorships; and use political action to change the legality or legitimacy of its
environment. “There are many possibilities for managerial action, even given the external
constraint on most organizations. Constraints are not predestined and irreversible.” (Pfeffer and
Salancik, 1978:18)
While most of the variables we tested are well-defined, the variable that we used for slack is not.
SG&A is an imperfect indicator of slack because it can include many things, such as committed
advertising expenditures, that are not slack resources re-deployable by the CEO. In addition, the
definition of SG&A may differ by industry; for example, some industries may include
marketing expenses in SG&A, while others have a separate line for reporting marketing expenses
and therefore don’t include them in SG&A. While SG&A is the best universal measure of slack
we have, there is definitely room for further work that examines each of its components to see
what their true effects are, or to examine how inter-industry differences in the definitions of
SG&A affect estimates of CEO available.
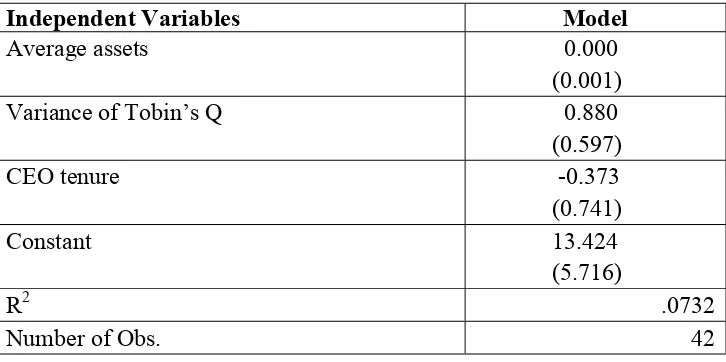
It could be argued that, instead of resulting from the five factors we tested, our CEO effects are
artifacts of three other factors: company size, CEO tenure, and the variance in Tobin’s Q. First,
regarding company size, Thomas has argued that company size should be a major contributor to
the level of CEO impact (Thomas, 1988). For instance, in a smaller company, a CEO would
know more about everything going on within the company, and therefore would be in a better
position to impact its performance. Second, regarding CEO tenure, leadership theorists argue
that the longer a CEO’s tenure, the more of an effect the CEO will be able to have on company
performance. This is because over time, CEOs can build management teams that facilitate
execution of CEO decisions, enact the change programs that they formulate, and solidify their
power in the organization. If industries vary systematically in the tenure of their CEOs, then our
CEO effects may be simply due to these differences in CEO tenures. Regarding variance in
Tobin’s Q, it could be argued that our results simply reflect industry differences in the variance
of performance. In industries where performance swings wildly from year to year or from
company to company, the performance data has a higher variance and we would expect to
of opportunities and resource availability, and simply reflect the underlying variance in
performance.
To test these arguments, we performed an auxiliary analysis that added to our regression model
the average assets, CEO tenures, and variances in Tobin’s Q of each of our 42 industries. This
regression is shown in Table 6. Size, tenure, and variance in performance have no statistically
significant impact on CEO effect. Therefore, we conclude that we can reject these three
alternative explanations.
[INSERT TABLE 6 HERE]
CONCLUSION
In this paper, we have examined the importance of CEOs to variations in performance across
organizations and industries. We have also built on this analysis by identifying characteristics of
the contexts in which CEO leadership matters.
This paper contributes to the literature on leadership in four major ways. First, in methodology,
it differs from previous studies of CEO effects in its use of a dependent performance variable,
Tobin’s Q. This variable has much more explanatory power than did the accounting-based
profitability measures of past studies. Second, this study uses Monte Carlo simulations to assess
whether the CEO effect merely reflects differences in “luck” across CEOs, an issue ignored by
all past studies. Third, it differs from past studies examining the determinants of performance in
industrial economics, in that it includes an important new factor, Leader. While past studies
were not able to explain 50% or more of the variation in performance, adding in the Leader
effect helps us account for a large amount of the unexplained variance.
Finally, we think that the biggest contribution of this study is its exploration of the contexts in
which CEO leadership matters. Past empirical studies that did include leadership effects either
neglected to examine whether CEO effects varied by industry or failed to pursue such results
beyond the “tentative and exploratory” stage. When we examine differences between industries,
we find large and interesting differences in how much of the variance in performance can be
attributed to the CEO of the company. For example, in Communications Equipment, the CEO