www.elsevier.com / locate / econbase
Imposing inequality restrictions: efficiency gains from economic
theory
a ,
*
bJeffrey H. Dorfman
, Christopher S. McIntosh
a
315 Conner Hall, University of Georgia, Athens, GA 30602-7509, USA
b
University of Idaho, Idaho, USA
Received 19 April 2000; received in revised form 13 November 2000; accepted 1 December 2000
Abstract
Econometricians may feel that imposing inequality restrictions improves statistical efficiency, but no real empirical evidence exists. The results of a Monte Carlo experiment show that imposing the curvature conditions on a system of demand equations improves the MSEs on estimated elasticities from 3 to 50% depending on the signal-to-noise ratio and the sample size. 2001 Elsevier Science B.V. All rights reserved.
Keywords: Inequality restrictions; Economic theory; Curvature conditions
JEL classification: C51; C15
1. Introduction
For a generalized (possibly multi-equation) regression model, y5Xb1´ with ´|MVN(0, S),
assume you wish to estimate the k-dimensional vector b while imposing a set of m inequality
restrictions on the parameter vector b, say g(b).r. Do you gain efficiency by imposing the
restrictions?
k k
If the parameter space B #R in which the m inequality restrictions are satisfied is of full
dimension, then for any true restriction set the restricted and unrestricted MLEs are both unbiased and equally efficient. This result, due to Rothenberg (1973), is not covered in the overwhelming majority
1
of (even advanced) econometric texts, nor is it often mentioned in the literature. This is due in part to
*Corresponding author. Tel.: 11-706-542-0754; fax:11-706-369-9472.
E-mail address: [email protected] (J.H. Dorfman).
1
It is worth noting that in a few areas, such as near unit roots, asymptotic theory is being developed that sheds new theoretical insights in inequality restriction (cf. Rothenberg and Stock, 1997). For an example of a near unit root model with an inequality restriction imposed to disallow explosive roots, see Wright (2000).
an assumption that in finite samples imposing the restrictions will improve statistical precision (cf. Fomby et al., 1984), as well as the relative rarity of inequality versus equality restrictions.
However, economic theory provides information that translates into inequality restrictions on the parameters of econometric models (e.g. curvature conditions arising from cost and profit functions). We examine the empirical benefit of imposing such inequality restrictions using Monte Carlo experiments. We find imposing inequality restrictions produces gains in efficiency for several sample sizes and signal-to-noise ratios. Thus, the small sample gains posited by earlier theoreticians (cf. Judge and Yancey, 1981) are empirically verified. In fact, we find the gains persist even for samples as large
as n5300.
2. The Monte Carlo experiment
Monte Carlo experiments were conducted using a four-equation system of input demand functions from a normalized quadratic cost function subject to symmetry and linear homogeneity in input prices.
2.1. The data generating process
The production process is assumed to have five inputs (capital, labor, energy, materials, and services) producing one output. Conditional input demands are solved for to minimize cost based on planned output and known input prices (the numeraire equation for materials demand is not included as those elasticities can be recovered through the imposed linear restrictions). The input demand equations used to generate the data are
xit5ai1wtbi1yt ig 1´it, i51, 2, 3, 4; t51, . . . , n; (1)
where x is the conditional input demand, w is a (1it t 34) vector of normalized input prices, y is thet
planned output level, ´it is an iid Gaussian disturbance term, and ai, bi, gi are the structural
parameters to be estimated.
Normalized input prices are all set to one for t51 and then simulated by AR(1) processes with
drift through n observations meant to represent annual data; output evolves as an AR(1) with drift and
trend from an initial value of y156.7. All stochastic terms are iid Gaussian. The cost function
parameters and the standard deviations of the stochastic terms were calibrated to match annual data on
2
US chemical and allied products manufacturing (SIC 28).
Two parameters of the data generating process were varied. The sample size was first set to either 50 or 100, approximating annual post-World War II data and quarterly data for the modern floating exchange rate era. The signal-to-noise ratio was set to 0.5, 1.0, or 2.0 times the calibrated base value. Two additional experiments with sample sizes of 200 and 300 were conducted with a signal-to-noise ratio of 1.0 to examine whether the advantage from imposing inequality restrictions disappeared at
2
larger sample sizes. For each combination of these two control parameters, 1000 data sets were generated per experiment.
2.2. The estimation algorithms
The inequality restrictions to impose on this system can be written as
l(B )#0, (2)
m3m m
where l(Z ) is an eigenvalue function for real matrices: R →R , and B5[b b b b1 2 3 4] is the
(434) Hessian matrix formed from the individual bi. These restrictions ensure the cost function is
concave in input prices.
The parameters of interest are elasticities; we measure the MSE of the estimated elasticities, not the structural coefficients (though the results should apply equally to them). The input price elasticities of
] ]
the input demands are taken at the sample means,hij5bijw /x .j i
Three estimation methods are applied to each data set to estimate the 16 (free) elasticities in our system. The first method is unrestricted maximum likelihood estimation (UMLE), equivalent to GLS for this case, and represents the standard method used most by econometricians. The second estimation method is restricted maximum likelihood (RMLE), using a basic Newton’s method. If the UMLE satisfies the inequality restrictions, it is taken to be the RMLE. In the remaining cases, the search algorithm starts at the Bayesian estimates because they always satisfy the restrictions. Convergence of the algorithm is determined according to the multiple criteria method of Gill et al. (1981).
The third method is Bayesian. The prior distribution on the parameters is taken to be a product of independent normal distributions on the regression coefficients, an indicator function that equals one when all the restrictions are satisfied and zero otherwise, and a standard Jeffreys (ignorance) prior on
2( p11 ) / 2
the variance components, p(S)~uSu , where p is the dimension of the covariance matrix. The
2
variances of the normal distributions are set equal to 625 (525 ) on each structural parameter,
representing very diffuse information on parameters of this magnitude. Importance sampling with antithetic replication (Geweke, 1988b) is employed to generate a sample from the posterior distribution of the elasticities and the posterior mean is taken to be the optimal estimate, implying a quadratic loss function. This Bayesian restricted posterior mean (BRPM) estimator is constructed by imposing prior information that is extremely informative with respect to the economic theory (no support for estimates that violate the theory), but only mildly informative with respect to numerical magnitudes (proper, but quite diffuse priors). Each restricted estimate is based on 1000 random draws (500 antithetic pairs) which was empirically determined to provide suitable numerical accuracy.
3. Empirical results
The results of the Monte Carlo experiments for n550 and n5100 are shown in Table 1. To save
space and improve clarity, we show summary measures of the ratios of MSEs for two methods per column. These summary measures are arithmetic means, geometric means, and medians of the ratios of MSEs for all 16 free elasticities in each experiment.
Table 1
a
Summary measures of MSE ratios for the three estimation methods
2
s n550 n5100
U / R U / B R / B U / R U / B R / B
Mean 1.102 1.131 1.023 1.041 1.097 1.054
0.5 G.mean 1.098 1.211 1.021 1.041 1.096 1.053 Median 1.112 1.154 1.041 1.034 1.088 1.045
Mean 1.460 1.432 0.976 1.137 1.202 1.057
1.0 G.mean 1.344 1.294 0.963 1.136 1.199 1.055 Median 1.242 1.302 1.028 1.117 1.192 1.061
Mean 1.523 1.427 0.949 1.249 1.339 1.070
2.0 G.mean 1.315 1.213 0.923 1.245 1.312 1.054 Median 1.405 1.488 1.012 1.238 1.299 1.082
a
All numbers are based on the ratio of MSEs for two different estimation methods; U, unrestricted MLE; R, restricted MLE; B, Bayesian restricted-prior posterior mean estimator. Numbers shown are mean, geometric mean (G.mean), and
2
median of the ratios of the MSEs for the 16 input price elasticities of the four input demand functions in our system.s is the multiple of the calibrated signal-to-noise ratio used in that experiment; n is the sample size in the generated data sets.
ratios of MSEs for the UMLE to either the RMLE or the BRPM show gains to imposing the
restrictions for all six experiments. The gains are considerably smaller for the n5100 experiments,
dropping from a range of 10 to 52% when n550 to one of 3 to 34%. While linear extrapolation
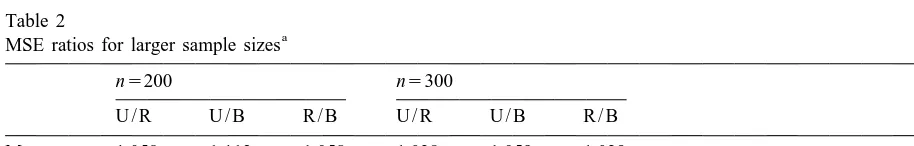
suggests the Rothenberg result will be approximated near n5150, the two additional experiments with
n5200, 300 did not confirm this. Even with n5300, the RMLE had a 3% efficiency gain over UMLE
and the BRPM had a 6% gain, with both of these measured by the geometric mean (Table 2 shows these results). Thus, the finite sample efficiency gains hold even for sample sizes where we often think that asymptotic results have taken hold.
The third column of each triplet compares the two approaches to imposing inequality restrictions.
At n550 the results are essentially even. At n5100, the BRPM shows a consistent 5 to 8% advantage
in MSE. This Bayesian advantage declines as n continues to increase, but there is still a 3% extra
efficiency gain at n5300. To ensure that the gains found were not due to the tightness of the prior
2
distribution used, sensitivity analysis was performed. The experiment with s 51.0 and n550 was
2 2
repeated for two different prior variances, t 5100 and t 510 000 (the original experiments had
2 2
t 5625). The MSE values for the BRPM were virtually identical for the two alternative values oft .
Table 2
a
MSE ratios for larger sample sizes
n5200 n5300
U / R U / B R / B U / R U / B R / B
Mean 1.058 1.112 1.058 1.028 1.059 1.029
G.mean 1.051 1.111 1.057 1.028 1.056 1.027 Median 1.046 1.100 1.052 1.031 1.075 1.035
a
These results for the BRPM estimator are significant because advances in numerical Bayesian methods (cf. Geweke, 1986, 1988a; DeJong and Whiteman, 1991; Poirier, 1991; Terrell, 1996) have made such techniques widely accessible.
4. Conclusions
We have provided strong evidence that imposing inequality restrictions leads to a more efficient
estimator (in a mean squared error sense) in samples ranging from small (n550) to rather large
(n5300). In most cases, these gains are large enough to be both statistically and economically
significant. We have also provided evidence that the Bayesian inequality-constrained posterior mean is
more efficient than the RMLE for medium sample sizes (n5100, 200). These results provide rare
empirical evidence in support of Judge and Yancey’s (1981) theoretical paper on the finite sample advantages to restricted MLE, notwithstanding Rothenberg’s asymptotic results.
Acknowledgements
The authors thank John Geweke, Arnold Zellner, Paul Fackler, seminar participants at Iowa State University, Ohio State University, North Carolina State University and Texas A&M University and the audience at the 1998 American Agricultural Economics Association Meetings for helpful comments that have improved the paper.
References
DeJong, D.N., Whiteman, C.H., 1991. Reconsidering ‘Trends and random walks in macroeconomic time series’. Journal of Monetary Economics 28, 221–254.
Fomby, T.B., Hill, R.C., Johnson, S.R., 1984. Advanced Econometric Methods. Springer-Verlag, New York.
Geweke, J., 1988a. The secular and cyclical behavior of real GDP in 19 OECD countries, 1957–1983. Journal of Business and Economic Statistics 6, 479–486.
Geweke, J., 1988b. Antithetic acceleration of Monte Carlo integration in Bayesian inference. Journal of Econometrics 38, 73–89.
Geweke, J., 1986. Exact inference in the inequality constrained normal linear regression model. Journal of Applied Econometrics 1, 127–141.
Gill, P., Murray, E.W., Wright, M.H., 1981. Practical Optimization. Academic Press, New York.
Judge, G.G., Yancey, T.A., 1981. Sampling properties of an inequality restricted estimator. Economics Letters 7, 327–333. Poirier, D.J., 1991. A Bayesian view of nominal money and real output through a new classical macroeconomic window.
Journal of Business and Economic Statistics 9, 125–148.
Rothenberg, T.J., 1973. Efficient estimation with a priori information. In: Cowles Foundation Monograph 23. Yale University Press, New Haven.
Rothenberg, T.J., Stock, J.H., 1997. Inference in a nearly integrated autoregressive model with nonnormal innovations. Journal of Econometrics 80, 269–286.
Terrell, D., 1996. Incorporating monotonicity and concavity conditions in flexible functional forms. Journal of Applied Econometrics 11, 179–194.