T H E J O U R N A L O F H U M A N R E S O U R C E S • 45 • 1
Expansions of the Impact of
Maternal Care on Early Child
Development
Michael Baker
Kevin Milligan
A B S T R A C T
We study the impact of maternal care on early child development using an expansion in Canadian maternity leave entitlements. Following the leave expansion, mothers who took leave spent 48–58 percent more time not working in their children’s first year of life. This extra maternal care pri-marily crowded out home-based care by unlicensed nonrelatives and re-placed full-time work. Our estimates suggest a weak impact of this in-crease in maternal care on indicators of child development. For example, measures of temperament and motor and social development show changes that are small and statistically insignificant.
I. Introduction
Is parental or nonparental care best for children? Conflicting answers to this question fuel the so-called “mommy wars” over maternal work when children are young. One source of the lack of agreement is that nonparental care appears to have different impacts in different populations. Karoly et al. (1998) summarize the compelling evidence from social experiments showing that high-quality early
child-Michael Baker is professor of economics and public policy at the University of Toronto. Kevin Milligan is associate professor of economics at the University of British Columbia. They received many helpful comments from Jane Waldfogel and from seminars at the American Economic Association meetings, the National Bureau of Economic Research, the Australian National University, University of California-Davis, McMaster, New South Wales, Ottawa, Rand, Stavanger, and Sydney. The research support of the Social Sciences and Humanities Research Council (Baker Grant, #410-2005-0486, Milligan Grant #410-2002-0299) is gratefully acknowledged. Byron Lee and Josh Lewis provided excellent research assistance and the staffs of the Toronto and British Columbia Research Data Centres provided welcomed technical sup-port. This paper represents the views of the authors and does not necessarily reflect the views of Statistics Canada. The data used in his article can be obtained through application to Statistics Canada’s Research Data Centre program at http://www.statcan.ca/english/rdc/index.htm.
[Submitted February 2008; accepted September 2008]
hood care interventions can improve cognitive outcomes for children at risk. On the other hand, recent evidence from samples including all types of children suggests that the beneficial cognitive effects of nonparental care may be offset by behavioral problems, and that maternal employment in a child’s first year of life can lead to delayed cognitive development.
Commentators have pointed out that the credibility of the inferences in this lit-erature varies considerably owing to differences in empirical design. Perhaps the strongest evidence is for at-risk children, because experimental designs have featured randomization into high-quality nonparental care. However, current policy debate centers not on targeted interventions for at-risk children, but on universal programs such as preschool for four-year-olds and extensions of maternity leave in the United States, or universal childcare programs for infants in Canada. There is much less experimental evidence for broader populations of children, so inferences lean more heavily on observation: comparisons of children whose parents have chosen non-parental care to children whose parents have not.
In this paper we provide new evidence on the developmental impact of maternal care based in a significant increase in maternity/parental leave in Canada. At the end of 2000, the duration of job-protected, partially compensated, maternity leave increased from roughly six months to one year in most provinces. Many mothers were thereby provided with an opportunity to significantly extend the period they remained at home postbirth. Importantly, this episode allows a researcher to study observationally equivalent women having children in neighboring years under starkly different maternity leave policy regimes. This provides a source of exogenous vari-ation in the exposure to maternal care for a wide spectrum of children through the first year of their lives.
Our results on child development rest on the strength of this first-stage relationship between maternity leave and time at home. Following Baker and Milligan (2008a, 2008b) and Hanratty and Trzcinski (2009), we show that the increase in maternity leave led to a very substantial increase in the amount of maternal care Canadian children received in the first year of life. For mothers who were eligible for leave, we estimate that the amount of maternal care their children received in the first year of life rose by over three months, an increase of roughly 50 percent over the pre-reform average. Importantly, this increase in maternal care led to a large reduction in maternal time work. Previous research identifies a negative link between full-time maternal work in a child’s first year of life and their subsequent cognitive development.
Of course, any effect of an increase in maternal care depends on what type of care is displaced. We find the increase in maternal care is associated with a large decline in unlicensed care provided by a nonrelative in someone else’s home. Past research has raised questions about the quality of this type of care, so the contrast to maternal care is clear.
of parenting, temperament, social and motor development, the achievement of mile-stones, family function, and children’s social and family environment. While some of these indicators are related to subsequent cognitive performance, we also note that they may be important for adult economic success in their own right (Heckman, Stixrud, and Urzua 2006).
We find that the reform led to a significant increase in the amount of maternal care children received, with corresponding decreases in full-time maternal employ-ment and unlicensed nonrelative care. However, the impact of these changes on our measures of development is negligible. The effects on measures of family environ-ment and motor and social developenviron-ment are very close to zero. Some improveenviron-ments in temperament are observed but appear to reflect common trends across all mothers rather than only mothers eligible for the leave.
II. Previous Research on Care at Young Ages
For the vast majority of mothers, work and nonparental care go hand in hand when their children are very young. Therefore a focus of the literature is on the relationship between child development and the mother’s decision to work when their child is an infant.
The National Longitudinal Study of Youth (NLSY) is a source for much of the research on this topic in the United States. The majority of studies on early maternal employment (specifically, the first year of life) using these data find negative effects on later cognitive outcomes, although there is some dissent (see references and discussions in Brooks-Gunn, Han, and Waldfogel 2002, Waldfogel, Han, and Brooks-Gunn 2002, and Bernal and Keane 2007). This conclusion is supported by analysis of the NICHD-SECC data (Brooks-Gunn, Han, and Waldfogel 2002), which concludes that full-time maternal employment in the first nine months of life has negative cognitive effects that manifest by three years of age. Cawley and Liu (2007) employ time-use data to explore potential mechanisms, finding that there is a sig-nificant reduction in time spent reading and helping with homework for families with employed mothers. As a point of contrast, studies using various other data generally find no negative impact of early maternal employment on the outcomes of school-aged children (see Brooks-Gunn, Han, and Waldfogel 2002).1
Neverthe-less, in her survey of this literature, Waldfogel (2006) concludes, “[T]he research on this point is now quite clear. Children do fare better on average if their mothers do not work full-time in the first year of life, although . . . the effects vary by context” (p.45).
Complementary to this research are studies of the effects of nonparental care on other dimensions of development. Loeb et al. (2007), Magnuson, Ruhm, and Wald-fogel (2007), Baker, Gruber, and Milligan (2008), and the research summarized in Belsky (2006) suggest that larger and longer exposures to nonparental (often center-based or formal) care lead to problem behavior: disobedience, defiance, and
sion. The risk appears to grow both in the cumulative duration (months) and intensity (hours per week) of exposure in the first years. Loeb et al. (2007) finds that entry into nonparental center-based care before the age of one can have particularly det-rimental effects.
In any discussion of these results an outstanding issue is the quality of nonparental care. Measures of childcare quality are evolving, and often expensive to collect. The data that exist suggest that while higher quality childcare can enhance the cognitive benefits of nonparental care for older children (Belsky 2006), it does not attenuate any negative effect of early maternal employment (Brooks-Gunn, Han, and Wald-fogel 2002). Furthermore, quality does not appear to play a strong mediating role in the relationship between exposure to nonparental care and behavior (Belsky 2006). Against this background, our study has a number of attractive features. First, the change in maternal care we observe spans the nine months-old milestone where previous research has found a relationship between maternal employment and cog-nitive development. Second, we have access to a relatively rich description of the children’s environment. Third, many mothers in our sample use informal nonparental care, which has not previously been intensively studied. Finally, the variation in maternal care we observe as a result of the maternity leave reform is less likely correlated with other determinants of children’s outcomes. In many of the previous studies cited, the inference is observational rather than causal, and so may be biased by unobservable background factors that differ systematically across families. Pro-gress in the literature is marked by new data sets (for example, the NICHD SECC) that gather more extensive menus of observable background factors in the hope that the additional factors can contain any selection effects. In contrast, our study makes use of policy-induced variation in maternal care. While more likely free of omitted variables biases, our inference is limited to mothers whose choice of time at home postbirth responds to changes in maternity mandates and compensation.2
III. Maternity Leave Policy
Jurisdiction over maternity leaves in Canada is split between the federal and provincial governments. Provincial labor standards legislation governs the amount of time that mothers may stay at home postbirth with a right to return to their old job. The legislation typically sets eligibility based on a minimum period of prebirth employment, bans dismissal due to pregnancy, mandates a maximum duration for leave, mandates a right to return to the previous or a similar job, and specifies which terms of employment are preserved during the leave. In no province is the employer obligated to pay an employee while on this leave.
Income replacement during the leave is funded by the federal government. Within the federal Employment Insurance (EI) system there is a program of maternity/ parental (henceforth maternity) leave benefits that mothers may claim when their
earnings are interrupted by giving birth. Eligibility and benefit entitlement are de-termined by the same rules used to calculate unemployment benefits. Benefits are based on earnings averaged over the six months preceding the claim. In the period we examine, the replacement rate is 55 percent up to a cap of $39,000, which implies a maximum weekly benefit of $412.50 per week. A two-week waiting period with zero benefits lowers the effective replacement rate over the full span of the leave. Eligibility is based on a minimum of 600 hours of employment in the 12 months preceding a claim. Claiming these benefits does not trigger any job protection, and some mothers will not return to work after completing a claim.
The reform we analyze originates in the federal EI system. Prior to December 31, 2000, the duration of maternity leave benefits was a maximum of 25 weeks—15 weeks that could only be claimed by the mother, and a further ten weeks that could be split by the mother and the father (with no restrictions on how these ten weeks were split). Starting with children born on December 31, 2000, the total duration of benefits was increased to 50 weeks as the number of weeks of benefits that could be claimed by either the mother or father rose to 35 weeks. The reform also included a reduction of the required hours of employment for eligibility from 700 to 600.
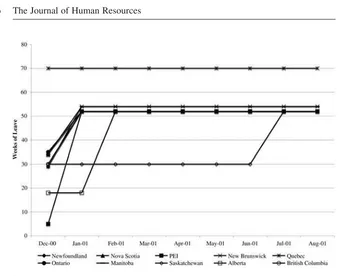
This change in the rules for maternity leave benefits triggered a corresponding change in the duration of job-protected maternity leave in the provinces’ labor stan-dards legislation. Prior to December 31, 2000, the duration of the job protection ranged from a low of 18 weeks in Alberta to a high of 70 weeks in Quebec. With the change in the EI rules all provinces except Quebec changed their labor standards legislation to increase the duration of job protection to at least 52 weeks. Most provinces made the change coincident with the change in the EI rules. Alberta (February 7, 2001) and Saskatchewan (June 14, 2001) changed their legislation early in 2001. These changes are summarized in Figure 1.
In addition to any change in maternal care, this reform also may have changed family income because the statutory EI replacement rate is only 55 percent. In some simple simulations available in Appendix 1, however, we find that on an after-tax/ transfer, after childcare cost basis, the effective replacement rate is close to one for a median earning woman. For women earning less than the median, the EI benefit (which depends on previous earnings) is lower but still may yield higher income after-tax and after paid childcare than work. For higher-earning women, the effective replacement rate falls beneath one, meaning that they may suffer an income shortfall in the leave extension period relative to the prereform situation. We note that these high earnings women are more likely to work for employers that have a program to top up EI benefits to a higher fraction of prebirth earnings.
IV. Data
Figure 1
Protected Maternity Leave Mandates by Province
Notes: The lines indicate the number of mandated weeks of job-protected leave by province.
are only available for specific age ranges. Below, we describe the measures available to us, and discuss the validity and use of these measures.
The NLSCY includes a wide variety of indicators of child development, home and care environments, school performance, and health. At the ages that we observe the treated children both precognitive and noncognitive measures are available, but not direct cognitive assessments.3
A first set of variables allows us to relate the policy change to the children’s care environment. For this purpose, there are variables recording the child’s age when the mother returned to work, and some limited characteristics of the employment. There also are detailed questions on the types of nonmaternal care a child receives, including hours per week and whether the provider is licensed.
The next set of variables describes the child’s development. Many of these vari-ables are available only for particular age ranges. For the ages we study, there are measures of temperament, motor and social development, family function, parenting, parent/child activities, and the achievement of milestones. All are parent-reported and obtained through the interview process. Several of these measures have been used in previous research. The Motor and Social Development (MSD) scale (Baker et al. 1993) was developed at the U.S. National Center for Health Statistics for the
general measure of early child development in large, population-based surveys. It uses questions with high validity and reliability from leading measures of child development (Denver Prescreening Developmental Questionnaire, Bayley Scales of Infant Development, and Gesell Development Schedules). This scale also has been used in the U. S. National Longitudinal Survey of Youth, the British National Child Development Survey, and the U. S. National Health and Nutrition Examination Survey III. The parenting scales, one measuring positive interaction and another measuring practices that provoke aversion, were developed at Chedoke-McMaster Hospital, McMaster University, based in part on the Parent Practices Scale of Stray-horn and Weidman. These scales also are used by the Fast-Track project, an exper-imental intervention in the United States to understand anti-social behavior among young children. The general functioning subscale of the McMaster Family Assess-ment Device (FAD) is used to measure family (dys)function. The FAD has been used in numerous studies, translated into seven languages, and has been extensively evaluated. The NLSCY also includes measures of the ages at which significant milestones are achieved (first steps, first words etc.). The questions about the child’s temperament were taken from the Ontario Health Study and the Montreal Longitu-dinal Survey. These questions are based on the Child Behavior Checklist of Ach-enbach and the Social Behavior Questionnaire. Finally, we also draw on questions about nonschool activities of the parent and child and questions about literacy, fo-cusing on how often parents read stories, teach new words, and do play activities with their children.
Parent-reported data may suffer from systematic biases. For example, a parent who stays home with a child may have a greater chance of becoming aware of a behavior since more time is spent with the child than if the parent worked. However, reviews of the validity of parent-reported data typically suggest they are informative about the underlying object they are intended to measure and often display strong correlation with professional assessment (De Los Reyes and Kazdin 2005; Rydz et al. 2005). Furthermore, there does not appear to be clear evidence that any bias in parents’ reports of their children’s development is correlated with their characteris-tics (De Los Reyes and Kazdin 2005). The Appendix to Baker, Gruber, and Milligan (2008) provides more detail on this important issue.
V. Empirical Framework and Identification
In this section we introduce our empirical framework, describe vari-ous sample omissions that we make to achieve identification, and discuss some issues of interpretation and estimation.
A. Empirical Framework
Our inference is based on comparisons of average outcomes by birth cohort. We begin with the estimating equation
t
y⳱XⳭ ␥YOBtⳭu
(1) i i
兺
i iwhereyis the outcome of interest for individuali, Xare conditioning variables and YOBdenotes year of birth.4 The␥t,t , provide birth
cohort-僆
{
1999,2000,...,2003}
specific estimates of the conditional mean ofy,relative to the excluded year 1998. If the reform led causally to a change in a given outcome, we expect that the estimates of␥t will display a distinct pattern before and after the program change. The change in maternity leave is in effect for the birth cohorts 2001–2003, and so we anticipate a discrete change in the estimates between the cohorts 2000 and 2001. All else equal, we also would expect the estimates for cohorts 1998–2000 and for 2001–2003 to be relatively similar in the absence of any other factor driving changes in the dependent variable in these years.
A visual inspection of the estimates of ␥t, which we report for each outcome variable in the tables of Appendix 2, provides an informal check of the coherence of the data to the hypothesized pattern. It also allows us to investigate counterfactual policy reforms (for example, supposing the change in maternity leave occurred at the end of 1999 or 2002, instead of at the end of 2000) as a robustness check for our inferences. Once these checks are satisfied, we then summarize the impact of the reform more concisely by estimating the equation
y⳱XⳭPOSTⳭε
(2) i i i i
wherePOSTequals 1 for cohorts born after the reform (2001 or later).POST pro-vides an estimate of the impact of the reform, as the difference in the conditional mean ofybetween cohorts born before the change in the maternity leave and cohorts born after.
B. Identification and Interpretation
The success of this strategy, of course, is not assured. Generally, conditional on the Xs the estimate ofPOSTwill pick up any unobserved variable that is correlated with it and the dependent variable. For example, underlying trends in the outcome mea-sures or other changes in the developmental environment of the children could con-taminate our estimate ofPOST. We can anticipate some of these unobserved vari-ables and control for them through adjustments to our sample. We have identified two policy changes of importance, either of which could potentially affect family outcomes or child development and therefore damage the credibility of our infer-ences.
The first is the extension of the subsidized childcare component of Quebec’s family policy to zero- and one-year-olds in the fall of 2000. Under this extension, children of these ages became eligible for heavily subsidized childcare, at $5 per day. Baker, Gruber, and Milligan (2008) report that the introduction of subsidized childcare in Quebec over the period 1997–2000 had a large impact on the
ing of families with young children, and the behavioral development of these chil-dren. To avoid confusing any impact of the change in maternity leave with this change in the price of nonparental care, we omit observations from Quebec from our sample.
The second significant change in policy is the increase to the National Child Benefit, a benefit paid to low-income families and which in some provinces required some attachment to the labor force to receive benefits. For example, the annual benefit for one child increased from $605 in 1998 to $1,293 in 2002. Milligan and Stabile (2007) show that this change had a substantial impact on the employment of single mothers. Because the benefit is income-tested at the family level, it had a much smaller effect on two-parent families.5As a result, we omit observations for
single-parent families from our analysis sample. It is worth noting that due to rela-tively low rates of single parenthood in Canada, this omission removes only about 10 percent of births over the period.6,7
An alternative to tailoring the sample to exclude specific confounding factors is to construct a control group of children who are exposed to the same influences as children in our analysis sample, with the exception of the change in maternity leave. While older children might be natural candidates for this role since they appear in the same waves of the survey but were born too early to be affected by the maternity leave change, this idea is frustrated by the structure of the NLSCY. There are distinct differences in the indices of development, family function, and the questions about nonschool activities, for different age groups that render these measures less com-parable across ages.
Because we do not observe prebirth employment consistently across waves in the NLSCY, we cannot precisely identify those women who were eligible either for job-protected leave or for EI maternity benefits. As a result, our analysis samples contain mothers who were potentially ineligible because of insufficient work prior to the child’s birth and also those who may have been eligible but did not take benefits to which they were entitled. For this reason, Equations 1 or 2 should be interpreted as an “intention to treat” design, with “eligibility” meaning the mother had a child after December 31, 2000 and “takeup” meaning that the new mother actually took a leave.8
The intention-to-treat estimates are informative about the impact on child devel-opment of having a child after the policy changed. This is interesting if one is
5. In 1998, the National Child Benefit was reduced to zero for family incomes above $25,921. By 2002, this threshold had reached $32,960. A much smaller proportion of two-parent families fall under these thresholds.
6. This rate of single parenthood appears much smaller than in the United States. In the United States, the proportion of births to unmarried mothers exceeds 35 percent. However, our sample includes children born to unmarried mothers in common law relationships and so is not strictly comparable. Also, the Canadian rate is best compared to the U.S. rate for the white non-Hispanic population which is much lower than the overall U.S. rate.
7. In addition to the omissions described in the main text, we also exclude the very small number of children born in Alberta and Saskatchewan in the months between December 2000 and the point when the provincial maternity leave mandate changes a few months later.
concerned about the population-level impact of the policy change. More informative about individual behavior is the “treatment on the treated” parameter, which mea-sures the impact of actually taking a leave on child development. To move from the intention-to-treat to the treatment on the treated parameters requires us to scale the intention to treat estimates by a factor reflecting the proportion of women who had a birth and took a leave.9
To implement this scaling, we take the following approach. In Statistics Canada’s Survey of Employment Insurance Coverage data, 70 percent of mothers with chil-dren aged younger than one year had insured employment in the 12 months preced-ing childbirth in 2000, rispreced-ing to between 74 and 75 percent in 2001 through 2005.10
If this prebirth employment meant these mothers were eligible for the job protection aspect of maternity leave, then we should scale our estimates by 1.33 (1/0.75). The presence of insured employment, however, does not guarantee EI benefit receipt. These same data show that the proportion of mothers with any insurable employment who ultimately are eligible for and claim benefits is 80 percent in 2000 and 2001 rising to roughly 85 percent in 2002–2005. If we are interested in the impact of being eligible and taking up EI benefits, then we should scale our estimates by 1.57 (1/(0.75*0.85)). In the discussion of results that follows we make reference to both the 1.33 and 1.57 scaling factors as the lower and upper bound implied by the available evidence.
Still another method to obtain the treatment effects is to restrict the analysis sam-ple to only those who might be eligible. While the NLSCY does not collect good information on prebirth employment, the information on postbirth employment is much better. We can use this information to select mothers who are likely to have been eligible for both the EI maternity benefits and the job-protected maternity leave. We implement this approach by selecting mothers who return to work within a year of their child’s birth.11Note that a comparison of the results in the restricted and
full samples provides yet another check on our identification. The comparison reveals whether “likely eligibles” or “likely ineligibles,” as we define them, drive the result in the full sample. This can only be an informal check, however, because the inci-dence of return to work postbirth is potentially affected by the change in maternity leave.
C. Estimation
Equations 1 and 2 make clear that an estimate ofPOSTrests on the variation of the conditional mean of yacross six birth cohorts. Recently, Donald and Lang (2007) have pointed out the importance of explicitly accounting for the finiteness of the “effective sample” in the estimation—that is, the fact that in some respects we only
9. See Heckman, Lalonde, and Smith (1999).
10. The source is Statistics Canada (2006), which reports results from the Survey of Employment Insurance Coverage. The increase between 2000 and 2005 suggests that the reform led to an increase in the prebirth employment of mothers, but the match is not exact because each survey runs from April though January of the following year. In contrast, the reference period for benefits is for employment in the 12 months preceding the birth of a child who can be up to 12 months old. Unfortunately there are no data on maternity benefits preceding the 2000 survey.
have six aggregated observations rather than the thousands of individuals in the underlying microdata sample. To account for this, we use a two-step procedure. We first estimate Equation 1 with no constant, which provides estimates of the YOBt effects for each birth cohort.12We then use these estimates as the dependent variable
in a six observation regression following Equation 2, except the only explanatory variables are a constant and POST, and we weight by the sum of the individual weights by year of birth. There are four degrees of freedom in these regressions so the critical value for statistical significance at the 5 percent level is 2.78. All the substantial inferences of the paper are robust to alternative methods of calculating the standard errors.13
VI. Results
We present results in three steps. First, we examine the impact of the reforms on work by new mothers—and its complement, maternal time at home. Second we trace the change through to the types and timing of different modes of nonparental care. Finally, we explore the impact of the induced changes in care on child development and the family environment.
A. Maternal care and work
Estimates of the impact of the increase in maternity leave on the amount of maternal care a child receives are reported in Table 1. As a summary statistic, in the first row we report the result for a measure of the months of maternal care in the child’s first year of life. This variable, which takes values between 0 and 12, is constructed from a report of the mother’s return to work postbirth. The sample for this analysis is the mothers of children aged 13–29 months, so labor market behavior over the first year of life is fully observable.
The estimate in the first column indicates an increase of 2.2 months, which is 26 percent of the prereform mean. The causal interpretation of this estimate is supported by the individualYOBestimates reported in the Table A3 of Appendix 2. We graph these estimates in Figure 2 to illuminate our identification strategy. There is a clear shift in the estimates starting with the 2001 birth cohort.
This is an intention-to-treat estimate. To obtain the treatment on the treated, we can scale the estimate, resulting in an increase in maternal care of between (2.2*1.333) 2.9 and (2.2*1.57) 3.5 months. The prereform mean of this variable among those who actually took maternal leave is presumably different (and likely
12. These are similar to the reported in Appendix 2, but rescaled since we now include the full set of cohort dummies including one for the 1998 birth cohort.
Table 1
Estimated Impact of Longer Maternity Leave Mandates on Time Spent at Home Postbirth
Prereform Mean
POST POST,
Control for Unemployment
Rate
Months spent at home in first year
8.35 (3.68)
2.203* (0.283)
2.207* (0.273) Months at home ⱖ one month 0.96
(0.19)
0.018 (0.007)
0.017 (0.009) Months at home ⱖ three months 0.92
(0.27)
0.035* (0.011)
0.035* (0.012) Months at home ⱖ six months 0.82
(0.39)
0.090* (0.023)
0.091* (0.020) Months at home ⱖ nine months 0.49
(0.50)
0.358* (0.038)
0.358* (0.037) Months at home ⱖ 12 months 0.42
(0.49)
0.282* (0.039)
0.283* (0.039)
Mother works 0.55
(0.50)
ⳮ0.295* (0.029)
ⳮ0.295* (0.029)
Mother works fulltime 0.34
(0.47)
ⳮ0.199* (0.005)
ⳮ0.192* (0.013)
Notes: Number of observations is six. A star indicates statistical significance at the 5 percent level. The sample for the time at home analysis is the mothers of children aged 13–29 months. The sample for the maternal work analysis is the mothers of children aged 7–12 months. Each row presents analysis of the indicated dependent variable. The first column has the means (standard deviations) of the indicated variable for cohorts born prereform. The second column has coefficients (standard errors) for thePOSTvariable described in the text. The third column adds the provincial unemployment rate as a control variable in the first stage.
smaller) than the mean for the full sample. To obtain an estimate of this mean we can restrict the sample to mothers who are likely treated by the policy change based on their postbirth employment behavior. Restricting the sample to mothers who returned to work in the 12 months following birth, the estimated increase in maternal care in the first year of life is 3.150 (0.239) months, which sits at the midpoint of the interval defined by our scaling technique. The prereform mean in the sample is 6.02 months indicating that our scaled estimates suggest the reform led to an increase in maternal care of between 48 and 58 percent for treated mothers.
Figure 2
Months of Maternal Care in First Year Relative to the 1998 Birth Cohort
Notes: The bars display the regression coefficients on the␥tterms from Equation 1 using as a dependent
variable the months of maternal care in the first year. The excluded dummy is for the year 1998.
estimated a specification (not reported) omitting all the explanatory variables except the YOBeffects. The results are again very similar, revealing that there is no sig-nificant observable variation in the types of mothers and families having births as a result of the reform. This provides some additional justification for our empirical approach.
In the next five rows we map out the distribution of the effect across different months over the first year. Recall that before the reform, maternity benefits were available for up to 25 weeks, and job protection was available for 18–35 weeks in the provinces included in the analysis sample. In light of this, the largest impact is exactly where it is expected—in Months 6–12—and in each case the estimates of the individualYOBeffects (reported in Appendix 2) support a causal interpretation. The proportional increases are substantial, ranging from 11 percent at six months to 67 percent at 12 months. Using the sample of mothers who returned to work in the first year we can obtain (but do not report) direct estimates of these proportional changes for the treated. They range from 17 percent at 6 months through 726 percent at 12 months.
The results indicate a 29.5 percentage point decrease in the proportion at work, two-thirds of which is a decrease in full-time employment. Therefore, the majority of work displaced by the reform was full-time. This provides important context for our analysis of development, because it is full-time work in this age interval that previous research has related to cognitive delay.
B. Changes in nonparental care
To interpret our estimates of the impact of the reform on child development, it is useful to know what sort of nonparental care the increase in maternal care displaced. This information is provided in Table 2. We show estimates for two samples: chil-dren aged 7–12 months and 13–24 months. We expect the primary impact of the reform to be evident in the younger sample. The older sample provides a check whether there is either a direct impact on older children, or a persistent effect of some impact that starts at a younger age.
In the first row is a global measure of whether the child is in some type of nonparental care. We estimate a decrease of over 18.5 percentage points for children aged 7–12 months, and effectively no change for children aged 13–24 months. As expected, the primary effect of the reform is at ages 7–12 months. However, the magnitude of the effect presents a puzzle as it does not match the decrease in work of the mothers of these children reported in Table 1. We resolve this discrepancy in the next four rows where we split the sample into four mutually exclusive cate-gories: (1) mothers who work and use (nonparental) care, (2) mothers who work and don’t use care, (3) mothers who don’t work and use care, and 4) mothers who do not work and do not use care. Estimating the equation for the global measure of childcare separately for each sample reveals that the overall 29.5 percentage point decrease in work is split across mothers who do and do not use care (0.229Ⳮ0.068).
The 0.185 decrease in nonparental care reflects the balance of a reduction in work with care (ⳮ0.229) and an increase in no work with care (Ⳮ0.044). As noted by Baker, Gruber, and Milligan (2008), the nontrivial proportion of mothers reporting work with no care is likely a result of the underreporting of very informal care arrangements in the NLSCY. As a result, the increase in maternal care as a result of the reform likely exceeds the direct estimate of 18.5 percentage points. Further-more, scaling for treatment, the impact on those likely eligible for leave is at least 25–29 points.
In the next row of the table we report the result for the number of hours per week if in care. In the younger sample there is a significant reduction of more than five hours off a prereform mean of 29 hours. There are at least two explanations of this result. First, there is a composition effect resulting from the fact that the mothers who stay home longer after the reform would otherwise be heavy users of nonpar-ental care. Second, the longer periods at home postbirth after the reform allowed mothers to introduce their children to nonparental care more gradually. While the former explanation is consistent with the strong decrease in full-time work, the latter explanation may be consistent with the increase in the proportion of mothers not at work and using care.
Table 2
Estimated impact of longer maternity leave mandates on work and care decisions
Children aged 7–12
Work and care 0.38
(0.48)
Work and no care 0.17
(0.38)
No work and care 0.05
(0.22) No work and no care 0.40
(0.49) Hours of care if in care 28.9
(16.80) Own home-based care 0.13
(0.33) Other’s home-based care 0.26
(0.44)
Notes: Number of observations is six. A star indicates statistical significance at the 5 percent level. Each row presents analysis of the indicated dependent variable. The first two columns show the results for the sample of 7–12 month olds, and the next two columns for the 13–24 month olds. For each sample we report the means (standard deviations) of the indicated variable for cohorts born prereform. We also report the coefficients (standard errors) for thePOSTvariable described in the text.
from the reform depends on the extent that the quality of care between unlicensed nonrelatives and mothers differs.
C. Changes in development and environment
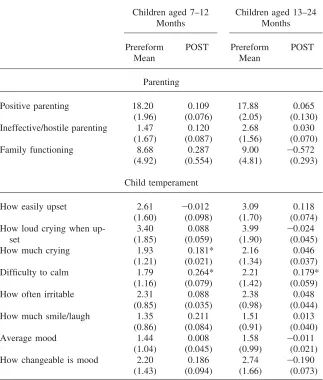
We now turn to our measures of child development and of the domestic environment. Again, we examine children aged 7–12 months and 13–24 months separately, look-ing for both concurrent and persistent effects of the strong increase in maternal care. In the first three rows of Table 3, we present the results for indices of parenting behavior and family function. Each is built up from the answers to a series of questions about how the parents interact with the child and with each other. The positive parenting index ranges from 0 to 20 with higher scores reflecting more positive behavior. The hostile/ineffective index runs from 0 to 8 and here a higher value indicates less effectiveness. Finally, the family functioning scale ranges from 0 to 36 with a higher value indicating more dysfunction. Baker, Gruber, and Milligan (2008) report a significant deterioration in similar indices as a result of a strong increase in nonparental care following the introduction of heavily subsidized uni-versal childcare in Quebec. In that study, however, the change in care was primarily experienced by children older than the ones studied here and the substitution was from maternal care to formal nonmaternal care.
The estimates for both age groups are mostly small and all are statistically insig-nificant. Furthermore, in each case the estimates of the individualYOBeffects show regular inter-birth cohort variation that is not related to the timing of the extension of maternity leave. Finally, in many cases the standard errors are small, indicating that our evaluation has some power. Remembering that we need a t-value of 2.78 for significance at the 5 percent level, the standard errors for the estimates for posi-tive parenting indicate that we can rule out effects larger than 11 percent of the standard deviation of the prereform mean in the younger sample. For ineffective parenting and family function the corresponding calculations are 14 and 31 percent of the standard deviation. In the older sample they range from 12–18 percent. Each of these bounds is fairly small given the large magnitude of the increase in maternal care.
The next set of measures captures different dimensions of the child’s temperament. Each is a seven point scale where lower numbers indicate a better result. For ex-ample, a lower value for how easily upset indicates that the child does not get upset very easily. Many of the questions require an evaluation of the child relative to other children, although for some the scale maps out specific responses (for example, how many times per day the child is irritable). We are therefore reluctant to assign a specific interpretation to the magnitude of the estimates, but some meaning can be found in their signs.
Table 3
Estimated Impact of Longer Maternity Leave Mandates on Parenting and Child Temperament
How easily upset 2.61
(1.60) How loud crying when
up-set
How much crying 1.93
(1.21)
Difficulty to calm 1.79
(1.16) How often irritable 2.31
(0.85) How much smile/laugh 1.35
(0.86) How changeable is mood 2.20
(1.43)
Notes: Number of observations is 6. A star indicates statistical significance at the 5 percent level. Each row presents analysis of the indicated dependent variable. The first two columns show the results for the sample of 7–12 month olds, and the next two columns for the 13–24 month olds. For each sample we report the means (standard deviations) of the indicated variable for cohorts born prereform. We also report the coefficients (standard errors) for thePOSTvariable described in the text.
In Table 4, we continue the investigation by looking at security, development, and parental involvement. The first set of variables in the table measure the child’s reaction to new experiences, persons, and places and may provide some indication of the security they feel. The estimates are negative for persons and places, indicating better reactions, although not statistically significant. The final two variables provide overall assessments of the attention the child demands and the level of difficulty they present. The estimates for both variables for both age groups are negative, and both are statistically significant for the older age group.
In the next section of Table 4 are the variables for development. First is the estimate for motor and social development. This index is built up from questions about the child’s physical (ability to crawl, walk etc.) and cognitive/social (ability to say words, count, wash hands) capabilities.14We use a standardized score that is
set to have a population mean of 100 and standard deviation of 15. In application, scores within one standard deviation of the mean are interpreted to be in the range of average development. Baker, Gruber, and Milligan (2008) found a reduction in this measure of motor and social development with the increase of nonparental care from the Quebec universal childcare program. Here, the point estimates are negative for each age group, but also very small and statistically insignificant. Moreover, the individual YOB estimates in the Appendix 2 provide little evidence of a causal effect. The standard errors imply we have the power to detect impacts of more than 29 (28) percent of a standard deviation of the prereform mean in the younger (older) sample.
If we believe the motor and social development measure captures early cognitive skills, then this result suggests that the cognitive effects of early maternal full-time employment reported for older children in other studies do not have a manifestation at the younger ages we examine here.15However, we also note that our result
con-trasts with some previous observational evidence of the effect of maternal care on motor and social development using NLSCY data.16
The next two variables record the age at which certain developmental milestones are attained. We report the results for only two of the five milestones collected in the survey, because changes in the wording of the questions across waves render the interpretation of the others difficult. For both the age at which the child first sat up and the age at which they took their first steps the estimated coefficients are statistically indistinguishable from—and very close to—zero.
The final set of variables in Table 4 captures interactions between parents and children that may enhance later cognitive development. Each measure expresses the
14. Bodnarchuk and Eaton (2004) find that parent reports of motor and milestone measures perform quite well in their validation exercise.
15. These effects of full-time employment are typically found starting at age three, although this is in turn the age at which cognitive testing starts to be performed more intensively.
frequency of the indicated interaction on a five-point scale ranging from 1 indicating rarely to 5 indicating daily. In almost all cases the estimates are small and statistically insignificant, indicating no change in the frequency of the interaction with the in-crease in maternal care. The exception is an inin-crease in storytelling for the older age group, although interpretation of this result is complicated by the lack of any effect for the younger children. A limitation of these variables is that the highest frequency recorded is daily, so these variables are not able to capture a change in the intensity of a daily interaction.
In general, most results in Tables 3 and 4 show no impact—but there are a few statistically significant effects. However, in an analysis with this many regressions, a certain number of statistically significant estimates will be obtained by chance. An examination of theYOB estimates in Appendix 2 provides a check if these results are causally related to the reform. To gain another perspective, we turn to a com-parison group analysis of the mothers likely not eligible for the extended maternity leave as they show little attachment to the labor force postbirth. Specifically, we compare those who returned to work within 12 months of birth to those who did not; the former sample should have a much higher level of treatment. Recall that we used this strategy for the labor supply results in the discussion of Table 1 and found the estimate from the sample of mothers who returned to work within a year sat amid our estimates of the treatment on the treated by the scaling methods.
The results of this analysis are presented in Table 5. We expect the estimates from the sample of mothers who returned within a year of birth to be larger than the estimates in Tables 3 and 4 by a factor of between 1.33 and 1.57. We expect the estimates for the complementary sample to be close to zero. There is some evidence of this pattern for the calming variable, with a much smaller coefficient on the sample of mothers who did not return to work. The estimate in the sample of children whose mother did return to work within a year is almost statistically sig-nificant and almost 25 percent larger than the corresponding estimate in Tables 3 and 4. This gives some indication that the calming result is robust. For the attention, difficulty, and stories variables, however, we do not find robustness as the estimates in both columns of the table are similar. The mothers who were likely not eligible show, if anything, a larger effect—although in no cases are the impacts in the two samples statistically distinct. This suggests that the significant results in Tables 3 and 4 might be driven by common trends occurring to all mothers, rather than something that is occurring as a result of the maternity leave reform. Therefore, this investigation further limits our conclusions, indicating that the increase in time at home had little impact on the development variables in the NLSCY.
VII. Interpretation
Table 4
Estimated Impact of Longer Maternity Leave Mandates on Child Security, Physical Development, and Parental Involvement
Children aged 7–12
Response to new things (7–12)
Response to new person 2.84 (1.82) Response to new place 2.19
(1.46) How much attention
re-quired Overall difficulty of child 1.99
(1.28)
Motor and social score 98.81 (15.20) Age at which child sat up 5.77
(1.44) Age at which child took
first steps
Parent reads to child 4.30 (1.15) Parent teaches new words 4.25
(1.42) Parent tells story 4.08
(1.40) Parent plays action games 4.89
(0.48)
Table 5
Estimated Impact of Longer Maternity Leave Mandates on Measures of Behavior in Selected Samples Aged 13–24 months
Children whose mothers returned to work within
12 months of birth
All other Children
Difficulty to calm 0.223
(0.090)
0.091 (0.092) How much attention
re-quired
ⳮ0.091 (0.094)
ⳮ0.159 (0.154) Overall difficulty of child ⳮ0.186*
(0.049)
ⳮ0.218* (0.058)
Parent tells story 0.067
(0.075)
0.110 (0.056)
Notes: Number of observations is six. A star indicates statistical significance at the 5 percent level. Each row presents analysis of the indicated dependent variable. The first column shows the results for the sample of children with a mother who returns to work within 12 months of the birth. The second column shows the results for the sample of all other children. Reported is the coefficient (standard errors) for thePOST variable described in the text.
other studies. Furthermore, our first stage is very strong: We examine large changes in full-time maternal work and full-time nonparental care that previous studies iden-tify as important.
A priori, the developmental variables we examine provide a reasonable summary of facets of a child’s progress that could be affected by a change in care. For example, without committing to the direction of the effect, a child’s attainment of certain motor or social milestones or her/his behavioral reaction to changes in places or new persons could depend on whether the majority of his/her care is currently provided by the mother, or in a home-based childcare arrangement. We also note that these same NLSCY measures have proved responsive to changes in maternal care in previous studies. For example, Sherlock, Synnes, and Koehoorn (2008) uses the same motor and social development scale from the 1998–99 NLSCY wave, comparing the children of mothers who return to work at different times postbirth. They measure impaired development as being more than one standard deviation below the mean and find that children of mothers who return to work have higher odds of impaired motor and social development than children of mothers who don’t return. This effect is strongest for return to work within the first year of life. Baker, Gruber, and Milligan (2008) use a variety of the developmental, family, and motor and social measures from the NLSCY finding a negative impact on child develop-ment from a large increase in nonparental care that resulted from a change in child-care subsidies in the province of Quebec.
If the effects are not present, some caution in interpretation is still needed. One possibility is that our identification strategy more effectively addresses omitted vari-ables bias, and there truly are no detrimental effects of early maternal employment. Another interpretation is that we are only able to observe the children up to age 29 months, and in the future some impacts will become evident. That is, the impact may lie dormant and manifest only at older ages. This possibility has precedence in the literature. For example, Brooks-Gunn, Han, and Waldfogel (2002) report nega-tive impacts of early maternal employment on cogninega-tive scores at age 36 months, but not at 15 months or 24 months. Also, our measures are mostly noncognitive, as part of our purpose is to search for mechanisms for a positive cognitive impact of the reform that we would expect to find at older ages on the basis of past studies. It will be possible to test the dormant effect and no effect hypotheses with future waves of the NLSCY, which will provide observations on pre and post-reform birth cohorts at older ages as well as several cognitive test scores.
If instead there are effects on nonparental care at very young ages but the variables in the NLSCY do not capture them, then there are potentially important implications for survey design. While parent-reported measures of development have their critics, they are part of the content of most children’s surveys because they are cost effec-tive, can be updated on a regular basis through a remote interview, and are generally viewed as being informative about many dimensions of development. If measures of the type available in the NLSCY cannot capture changes that are occurring, then reliance on common parent-reported responses might need review.
A related important issue is the intended purpose of the questions asked about infants. Identifying children who are at risk of developmental delay is one objective. However, a survey that is effective in identifying at-risk children may not be effec-tive in capturing changes in development in the more advantaged population of two-parent families that we study. The tension raised here is the one identified in the introduction: The evaluation of universal public policies may require different evi-dence than the evievi-dence traditionally used to analyze at-risk families.
VIII. Conclusions
Our study offers three important advantages. First, we address the selection prob-lem generated by unobserved correlates through our exploitation of a policy reform that allows us to view similar families under different policy regimes. Second, the impact of the reform is at ages 6–12 months, a range identified as critical to devel-opment is past research. Finally, we study a heterogeneous group of children, which may be more relevant to the evaluation of universal child policies than experimental evidence using only children at risk.
Our analysis focuses on only one dimension of the possible benefits of an increase in maternity leave entitlements. For example, the increase in time at home also may facilitate longer periods of breastfeeding that may in turn have beneficial effects on children’s and mothers’ health. Baker and Milligan (2008a) show that the reform studied here did indeed increase the duration of breastfeeding within the first year of life—by more than one month.17They also find, however, no effects on a
col-lection of mother reported measures of their child’s and own health. Another poten-tial benefit of the reform is an increase in the proportion of mothers returning to the prebirth jobs, which may preserve job or match specific capital and address the “family gap” in female earnings (Waldfogel 1998). Baker and Milligan (2008b) report that maternity leave mandates in Canada do have this effect on job continuity. Our primary conclusion is that this change in maternal care had little effect on child development up to two years of age, but this conclusion has two alternative interpretations, which generate topics for future research. First, the development impacts of the changes we analyze may manifest at older ages. Second, the parent-reported measures of child development we use, common to many surveys, may not capture the changes in development induced by the maternity leave reforms.
Appendix 1
Income-Effect Simulations
The aim of the simulation is to see the impact of paid parental leave on take-home pay. We start with the Survey of Labour and Income Dynamics, a large survey of incomes and labor market behavior. We select married/cohabitating women aged 20–40 who have worked 600 hours or more and are therefore eligible for Employ-ment Insurance maternity leave benefits. From this sample, we calculate percentiles of the earnings distribution and use these percentiles to form simulated families. To each woman, we add a husband/partner earning $60,000. The husband’s earnings do not affect the wife’s maternity leave entitlement, but do have some impact on income taxes and on refundable tax credits which are income-tested at the family level.
Using the Employment Insurance (EI) benefit formula, we calculate the weekly Employment Insurance benefit for each simulated woman. The statutory replacement rate is 55 percent, but there is also a two-week waiting period with a zero percent
replacement rate, which lowers the effective replacement rate over the span of the leave. The maximum benefit in this time period was $412.50 per week, or 55 percent of the weekly $750 insured maximum.
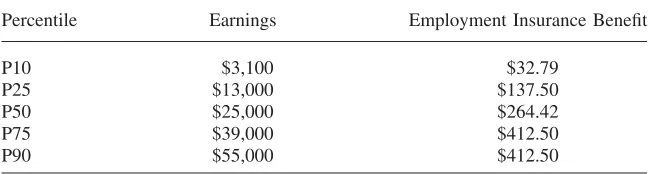
The resulting earnings percentiles for 2003 are in the Table A1, alongside the corresponding weekly EI benefit.
Table A1
Earnings and Employment Insurance Benefits by Percentile in 2003
Percentile Earnings Employment Insurance Benefit
P10 $3,100 $32.79
P25 $13,000 $137.50
P50 $25,000 $264.42
P75 $39,000 $412.50
P90 $55,000 $412.50
The simulation considers two scenarios. In the first, the mother is on EI benefits for the maximum weeks allowed. In the second, the mother is working and paying for childcare.
For the time in the labor market, we assign the family childcare costs of $40 per day, or $880 per 22 working-day month. This amount is considered eligible for the childcare deduction, which has a cap at $7,000. Looking at the earnings levels, the P10 earning woman does not even cover the cost of paid childcare ($10,560 an-nually).
Using a detailed tax simulator, the Canadian Tax and Credit Simulator (CTaCS), we calculate the after tax position of the family in each of the two scenarios, ac-counting for earned income, EI benefits, childcare deductions, and refundable child tax credits. We repeat the exercise for all years between 1998 and 2003, using the CPI to adjust the earnings and childcare amounts. For tax purposes, we assume the family lives in the largest province, Ontario.
Table A2
Replacement Rate by Year and Earning Percentile
Mother’s Earning Percentile
Year P10 P25 P50 P75 P90
1998 ⳮ0.48 4.11 1.07 0.80 0.67
1999 ⳮ0.38 4.74 1.09 0.81 0.64
2000 ⳮ0.32 4.29 1.09 0.81 0.61
2001 ⳮ0.37 3.37 1.03 0.84 0.62
2002 ⳮ0.57 3.77 1.06 0.84 0.61
2003 ⳮ0.38 2.62 1.05 0.83 0.55
For median earning mothers, the after-tax, after-childcare replacement rate is slightly larger than 100 percent, meaning that the 55 percent statutory replacement rate through the EI system more than compensates a median earning mother who has to pay for market childcare and taxes if she works. There is little change before and after the extension of leave. For women at the 10th percentile, the replacement rate is negative, because at their wage level the return to work after taxes and paid childcare is negative, leading the denominator of the replacement rate to be negative. For women at the 25th percentile, the replacement rate is over 100 percent, since the return to work after taxes and paid childcare is a small positive number. The EI benefits far exceed the after-tax and after-childcare earnings for these women. There is a small shift in this replacement rate after 2001. Finally, at higher incomes (75th and 90th percentiles) the replacement rate falls beneath one.
Appendix 2
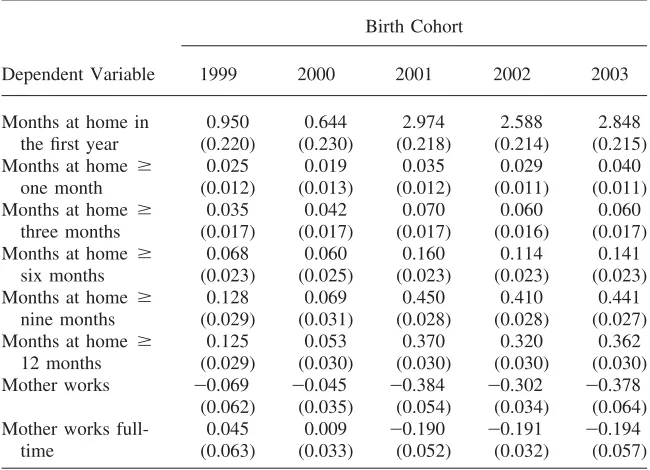
Table A3
Estimated Impact of Longer Maternity Leave Mandates on Time Not at Work
Birth Cohort
Dependent Variable 1999 2000 2001 2002 2003
Months at home in the first year Months at home ⱖ
one month Months at home ⱖ
three months Months at home ⱖ
six months Months at home ⱖ
nine months Months at home ⱖ
12 months Mother works ⳮ0.069
(0.062)
Notes: Number of observations is 6,605, except 2,121 in last two rows. Each row presents analysis of the indicated dependent variable. Reported are the regression coefficients on the␥t
Table A4
Estimated Impact of Longer Maternity Leave Mandates on Work and Care Decisions
Birth Cohort
Dependent Variable 1999 2000 2001 2002 2003
Ages 7–12 months sample
In care 0.036
Work and care 0.007
(0.063)
No work and care 0.029
(0.026)
No work and no care 0.043
(0.061)
Own home-based care 0.024
(0.050) Other’s home-based care ⳮ0.003
(0.061) Licensed other’s home-based care ⳮ0.001
(0.032) Unlicensed other’s home-based care ⳮ0.002
(0.059) Hours of care if in care 1.827
(2.885) Ages 13–24 months sample
In care ⳮ0.026
Work and care ⳮ0.062
(0.036)
No work and care 0.036
(0.018)
No work and no care 0.062
Table A4(continued)
Own home-based care 0.001
(0.026) Other’s home-based care ⳮ0.042
(0.032) Licensed other’s home-based care ⳮ0.005
(0.018) Unlicensed other’s home-based care ⳮ0.037
(0.029)
Notes: For the ages 7–12 months sample the number of observations is 2,121 for all regressions except the last row where it is 824. For the ages 13–24 months sample the number of observations is 4,469 for all regressions except the last row where it is 2,283. Each row presents analysis of the indicated dependent variable. Reported are the regression coefficients on the␥tyear of birth effects from Equation 1, with year
of birth 1998 as the excluded cohort. Robust standard errors are in parentheses.
Table A5
Estimated impact of longer maternity leave mandates on measures of parenting family outcomes and children’s development
Birth Cohort
Dependent Variable Observations 1999 2000 2001 2002 2003
Ages 7–12 months sample
Positive parenting 2,078 0.007 (0.267) Family functioning 2,063 0.408
(0.736) How easily upset 2,113 0.020
(0.186) How much crying 2,114 0.088
(0.155) Difficulty to calm 2,114 0.047
(0.164) How often irritable 2,109 ⳮ0.067
Table A5(continued)
Average mood 1,057 ⳮ0.342
(0.146) Adapts well to bad 2,110 ⳮ0.026
(0.129) Motor/social score 1,982 ⳮ4.917
(2.070) Age at which child
sat upa Age at which child
took first stepsa
527 ⳮ0.139
Parent tells storya 1,474 0.063
(0.185) Ages 13–24 months sample
Positive parenting 4,303 0.232 (0.154) Family functioning 4,298 0.134
(0.366) How easily upset 4,441 ⳮ0.031
(0.125) How much crying 4,447 ⳮ0.043
(0.100) Difficulty to calm 4,445 0.024
(0.118) How often irritable 4,435 ⳮ0.005
Table A5(continued)
Average mood 4,446 ⳮ0.019
(0.075) Adapts well to bad 4,439 ⳮ0.059
(0.088) Motor/social score 4,326 1.559
(1.128) Age at which child
sat upa Age at which child
took first stepsa
3,436 ⳮ0.040 Parent tells storya 3,554 ⳮ0.039
(0.110)
Notes: Each row presents analysis of the indicated dependent variable. Reported are the number of obser-vations and regression coefficients on the␥t
year of birth effects from Equation 1, with year of birth 1998 as the excluded cohort. Robust standard errors are in parentheses.
a. Data are not available for the 1998 birth cohort for these variables so year of birth 1999 is the excluded birth cohort.
References
Baker, Michael, and Kevin Milligan. 2008a. “Maternal Employment, Breastfeeding, and Health: Evidence from Maternity Leave Mandates.”Journal of Health Economics
27(4):871–87.
———. 2008b. “How Does Job-Protected Maternity Leave Affect Mothers’ Employment?”
Journal of Labor Economics26(4):655–91.
Baker, Paula, Canada Keck, Frank Mott, and Stephen Quinlan. 1993.NLSY Child Hand-book-Revised Edition: A Guide to the 1986–1990 National Longitudinal Survey of Youth Child Data set. Columbus, Oh.: Center for Human Resource Research.
Belsky, Jay. 2006. “Early Childcare and Early Child Development: Major findings of the NICHD Study of Early Childcare.”European Journal of Developmental Psychology
3(1):95–110.
Bernal, Raquel, and Michael Keane. 2007. “Childcare Choices and Children’s Cognitive Achievement: The Case of Single Mothers.” Bogota: Universidad de los Andes. Bertrand, Marianne, Esther Duflo, and Sendhil Mullainathan. 2004. “How Much Should We
Trust Difference in Difference Estimates?”Quarterly Journal of Economics119(1):249– 75.
Bloom, Howard. 1984. “Accounting for No-Shows in Experimental Evaluation Designs.”
Evaluation Review8(2):225–46.
Bodnarchuk, Jennifer, and Warren Eaton. 2004. “Can Parent Reports be Trusted?” Journal of Applied Developmental Psychology25(4):481–90.
Brooks-Gunn, Jeanne, Wen-Jui Han, and Jane Waldfogel. 2002. “Maternal Employment and Child Cognitive Outcomes in the First Three Years of Life: The NICHD Study of Early Childcare.”Child Development73(4):1052–72.
Cawley, John, and Feng Liu (2007), “Mechanisms for the Association between Maternal Employment and Child Cognitive Development.” Cambridge Mass.: National Bureau of Economic Research Working Paper No. 13609.
De Los Reyes, Andres, and Alan Kazdin. 2005. “Informant Discrepancies in the Assessment of Childhood Psychopathology: A Critical Review, Theoretical Framework, and Recom-mendations for Further Study.”Psychological Bulletin131(4):483–509.
Donald, Stephen, and Kevin Lang. 2007. “Inference with Difference in Differences and Other Panel Data.”Review of Economics and Statistics89(2):221–33.
Dustmann, Christian, and Uta Scho¨nberg. 2008. “The Effect of Expansions in Leave Coverage on Children’s Long-Term Outcomes.” Bonn: Institute for the Study of Labor Working Paper No. 3605.
Haider, Steven J., Alison Jacknowitz, and Robert F. Schoeni. 2003. “Welfare Work Require-ments and Child Well-being: Evidence from the Effects on Breastfeeding.”Demography
40(3):479–97.
Hanratty, Maria, and Eileen Trzcinski. 2009. “Who Benefits from Expanded Paid Parental Leave? Impact of Parental Benefit Expansions in Canada on Mothers’ Employment after Birth.”Journal of Population Economics. 22(3):693–711.
Heckman, James, Robert Lalonde, and Jeffrey Smith. 1999. “The Economics and Econometrics of Active Labor Market Programs.” InHandbook of Labor Economics, Volume 3,ed. Orley Ashenfelter and David Card, 1865–2097. Amsterdam: Elsevier.
Heckman, James, Stixrud, Jora, and Sergio Urzua. 2006. “The Effects of cognitive and Non-cognitive Abilities on Labor Market Outcomes and Social Behavior.” Journal of Labor Economics24(3):411–82.
Karoly, Lynn, Greenwood, Peter, Everingham, Susan, Hoube´, Jill, Kilburn, Rebecca, Rydell, Peter, Sanders, Matthew, and James Chiesa. 1998.Investing in Our Children: What We Know and Don’t Know about the Costs and Benefits of Early Childhood Interventions. Santa Monica, Calif.: Rand Corporation.
Loeb, Susanna, Margaret Bridges, Daphna Bassok, Bruce Fuller, and Russell Rumberger. 2007. “How Much is Too Much? The Influence of Preschool Centers on Children’s Social and Cognitive Development.”Economics of Education Review26(1):52–66.
Magnuson, Katherine A., Christopher Ruhm, and Jane Waldfogel. 2007. “Does Prekindergar-ten Improve School Preparation and Performance?” Economics of Education Review
Milligan, Kevin, and Mark Stabile. 2007. “The Integration of Child Tax Credits and Welfare: Evidence from the Canadian National Child Benefit Program.”Journal of Public Economics
91(1–2):305–26.
Rydz, David, Michael Shevell, Annette Majnemer, and Maryam Oskoui. 2005. “Topical Re-view: Developmental Screening.”Journal of Child Neurology20(1):4–21.
Sherlock, Rebecca, Anne Synnes, and Mieke Koehoorn. 2008. “Working Mothers and Early Childhood Outcomes: Lessons from the Canadian National Longitudinal Study on Children and Youth.”Early Human Development84(4):237–42.
Solon, Gary, Warren Whatley, and Ann Huff Stevens. 1997. “Wage Changes in Intrafirm Job Mobility over the Business Cycle: Two Case Studies.” Industrial and Labor Relations Review50(3):402–15.
Statistics Canada. 2006.The Daily,November 1.
Waldfogel, Jane. 1998. “Understanding the “Family Gap’ in Pay for Women with Children.”
Journal of Economic Perspectives12(1):137–56.
———. 2006.What Children Need. Cambridge MA: Harvard University Press.