Full Terms & Conditions of access and use can be found at
http://www.tandfonline.com/action/journalInformation?journalCode=vjeb20
Download by: [Universitas Maritim Raja Ali Haji] Date: 11 January 2016, At: 22:20
Journal of Education for Business
ISSN: 0883-2323 (Print) 1940-3356 (Online) Journal homepage: http://www.tandfonline.com/loi/vjeb20
Teaching Business Statistics in a Computer Lab:
Benefit or Distraction?
Linda R. Martin
To cite this article: Linda R. Martin (2011) Teaching Business Statistics in a Computer Lab: Benefit or Distraction?, Journal of Education for Business, 86:6, 326-331, DOI: 10.1080/08832323.2010.529958
To link to this article: http://dx.doi.org/10.1080/08832323.2010.529958
Published online: 29 Aug 2011.
Submit your article to this journal
Article views: 400
View related articles
ISSN: 0883-2323 print / 1940-3356 online DOI: 10.1080/08832323.2010.529958
Teaching Business Statistics in a Computer Lab:
Benefit or Distraction?
Linda R. Martin
University of New Haven, West Haven, Connecticut, USA
Teaching in a classroom configured with computers has been heralded as an aid to learning. Students receive the benefits of working with large data sets and real-world problems. However, with the advent of network and wireless connections, students can now use the computer for alternating tasks, such as emailing, web browsing, and social networking. Do these distractions diminish the benefits of the computers? An experiment was conducting comparing exam scores in two different classes, one class held in a traditional classroom and another class taught in a computer lab classroom. Holding constant other factors such as student’s ability and demographics, the results show a small negative effect from conducting class in a computer equipped classroom.
Keywords: computer lab, distractions, grades, statistics
As colleges and universities expand the use of technology in the classroom, more and more classes are being held in rooms equipped with PCs or laptops. Although traditionally only languages and computer science classes would conduct ses-sions in a computer lab, nowadays many business and most engineering classrooms are located in rooms supplied with computers installed with software that has been developed to enhance learning in a specific field. On many campuses computer-assisted pedagogy is considered a component of active learning (Shakarian, 1995) and active learning is en-couraged (Bonwell & Eison, 1991; Hamer, 2000). Because active learning has been shown to be superior to lectures in promoting students’ skills, there has been an implicit assump-tion that the use of computers enhances learning. However, the power of computer software to reinforce course mate-rial and increase student participation may be strongly chal-lenged by the distractions an Internet-connected PC or laptop may create. The focus of this study is to measure the effect of computer availability on student learning in which stu-dent learning or performance are calculated by exam scores. Two classes were conducted, each in a different environment. One class was held in a computer lab–configured classroom and the other class was held in a traditional classroom with a chair-and-desk design. This study differs from other research
Correspondence should be addressed to Linda R. Martin, University of New Haven, College of Business, 300 Boston Post Road, West Haven, CT 06516, USA. E-mail: [email protected]
on computer use because in this case the two comparison classes were run during the same semester with the same in-structor, thereby eliminating differences in exam scores that may arise from other extraneous factors.
Early results on the use of computers in classrooms were positive. Bonwell and Eison (1991) cited meta-analyses at the University of Michigan that found that when computers were used students mastered more content, learned more quickly, were more positive about their classes, and developed a greater appreciation for computer operations. Sullivan and Pratt (1996) found that writing scores significantly increased in ESL classrooms equipped with computers. However, more recent empirical studies have not been able to strongly jus-tify classroom computer use. Many studies conclude that there is little or no significant difference between student per-formance when taught in a technology-enhanced format as compared with traditional face-to-face instruction. In a con-trolled experiment in which students were either permitted to use laptops or prevented from using laptops, Hembrooke and Gay (2003) observed that students scored lower on multiple-choice and recall questions after listening to a lecture when they were allowed to use laptops. Fried (2008) found that the more use students made of laptops during a class, the lower their class performance as measured by test scores.
One reason for the difference between the early studies and later ones is that the computers in the early studies were standalone or locally networked computers. Nowadays with computers directly connected to the Internet or with a laptop picking up the Internet from the almost ubiquitous wireless
TEACHING BUSINESS STATISTICS IN A COMPUTER LAB 327
systems available on most campuses, student have the ability to divert their attention from class-related activities to other forms of online behavior such as e-mailing, playing video games, surfing the web, and participating in social network-ing sites. These types of distraction can also be observed when students bring their own laptops to class. As students acquire laptops for personal use and become accustomed to using them for note taking and other types of communication, the frequency of bringing the laptops to class has increased. Recently, several articles about the use of laptops in col-lege classrooms have appeared in news journals such as the
Wall Street Journaland theChronicle of Higher Education
(Bugeja, 2007; Chanen, 2007; Foster, 2008; McWilliams, 2005; Read, 2006; Young, 2006). Professors have been up-set by distracted students and the complaints made by fellow students who are disturbed by viewing nearby web browsing. Some instructors have banned the use of laptops or requested that a wireless-blocking device be installed in their class-rooms.
Distractions in the classroom are nothing new. Doodling and daydreaming are common occurrences. Distraction can even take the form of using class time to complete assignments for other classes. However, Internet availability provides greater opportunity to interact socially and receive divergent information while apparently listening to a lecture or demonstration. Causal observation indicates that students frequently are not on task. Skolnik and Puzo (2008) observed that two-thirds of their students used the laptop for nonacademic pursuits. Furthermore, the use of computers may have other deleterious effects. In a survey of students and faculty perceptions, students reported that they felt that the computers had enhanced course instruction, but increased distraction and dishonesty (Skolnik & Puzo).
METHOD
To test the effect on the learning environment, I conducted an experiment to isolate the direct influence of in-class use of a computer. Unlike other studies, in this experiment computers were integrated into the course (Fried, 2008). During the fall 2009 semester, I taught two sections of the same course in introductory business statistics. The course is a required class for all business majors. One section was taught in a computer -lab where each student sat in front of a PC. The PCs had an Internet connection as well as Microsoft Office and other in-structional software installed. The second section was taught in a typical classroom. In both classes, I had a PC that was connected to an overhead projector. With me teaching identi-cal material, the possibility of interactive effects was lessoned (M. Johnson & Kuennen, 2006). Furthermore, an analysis of the student evaluation of teaching showed no difference in the students’ perception of the instructor or satisfaction with the course.
Several years prior to the experiment, two changes were made in the business statistics course. First, the department had decided to emphasize the use of Excel for solving statis-tics problems because of its prevalent use in business. Sec-ond, as more computer lab classrooms became available, a greater number of sections of business statistics were as-signed to these classrooms. It was assumed that the use of computers would improve the transfer of knowledge and the subsequent recall of content matter because theoretical stud-ies on multichannel communication or multiple experiential techniques have indicated that if information is presented by two or more ways, there is reinforcement and greater reten-tion (Ellis, 2001; Hamer, 2000; Jensen & Sandlin, 1992). For both experimental classes, the objective method of learning was employed. The course was designed to use worked-out problems rather than the problem-solving form of instruction because worked-out examples may result in greater effort by students with little prior knowledge of the field (Halabi, Tuovinen, & Farley, 2005).
Identical statistical material was covered in both classes. Each class consisted of a verbal lecture in which a concept was explained while the outline was projected on an over-head screen using PowerPoint. After a topic was presented, I demonstrated the solution of the problem using Excel. The demonstration could be observed on the overhead screen. The students in the computer lab could also copy my steps on their own PCs. Finally, I assigned a similar problem. In the computer lab class, students completed the problem in-dependently. Students in the traditional class observed the second problem worked out by me. Students were allowed to question me at any time.
Students were given three exams during the course of the semester. The exam score was considered the measure-ment of the student’s performance. The exam consisted of problems obtained from the text (Levin, Stephan, Krehbiel, & Berensen, 2005) and other similar introductory statistical textbooks. Most of the problems required the use of Excel. The exams were designed to measure students’ ability to formulate the problem correctly and choose the correct sta-tistical method. The exam score was based on a scale from 0 to 100. The exams were identical in both classes, although there were two versions given within each class to prevent cheating. One version was printed on white paper and the other on a pastel-colored paper, thus minimizing the effect of color (Fordham & Hayes, 2009). The exams for both classes were held in computer labs.
RESULTS
The average scores for each exam are presented in Table 1. The students’ grades in the traditional classroom for each of the exams were statistically significantly higher than students in the computer classroom. The students in the traditional classroom scored about 10 points higher on each exam. The
TABLE 1
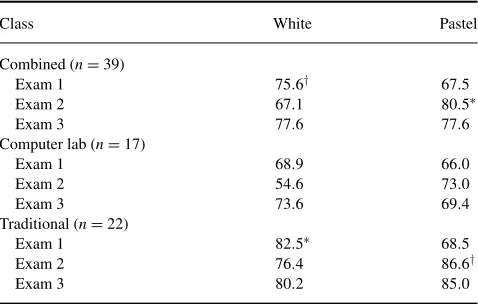
distribution of grades was approximately normal with the exception of Exam 2 (computer lab class section). The actual grade received by the student was curved so that the students were not penalized for being in the computer lab classroom. Although the course content and instructor were identical, the time of day in which the sections were scheduled were different. A comparison to two similar sections taught in the prior year during the same time frame indicated that the average scores on the exams were unaffected by time of day. Although care was taken to match each question with its counterpoint on the other exam, some differences in the test version by color were observed (see Table 2). Combining the two classes and comparing the grades, the average score was significantly higher for the white test in Exam 1 and the pas-tel test in Exam 2. When considering each class separapas-tely, scores in the computer lab class were not significantly differ-ent for any of the versions of the tests, whereas the traditional class grades were better on the white test in Exam 1 and the pastel test in Exam 2. To test whether there were interactive effects between class and test version, an analysis of variance (ANOVA) was calculated. Because the sample sizes differed, the ANOVA computations followed the procedure given in Cohen (2002). No interactive effects were observed.
To isolate the effect of class environment on exam scores, three multiple regression analyses were undertaken with each of the exam scores as the dependent variable. A similar methodology was used by Ball, Eckel, and Rojas (2006),
TABLE 2
Average Grade on Exam, by Test Version
Class White Pastel
Grove and Wasserman (2006), and Fried (2008) to deter-mine the impact of the various factors that may influence a student’s grade. In addition to the class environment, factors likely to affect scores are student’s ability or academic ap-titude, student effort, and other demographics such as race, gender, major, and years of school experience. An attempt was made to collect these data.
Several measures of ability were available from the uni-versity registrar: score on the mathematics section of the SAT (MSAT), grade earned in the university-required mathemat-ics course (MATH), grade earned in the business school’s prerequisite course in quantitative analysis (QA), and grade point average (GPA) after the completion of the course. Two measures of effort were possible to observe: homework grade and attendance. Research has shown that attendance and ef-fort play a significant role in exam performance (Durden & Ellis, 1995; D. Johnson, Joyce, & Sen, 2002). However, other empirical studies observed that there may be an omitted vari-able bias in which effort is correlated with other factors such as ability and motivation (Stanca, 2006). Furthermore, there were some suspected structural problems in the collection of the data. Although homework was regularly assigned with the understanding that the results would represent individual effort, cooperation among students could not be controlled. Attendance was also compromised because students who ar-rived late to class were often recorded as absent. Therefore, because of theoretical problems and structural issues, these variables were not used in the analysis.
Demographic data on a number of factors were collected. Because gender had been found to be a factor in performance (Anderson, Benjamin, & Fuss, 1994; Tay, 1994), data were collected based on visual identification. In particular, gender was considered a possible strong factor because M. Johnson and Kuennen (2006) found that women do significantly better in introductory statistics classes. Race has also been consid-ered a determining factor in performance (Durden & Ellis, 1995). However, although the factor may be termedrace, the variable used generally representsminority. It was not pos-sible to correctly classify students as members of minority groups. The number of African American students could be identified, and although these numbers were small, they are reported but not used in further analysis. Credits completed (including transfer credits) were also obtained, with the credit numbers, the students’ year in school (i.e., freshman, sopho-more, junior, senior) could be computed. Also, all students in both classes were business majors. Descriptive statistics on each variable are presented in Table 3.
The students in the two classes differed in a significant ways. First, the students in the traditional classroom had higher mathematics SAT scores, received better grades in the university-required mathematics class (MATH), and earned a higher GPA. Because there was little or no difference in the other demographic variables (credits earned, race, gender), it can be asserted that the students in the traditional classroom had greater ability. To check whether this phenomenon was
TEACHING BUSINESS STATISTICS IN A COMPUTER LAB 329
TABLE 3 Descriptive Statistics
Statistic Computer lab Traditional classroom
Number of students 17 22
Average GPA 2.96 3.25†
Average Math SAT 490 544.5∗
Average QA 2.72 3.09
Average MATH 2.57 3.17†
Number of credits (n=39) 58.8 59.9
% Female 0.35 0.5
% Race 0.18 0.18
Number of sophomores 10 13
Number of juniors 6 8
Number of seniors 1 1
Note.For QA and MATH, grades ranged from 1.0 to 4.0. †p<.10.∗p<.05.
due to the class time (i.e., brighter students are more likely to take advantage of the course selection process and, thereby, register for the better time slot), an analysis was conducted on the prior year’s two classes and this difference was not observed.
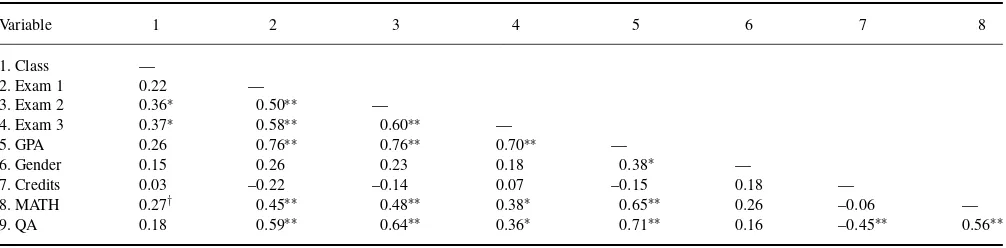
Because there were several measures of ability and these measures have been shown to be correlated with the de-mographic variables, correlation measures were calculated to check for collinearity. Before the correlation matrix was computed and because the sample size was small (n=39), a decision was made regarding missing data. To maintain as many observations as possible, a hot-deck procedure to handle missing data was used in several cases. This method replaces missing data with the actual value from a similar case (Tsikriktsis, 2005). Complete observations were obtained for GPA, credits earned, grade, race, and gender. One student had not completed the quantitative analysis course, but based on his mathematics skills, a grade of C was inferred. Scores on the university’s mathematics course were missing in 6 cases. However, the reasons for the missing grades were given in the student’s file and a grade could be inferred. (Transfer
credit was assigned a B, testing out of the class was assigned an A, and receiving AP credit was assigned an A.)
There were four cases of missing mathematics SAT scores, which were primarily associated with students who had trans-ferred to the university and scores could not be assigned. Therefore, a correlation matrix with mathematics SAT and listwise deletion of the four observations was computed and compared to the correlations with all observations and with-out mathematics SAT. The results were consistent. Even though mathematics ACT has been found to be significantly related to grades in statistics courses, the elimination of four observations in an already small sample was considered pro-hibitive (M. Johnson & Kuennen, 2006; Tsikriktsis, 2005), and thus the remainder of the results presented include all the observations. The correlation matrix without mathemat-ics SAT score is presented in Table 4.
As shown in Table 4, GPA was highly correlated to the exam scores. As a measure of ability, GPA was also highly re-lated to grades in university and college courses (MATH and QA). The grades earned in these courses were also highly correlated to each other as well as the exam scores. This suggests that the use of all these measures in a regression equation could lead to multicollinearity. Also, because M. Johnson and Kuennen (2006) found that having taken calcu-lus is not related to statistic course performance, a decision was made to include only GPA as the predictor variable of ability. Other significant correlations show that the number of credits earned is negatively related to grades in the college calculus course (QA). This relationship can be explained by the fact that this course was designed as a sophomore-level class. Students taking the course, who are juniors, were prob-ably required to take remedial mathematics courses prior to taking the university-required mathematics course, thereby delaying their ability to complete the next level of courses. Gender (a dummy variable whose value was 0 for man and 1 for woman) was positively related to GPA, indicating that female students did better overall.
A number of different regression estimations were exam-ined using the various influencing factors. The estimation
TABLE 4
Pearson Correlation of Ability and Demographic Factors
Variable 1 2 3 4 5 6 7 8
Note.For class, 0=computer classroom and 1=traditional classroom. For gender, 0=male and 1=female. †p=.10.∗p=.05.∗∗p=.01.
TABLE 5 Linear Regression
Dependent variable
Explanatory variable Exam 1 Exam 2 Exam 3
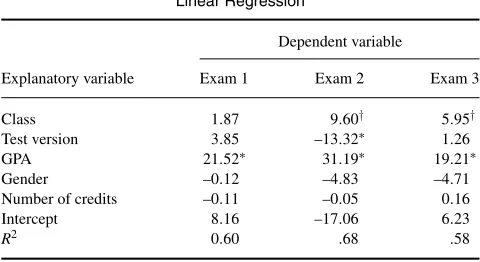
Class 1.87 9.60† 5.95†
Note.For class, 0=computer classroom and 1=traditional classroom. For test version, 0=white and 1=pastel. For gender, 0=male and 1= female.
†p=.10.∗p=.05.
selected for presentation was chosen because it had a high adjustedR2. The coefficients were stable over different es-timations and diagnostic tests on the residuals revealed no significant departure from the assumptions of normality, non-collinearity, and homoscedasticity of error terms. The results are presented in Table 5.
Overwhelmingly, the most important predictor of exam score was GPA. The coefficient for GPA was significant in all three equations and the value of the coefficient indicated that GPA had the most impact on exam scores. Overall, better students did well regardless of the class in which they were enrolled. Class environment was significant for Exams 2 and 3, but not for Exam 1. For Exams 2 and 3, the effect of being in a traditional classroom raised the exam score by 9 and 6 points, respectively. This corresponds to approximately one letter grade for the course. Thus, the improved classroom performance anticipated by having a computer available to students to encourage active learning was diminished by the ability of the students to use the computer for other tasks. The difference in scores is even more striking when considering that the students in the computer classroom were required to use Excel to solve problems during at least half of the class, and thus, were unable to randomly peruse the Internet. I en-couraged students to stay on task during the problem-solving period by circulating around the classroom and collecting the printed-out results.
DISCUSSION
Because student composition and predictors of exam scores were comparable to other introductory statistics classes and economics research studies, the results of this study can be extended to other types of classes. Additionally, although the research for this study was undertaken during one semester, two equivalent classes had been held in the prior year (same times, same semester, in a computer lab), which could be
used for comparison. Regression analysis for the predictor of exam scores for students in these prior classes show the same emphasis on GPA. The students in the comparison classes were similar in ability and demographics, thus allowing for an isolation of the effect of being in a traditional classroom. Furthermore, because the computers were integrated into the classroom activity, the level of distraction would be less than if students were allowed to use laptops unsupervised during the entire class period. If the distraction created by the use of computers can lead to a drop in one letter grade, then an even greater decrease may be observed when students are permitted to randomly peruse the web.
Even though the implications of this research can be ex-tended to other classes, the study was limited in several ways. First, the class sizes were small, thereby reducing the number of predictor variables that could be used in the regression. Secondly, for some unspecified reason, students in the tradi-tional class had greater ability than students in the computer class and in the prior year’s classes.
Finally, the results of the present study indicate that the utilization of an active learning procedure may not always improve performance. Active learning requires that students are engaged in the process. The use of PCs or laptops provides a method for the student to disconnect from the classroom environment and gains from active learning may be reduced. This research suggests that other forms of active learning should be employed or, if the class must be held in a computer classroom, mandatory supervision (or use of a block out system) should be maintained.
ACKNOWLEDGMENTS
The author wishes to thank Nancy Baker, University Under-graduate Registrar, for providing much of the data quickly, conveniently, and graciously.
REFERENCES
Anderson, G., Benjamin, D., & Fuss, M. (1994). The determinants of suc-cess in university introductory economics classes.Journal of Economic Education,25, 99–119.
Ball, S., Eckel, C., & Rojas, C. (2006). Technology improves learning in large principles of economics classes: Using our WITS.The American Economic Review,96, 442–446.
Bonwell, C., & Eison, J. (1991).Active learning: Creating excitement in the classroom. ASHE-ERIC Higher Education Report No. 1. Washington, DC: The George Washington University, School of Education and Human Development.
Bugeja, M. (2007, January 26). Distractions in the wireless class-room. The Chronicle of Higher Education. Retrieved from http:// chronicle.com/Distractions-in-the-Wireless/46664
Chanen, J. S. (2007). Profs kibosh students’ laptops.ABA Journal,93, 16. Cohen, B. (2002). Calculating a factorial ANOVA from means and standard
deviations.Understanding Statistics,1, 191–203.
TEACHING BUSINESS STATISTICS IN A COMPUTER LAB 331
Durden, G., & Ellis, L. (1995). The effects of attendance on student learning.
The American Economic Review,85, 343–346.
Ellis, T. (2001). Multimedia enhanced educational products as a tool to promote critical thinking in adult students.Journal of Educational Mul-timedia and Hypermedia,10, 107–123.
Fordham, D., & Hayes, D. (2009). Worth repeating: paper color may have an effect on student performance.Issues in Accounting Education,24, 187–194.
Foster, A. (2008, May 22). Professor considers laptop ban after reading about distracted student.The Chronicle of Higher Education. Retrieved from http://chronicle.com/blogPost/Professor-Considers-Laptop-/3956/ Fried, C. (2008). In-class laptop use and its effects on student learning.
Computers & Education,50, 906–914.
Grove, W., & Wasserman, T. (2006). Incentives and student learning: A natural experiment with economics problem sets.The American Economic Review,96, 447–452.
Halabi, A., Tuovinen, J., & Farley, A. (2005). Empirical evidence on the rel-ative efficiency of worked examples versus problem-solving exercises in accounting principles instruction.Issues in Accounting Education,20(1), 21–32.
Hamer, L. (2000). The additive effects of semistructured classroom activi-ties on student learning: An application of classroom-based experiential learning techniques.Journal of Marketing Education,22(10), 25–34. Hembrooke, H., & Gay, G. (2003). The laptop and the lecture: The effects of
multitasking in learning environments.Journal of Computing in Higher Education,15(1), 46–64.
Jensen, R., & Sandlin, P. (1992). Why do it? Advantages and dangers of new waves of computer-aided teaching/instruction.Journal of Accounting Education,10, 39–60.
Johnson, D., Joyce, B., & Sen, S. (2002). An analysis of student effort and performance in the finance principles course.Journal of Applied Finance,
12(2), 67–72.
Johnson, M., & Kuennen, E. (2006). Basic math skills and performance in an introductory statistics course.Journal of Statistical Education,14(2), 1–12.
Levin, D., Stephan, D., Krehbiel, T., & Berensen, M. (2005).Statistics for manager: Using Microsoft Excel(5th ed.). Upper Saddle River, NJ: Pearson Education.
McWilliams, G. (2005, October 14). The laptop backlash: Wireless class-rooms promote messaging and web surfing, not learning, professors say.
Wall Street Journal, B1.
Read, B. (2006, March 22). No laptops allowed. The Chronicle of Higher Education. Retrieved from http://chronicle.com/blogPost/No-Laptop-Allowed/2095/
Shakarian, D. (1995). Beyond lecture: Active learning strategies that work.
Journal of Physical Education, Recreation, and Dance,66, 21–24. Skolnik, R., & Puzo, M. (2008). Utilization of laptop computers in the
school of business classroom.Academy of Educational Leadership Jour-nal,12(2), 1–10.
Stanca, L. (2006). The effects of attendance on academic performance: Panel data evidence for introductory microeconomics. Journal of Economic Education,37, 251–263.
Sullivan, N., & Pratt, E. (1996). A comparative study of two ESL writ-ing environments: A computer-assisted classroom and a traditional oral classroom.System,24, 491–501.
Tay, R. (1994). Students’ performance in economics: Does the norm hold across cultural and institutional settings?Journal of Economic Education,
25, 291–301.
Tsikriktsis, N. (2005). A review of techniques for treating missing data in OM survey research.Journal of Operations Management,24, 53– 62.
Young, J. (2006, June 2). The fight for classroom attention: Profes-sor vs. laptop. The Chronicle of Higher Education. Retrieved from http://chronicle.com/article/The-Fight-for-Classroom/19431