Vol. 10, 2016-32 | December 14, 2016 | http://dx.doi.org/10.5018/economics-ejournal.ja.2016-32
Comparing Persistence of Product and Process
Innovation: A Discrete-Time Duration Analysis of
Innovation Spells
David Córcoles, Ángela Triguero, and María Carmen Cuerva
Abstract
The main purpose of this paper is to analyse the influence of previous experience and learning capabilities on survival in product and process innovation for Spanish manufacturing firms in the period 1990–2010. The authors find past and path dependence and confirm the important effect of R&D effort in both types of innovation. Nevertheless, for product innovation, the level of appropriability and the fact of operating in a high-tech sector are more crucial for persistence in comparison with process innovation.
(Published in Special Issue Recent Developments in Applied Economics) JEL O31 O32 L22 L60
Keywords Persistence in innovation; product innovation; process innovation; discrete-time duration models; Spanish firms
Authors
David Córcoles, Universidad de Castilla-La Mancha, Spain, [email protected]
Ángela Triguero, Universidad de Castilla-La Mancha, Spain
María Carmen Cuerva, Universidad de Castilla-La Mancha, Spain
1
Introduction
The phenomenon called “persistence of innovation” is an important topic in the literature on innovation (Antonelli et al., 2012a). The persistence of innovative behavior is identified if a firm which innovates once has a higher probability of innovating again in subsequent periods. Thus, a firm’s past experience in innovation has a positive effect on current innovation.
There are plenty of empirical studies on measuring the degree of persistence in innovation using the number of patents, the R&D effort or innovation output indicators as proxy variables (Flaig and Stadler, 1994; Malerba and Orsenigo, 1999; Cefis and Orsenigo, 2001; Cefis, 2003; Rogers, 2004; Duguet and Manjon, 2004; Cabagnols, 2006; Mañez-Castillejo et al., 2009; Peters, 2009; Raymond et al. 2010; Triguero and Córcoles, 2013). But, as far as we know, only a few studies measure the degree of persistence in innovation considering innovative spells,i.e., periods of time during which the firm innovates year after year without gaps in its activity (Geroski et al., 1997; Le Bas et al., 2003; Cabagnols, 2003; Jang and Chen, 2011). Therefore, the objective of this paper is to study the persistence of innovative activity by type of innovation. Although the duration analysis has been used in prior work to distinguish between persistent and occasional innovators, our purpose is to determine survival in innovation activities using discrete-time duration models. This methodology enables us to solve the main limitations of continuous-time duration models typically used in the existing literature (unob-served heterogeneity and the proportional hazard assumption).
topic should be considered. As far as we know, Clausen et al. (2012) is the only study that distinguishes among different sources of persistence in both types of innovation. The availability of a panel-data of more than 20 years and the use of a discrete-time duration model allow us to accomplish this task and to make the distinction between the degree of persistence in product and process innovation. Building upon the dynamic capabilities framework, we present a model that examines the role of learning capabilities in innovation persistence. In this regard, we argue that the ability to be constant in R&D activities, appropriability conditions, technological opportunities and previous episodes of innovation are crucial to current innovative behavior. Nevertheless, these learning capabilities may affect persistence differently considering both types of innovation activities. Hence, the main purpose of our research is to test whether previous experience and learning capabilities have a different influence on persistence in product and process innovation.
This paper contributes to previous literature in several ways. First, we use an empirical methodology that solves some of the problems of prior work based on duration analysis to measure persistence in innovative activity. We model persistent innovative activity by the number of successive years in which a firm innovates (innovation spells) instead of investigating whether firms that innovate in time t innovate in time t+1. For this purpose, we use discrete-time duration models to measure the degree of persistence in innovation. Secondly, we explicitly distinguish between the differences among process and product innovations related to the phenomenon of innovative persistence. To do that, interactions are used in the estimated models. Hence, differentiated patterns of persistence depending on previous experience in each type of innovation are identified. Finally, we jointly measure past and path dependence in product and process innovations. For this purpose, we consider the degree of innovation persistence in the past (past dependence), the number of previous innovative spells and other internal and external determinants of innovation (path dependence).
2
Literature review and theoretical framework. The
determinants of persistence
The volume of literature about persistence in innovation is growing, but it is focused mainly on explaining the probability of doing R&D or innovation without distinguishing different types of innovation. As far as we know, only a few related studies recognize the potential dissimilarities among the degree of persistence of process and product innovations.
Given the complexity of innovation process, firms have to design their innovation strategy and choose between product innovations, process innovations or both. Although most of the studies recognized that there is complementarity between product and process innovation (Reichstein and Salter, 2006), a different pattern of persistence should be considered. Some empirical literature indicates that product innovation is more persistent than process innovation (Martínez-Ros and Labeaga, 2009; Antonelli et al., 2012a); persistence is found for product but not for process innovation (Parisi et al., 2006), or its scale and significance differ between both of them (Clausen et al., 2012). In this regard, the diversity of inno-vative strategies must be considered.
According to Antonelli et al. (2012b), two quite different explanations for innovation persistence can be noted. The first one links innovation persistence with a phenomenon where the probability of introducing an innovation at time “t” is indeed influenced by the introduction of an innovation at time “t–1”. This definition tries to measure the observed persistence exclusively attributable to the fact of being a persistent innovator in the past (past dependence). The second one is closely related to the resource-based theory of the firm and dynamic capabilities, where innovation persistence is linked with internal characteristics and learning capabilities of firms (including the existence of previous episodes of persistent or occasional innovations) and the changing context in which they are localized (path dependence).
Martínez-Ros and Labeaga (2009) confirm that persistence in process innovation is more affected by the business cycle than persistence in product innovation in a sample of Spanish manufacturing firms from the period 1990– 1999. In the same sense, Antonelli et al. (2012a) found that process innovations are characterized by lower levels of long-term stability than product innovations. They argued that the distinction between past dependent and path dependent process is important for explaining the differences between persistence in product and process innovations in a sample of 451 Italian manufacturing companies during the years 1998–2006. The authors conclude that innovation, especially product innovation, is not only past dependent, as many studies confirm, but also path dependent. Persistence in both types of innovation (product and process) are past dependent, but based upon the previous literature, we formulate the following hypothesis:
Hypothesis 1 (H1): Previous experience (past and path dependence) are decisive to explain the persistence in innovation but past dependence is more important for process innovation while path dependence is more important for product innovation.
Innovation outcomes depend not only on previous innovative episodes: Firm-dynamic capabilities also matter. Indeed, learning capabilities are crucial in generating innovations. The resource-based view (RBV) of the firm provides a theoretical framework for exploring the influence of these experience capabilities in innovation persistence. In this work, we assume that firms accumulate knowledge as a strategic asset through R&D and appropriation of returns of innovation (patents).
successful innovation because of high knowledge accumulation. This explanation is based on two arguments. First, knowledge accumulation enhances the probability of future innovation, the so-called “success breeds success” principle (Flaig and Stadler, 1994; Geroski et al., 1997). Second, the “learning by doing” effect must be taken into account in the persistence of innovative activities (Peters, 2009). While the link between R&D and innovation has been the objective of numerous studies, different influence of R&D on product and process innovation can be found. Despite R&D is positively related to product innovation, new products not only are designed but they also need to be produced more efficiently (Deschryvere, 2014). That means that R&D not only enhances product innovation, they also contribute to greater process innovation. In other words, process innovation constitutes a mediating factor in the relation between R&D intensity and product innovation (Cohen and Kleppler, 1996; Raymond and St-Pierre, 2010). However, R&D activities (product and process) are more associated to product innovation. According to the previous literature, our hypothesis is:
Hypothesis 2 (H2): A continuous effort in R&D is crucial for innovation persistence but it is more important for persistence in product innovations than for persistence in process innovations.
Another important factor that should be considered is the appropriability of innovation results. The evidence suggests that appropriability is one of the factors shaping the probability to innovate. In this regard, a minimum degree of appropriability is necessary to motivate innovation (Dosi et al., 2006). Although the individual effect of appropriability on persistence has not often been considered in the literature, the degree to which a firm can protect its innovative capabilities from its competitors through patents, trade secrets or utility models should be taking into account (Malerba and Orsenigo, 1999; Cefis and Orsenigo, 2001). Thus, the appropriability regime positively affects the degree of persistence in innovation, but we expect a different effect on the degree of persistence of product and process innovations given that product innovations are more prone to be patented than process innovations (Arundel and Kabla, 1998). Although we know that appropriability conditions differ among firms, we hypothesize that:
Hypothesis 3 (H3): The level of appropriability enhances persistence in product innovation to a higher extent than persistence in process innovation.
( )
In this regard, the role of technological opportunities is considered. Technological opportunities assess ease of innovation in a particular sector, taking into account R&D differences by industry (Cohen and Levinthal, 1989). These approaches are mainly associated with the opportunity for radical innovations under specific industry-level conditions. In this regard, firms operating in high-tech industries must be more likely to be persistent in innovation because of their proximity to the technological frontier (Lelarge, 2006; Raymond et al. 2010; Huang and Yang, 2010). According to Clausen et al. (2012), the dynamics of product and process innovation differ depending on the industry in which the firm operates. In this regard, product innovation is more frequent in high-tech firms, while the strategy of process innovation is more usual in low-tech firms. Since we also need to take into account technological opportunities to explain the different determinants of persistence in both types of innovation, we assume that:
Hypothesis 4 (H4): Technological opportunities are more important for persistence in product innovations than for persistence in process innovations.
3
Methodology
Following Geroski et al. (1997), we define the degree of innovation persistence through the definition of spells. In other words, persistence is measured by the number of consecutive years during which the firm has an innovative output. The main aim of empirical studies of duration data is to analyse the exit probability of the spell in the year “t” conditioned by having remained in this spell at least “T” years. This conditional probability is called the “hazard rate” --the “hazard” function in continuous terms. Formally, the hazard rate is defined as the probability of a firm’s ceasing to be an innovator at moment “t” conditioned to have been innovative before “t”. Thus, a negative dependency between “t” and the hazard rate indicates a situation of survival of innovation (persistence). By defining “ni” as the number of innovative firms in period “t” (both complete and censured observations are included) and “hi” as the number of firms stopping innovation exactly at “t”, the hazard rate is calculated in the following way:
From expression (1), the survival function as the complementary distribution function of the hazard rate is defined as:
(2)
where
s
(t) is the probability of remaining in the current spell given a period of time “t”. The higher the value of the survival probability, the larger the persistence of the innovation. If we have a sample of spells of different durations (different “T”), the hazard and survival functions can be calculated using the non-parametrical approach proposed by Kaplan-Meier (1958). Note that this method controls for the right-censoring problem but not for the left-censoring problem. Given the random sample of innovative manufacturing firms, the number of consecutive years of innovation for each one is calculated (see Kiefer, 1988).1Since it is possible to interrupt and restart innovation for several times, firms can have multiple spells. The more times the innovation is interrupted and restored, the greater the number of spells and the lower their average duration.
From a dynamic point of view, duration models quantify the influence of different variables on the likelihood of persistence in a specific event (Van der Berg, 2001). Therefore, this empirical methodology is especially suitable for the purpose of this paper.
Previous literature has used both methodologies to analyse the persistence of innovation: continuous models (Cabagnols, 2003; Geroski et. al., 1997; Le Bas et al., 2003 and Jang and Chen, 2011) and discrete-time duration models (Triguero et. al., 2014a). Nevertheless, continuous time models suffer some efficiency drawbacks because of difficulties with ties in the dependent variable, lack of control for unobserved heterogeneity and the assumption of proportional hazards (Brenton et al., 2010; Fugazza and Molina, 2016). Discrete-time models (probit, logit or complementary logit) allow us to solve inherent problems to traditional continuous-time models. Cloglog presents two advantages in comparison with other discrete-time models (as a logit or probit): Firstly, cloglog results are the most comparable to the continuous-time Cox model given that both present the
_________________________
same grouped-duration (Hess and Persson, 2012). Secondly, cloglog uses a more flexible frailty function than probit or logit models (Heckman and Singer, 1984). In empirical terms, cloglog is the discrete-time model implemented in most of software programmes.2 Furthermore, it is the most used in recent literature (Görg
et al., 2007; Brenton et al., 2010; or Triguero et al., 2014a are some examples). Thus, taking into account these advantages, we estimate a discrete-time duration model based on a random-effects complementary log-log (cloglog) model. In all cases, probit results are very similar without significant differences in comparison to cloglog model.3
Note that duration models do not measure the unconditional probability of a given spell duration (i.e., the probability of maintaining an innovation exactly five years) but it is able to estimate the conditional probability (i.e., the likelihood of ceasing innovation in the sixth year conditioned to persistence during the previous five years) (Kiefer, 1988). This conditional probability is the dependent variable and it is known as the “hazard rate” (see equation 1). The general model specification for the random- effect model is:
( )
t
β
t
in
itβ
X
itε
iµ
itφ
=
1.
+
21
+
+
(3)where ‘t.in’ is a variable that identifies the type of innovation of the current spell (product or process); �1�� = (�11��,�12��, … ,�1���) is a vector that includes the state dependence variables: the previous spell duration and the number of previous spells; �2�� = (�21��,�22��, … ,�2���) is a vector of explanatory variables considered: R&D activities, having (or not having) patents, technological degree, years in the current spell and other control variables such as size, industrial sector and current year; β=(�1,�2,�3, … ,��) is the vector of associated coefficients; �� is the error term that controls for time-invariant fixed effects from a random sample and ��� is the independent error term (mean zero and constant variance).
Equation 3 does not provide possible differences in the effect on persistence of X1 and X2 by types of innovation. To do this, it is necessary to implement an alternative specification with interaction coefficients (Buis, 2010 and Diaz-Mora et al., 2015).
_________________________
Starting from equation (3), ’t.in’ is the interacted variable and the general
Interaction terms let us isolate the effect of the explanatory variables on the persistence of innovation (
β
1,
β
2,
β
3 coefficients), controlling for possible distortions due to significant differences by type of innovation (β
4,
β
5 coeffi-cients). For example, it is possible to determine the R&D impact on the persistence of total innovation, considering and quantifying at the same time the possible existence of relevant differences in the R&D effect on the persistence of product and process innovation. These results could not be obtained with two separate models for product and process innovation.4
Data and variables
4.1
Data
To accomplish our research objectives, we use firm-level data for the period 1990-2010 from the Survey of Business Strategies (ESEE, Encuesta sobre Estrategias Empresariales) compiled by the Spanish Ministry of Science and Technology. ESEE is, by definition, an unbalanced panel containing an average sample of around 1,800-2,000 firms surveyed yearly for all the industrial sectors that are consistently most representative of the Spanish manufacturing sector. The coverage of the data set is mixed: a random sample for small companies (with fewer than 200 employees) and a complete sample for large firms (with more than 200 employees).
those whose changes require more time (i.e., innovation outcome, R&D expenditures).
The ESEE data set allows us to construct innovative spells by considering all types of innovation as well as separately taking into account process and product innovations. In addition, it also allows us to identify other influencing factors at the firm-level.
4.2
Variables
Dependent variable
For each firm, we construct our dependent variable on the basis of the yes/no question about the introduction by the firm of new products and processes in a specific year. We identify whether an innovation is introduced in a given year and how long innovative activity is continued without interruption.
Our interest is focused on the length of time a firm is continuously innovating. Therefore, we calculate the discrete exit probability of an innovation spell, in other words, the hazard rates of the current innovative spell (see Table in the Annex 1). Spells are built considering product and process innovation separately. When firms reports product and process innovation simultaneously, they will be registered twice in a given year. This situation does not give rise to econometric problems because the reference unit of the panel data is the spell instead of the firm and the time unit is the duration of current spell instead of the current year in survival models.
State-dependent variables
previous innovative spells, measures the influence of previous episodes of innovation regardless of their duration (Doiron and Gørgens, 2008). A high number of previous spells should indicates a large number of short innovative episodes, therefore we expect a negative relationship between the number of previous spells and persistence.4 Thus, we measure part of the path innovative
dependence with this variable taken into account that the rest of explanatory variables also measure path dependence.
Explanatory variables
The existence of sunk costs and learning by doing effects associated with R&D spending justifies the inclusion of the persistence degree in R&D activities. Technological capabilities in the present are the basis for future innovations and their existence encourages the firm to adopt a persistent innovation strategy. We introduce a categorical variable considering all R&D movements regarding the previous year: Beginning R&D, stopping R&D, keeping R&D or holding without R&D.
In relation to previous experience in appropriation of returns associated with innovative activities, patents establish ownership rights, protecting innovators against imitators or potential free riders. To proxy this variable, we use a dummy that takes the value 1 if the firm has registered any patents in t and 0 otherwise.5
Technological degree is proxied by the classification of industries based on the OECD taxonomy that distinguishes among manufacturing industries by their level of technological intensity. Additionally, the number of years in the current spell lets us to analyse the probability of ceasing innovations considering the consecutive years with innovations. Finally, control variables are introduced: sectorial dummies, firm size in terms of the number of employees and current year.
_________________________
4 A more detailed explanation about the suitability of using the number and the duration of previous spells can be found in Fritjers (2002).
5
Main results
5.1
Survival analysis
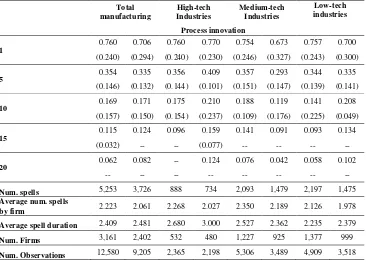
Table 1 presents the probability of survival in innovation, distinguishing between product and process innovations. While the probability of survival in process innovation at least one year is more than 76%, this probability is around 70% for product innovation. These probabilities decrease up to 35% and 33.5% in the 5th year. However, the probability of survival in product is higher than in process in the 15th year (11.5% for process and 12.4% for product) and the difference increases up to two points in the 20th year (6.2% for process and 8.2% for product). Although neither of the differences in the average duration of spells are noteworthy (2.409 years for process and 2.481 years for product under three years for both types of innovation6), the higher number of spells for process innovation
compared with product innovation confirms that process innovation is more usual than product innovation. However, there is not necessarily a direct relationship between frequency and persistence in innovation.
Given our hypothesis that the dynamics of product and process innovation might differ depending on the industry in which the firm operates, Table 1 shows the survival rates according to the technological level in the sector. As we can see, firms in high-tech industries have a higher probability of survival in product innovation, whereas firms belonging to a medium-tech sector hold a higher probability of survival in process innovation. Firms operating in low-tech sectors have a higher probability of survival in process innovation during the first few years, while this probability is higher for product innovation over time. Furthermore, the highest probability of survival after 20 years is also found in product innovation for firms in high-tech industries.
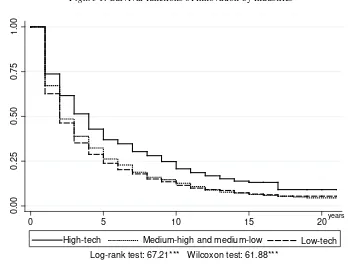
The survival functions also confirm the low degree of survival of innovation over the period 1990–2010 by industries (Figure 1). The decreasing slope of the function from 4th year onwards shows that the probability of survival decreases as long as the duration of the spell increases. These results lead us to the conclusion that persistence in innovation is low in the initial stages (the survival function
_________________________
Table 1: Survival rates and descriptive statistics for spells in process and product Note: Hazard rates in brackets.
decreases quickly), but after 5–6 years, survival rates remain nearly constant. Furthermore, we find significant differences among industries. From the 2nd year onwards, the survival curve of innovation in high-tech industries is above the curve of the rest of the sectors. Thus, high-tech manufacturers are more prone to consolidate innovation than medium and low-tech industries. In this regard, belonging to high–tech industries reduces the risk of ceasing innovative activities.
Figure 1: Survival functions of innovation by industries
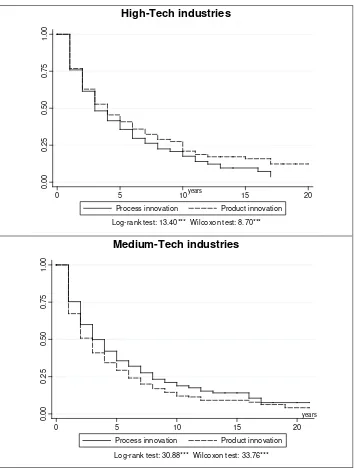
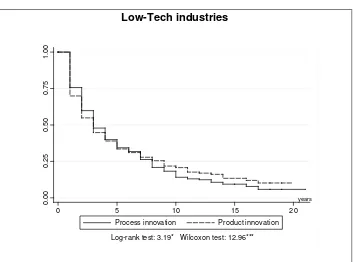
17 years and only 9.6% of firms maintain their process innovation for 15 years (15.9% in product innovation). By contrast, process innovation is more frequent and more persistent than product innovation in medium-tech industries over the whole period. Finally, an erratic innovative performance in low-tech industries is found. During the first 7 years, the survival rate is higher in process innovation but product innovation is more persistent afterwards.
5.2
Econometric results
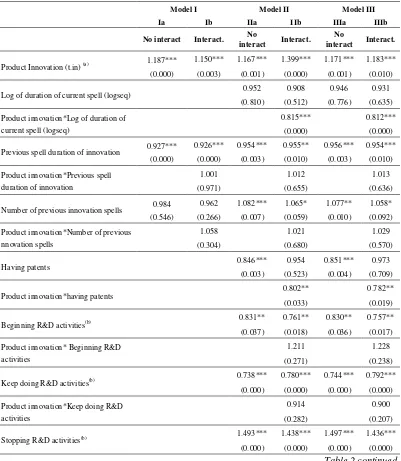
Table 2 presents the results of the estimations with and without interactions. Three models are estimated. The first one (Model I) only includes the variables related to
0.
00
0.
25
0.
50
0.
75
1.
00
0 5 10 15 20years
Medium-high and medium-low
High-tech Low-tech
Figure 2: Survival functions of process and product innovation by industries
High-Tech industries
Medium-Tech industries
0.
00
0.
25
0.
50
0.
75
1.
00
0 5 10years 15 20
Process innovation Product innovation Log-rank test: 13.40*** Wilcoxon test: 8.70***
0.
00
0.
25
0.
50
0.
75
1.
00
0 5 10 15 20
years
Low-Tech industries
the previous innovation experience (state dependence); the previous spell duration (past dependence) and the number of previous spells (path dependence). In the second estimation (Model II), the rest of the explanatory variables related to the dynamic capabilities of firms are introduced. Finally, sector dummies are included (Model III).7
Coefficients are shown in exponential form (odds ratios). In contrast to marginal effects, odds ratios are interpreted in multiplicative terms (Buis, 2010) or in other words, the rate of change in the hazard ratio derived from a one-unit change in the corresponding covariate. The hazard ratio is greater than one if the
_________________________
7 Following the classification purposed by Le Bas and Poussing (2014), we carry out additional estimations distinguishing between complex (both types of innovation) and single innovators (only one type). To do this, we introduce the number of years with product and process innovations to control for the effect of being a complex innovator. Findings are very similar to those obtained in table 2 (see Table A.3 in the Appendix).
0.
00
0.
25
0.
50
0.
75
1.
00
0 5 10 15 20
years
Process innovation Product innovation
Table 2: Results of random effects clog-log model(*)
Log of duration of current spell (logseq) 0.952 0.908 0.946 0.931 (0.810) (0.512) (0.776) (0.635) Product innovation*Log of duration of
current spell (logseq)
0.815*** 0.812*** (0.000) (0.000)
Previous spell duration of innovation 0.927*** 0.926*** 0.954*** 0.955** 0.956*** 0.954*** (0.000) (0.000) (0.003) (0.010) (0.003) (0.010) Product innovation*Previous spell
duration of innovation
1.001 1.012 1.013
(0.971) (0.655) (0.636)
Number of previous innovation spells 0.984 0.962 1.082*** 1.065* 1.077** 1.058* (0.546) (0.266) (0.007) (0.059) (0.010) (0.092)
Product innovation*having patents 0.802** 0.782** (0.033) (0.019)
Beginning R&D activities(b) 0.831** 0.761** 0.830** 0.757**
(0.037) (0.018) (0.036) (0.017) Product innovation* Beginning R&D
activities
1.211 1.228 (0.271) (0.238)
Keep doing R&D activities(b) 0.738*** 0.780*** 0.744*** 0.792***
(0.000) (0.000) (0.000) (0.000) Product innovation*Keep doing R&D
activities
0.914 0.900 (0.282) (0.207)
Stopping R&D activities(b) 1.493*** 1.438*** 1.497*** 1.436***
(0.000) (0.000) (0.000) (0.000)
Table 2: continued
Model I Model II Model III
Ia Ib IIa IIb IIIa IIIb
No interact Interact. interact No Interact. interact No Interact.
Product innovation*Stopping R&D activities
1.064 1.082 (0.596) (0.509)
High tech( c ) 0.861*** 1.066
(0.005) (0.306)
Product innovation*High tech 0.649*** (0.000)
Low tech( c ) 0.891*** 1.000
(0.006) (0.994)
Product innovation*Low tech 0.782*** (0.001)
Large firm( d) 0.975 0.855*** 0.955 0.839***
(0.528) (0.003) (0.267) (0.001)
Product innovation*Large firm(d) 1.319*** 1.321***
(0.000) (0.000)
Constant 0.233*** 0.236*** 0.402*** 0.392*** 0.379*** 0.393*** (0.000) (0.000) (0.000) (0.000) (0.000) (0.000)
Year control yes yes yes Yes
Industry control yes Yes
Log-likelihood -10,965 -10,964 -10,420 -10,387 -10,409 -10,388 (0.000) (0.000) (0.000) (0.000) (0.000) (0.000)
Rho 0.355 0.355 0.243 0.125 0.234 0.146 (0.000) (0.000) (0.000) (0.000) (0.000) (0.000) Number of firms 3,535 3,535 3,393 3,393 3,393 3,393 Number of spells 8,979 8,979 8,548 8,548 8,548 8,548 Observations 21,898 21,898 20,749 20,749 20,749 20,749
(a)Reference: Process innovation. (b)Reference: Keeping without R&D activities. (c)Reference:
Medium-tech industries. (d)Reference: Small firms. (*)Clog-log model has been estimated with the
corresponding coefficient negatively affects the duration of innovation, and vice versa. A ratio equal to one would imply no impact on persistence of innovation. Coefficients of interacted variables indicate the percentage difference between the impact of the explanatory variable with product innovation and the impact with process innovation.
Considering all the innovation spells (product or process) of a firm, the probability of stopping innovation (leaving the current spell) is around 1.15–1.47 times more likely in the case of product innovation than in process innovation. This result indicates a higher number of exits from the product innovation spells, but it does not mean that persistence in product innovation is lower than in process innovation. In fact, as the duration of the spell increases, the probability of exiting is 18% lower for the product innovation (variable product innovation*logseq). Therefore, in the initial years, it is easier for the firm to maintain the process innovation. Nevertheless, the probability of persistence increases if the firm is a product innovator in the middle and long term.
In relation to innovative experience (state dependence), the duration of the previous spell seems to have a higher impact on the exit probability of the innovation spell than the number of the previous spells, which is not significant (Model I). The higher the duration of the previous spell, the higher the duration of the current spell. In line with the empirical literature, we find a significant and positive past dependence between previous spell duration and survival in innovation for both types of innovations. This result suggests the past dependence behavior of innovation persistence. Nevertheless, the interaction of the variable with the type of innovation is not significant (H1 is partially not rejected).
If we introduce the rest of the explanatory variables (Models II and III), the number of previous spells significantly and negatively affects the probability of exiting. The higher the number of previous spells, the higher the exit rate of the current innovation spell. If we distinguish between both types of innovation, the coefficient is not significant (variable product innovation*number of previous spells), which means that there are no significant differences in the impact of the number of previous spells according to the type of innovation.
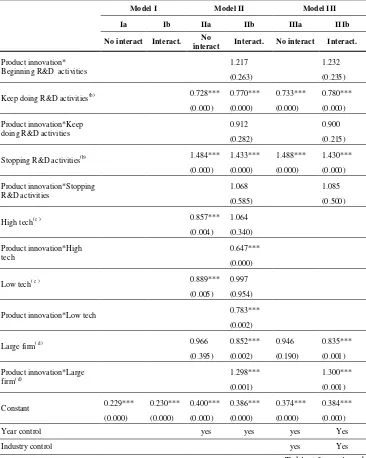
previous studies (Lelarge, 2006; Clausen et. al., 2012, Triguero and Córcoles, 2013). Finally in line with H2 hypothesis, the decision to stop R&D activities negatively affects the probability of leaving innovation between 45–50%. Therefore, being persistent in R&D has a great influence on the survival of innovations. Nevertheless, there are no significant differences according to the type of innovation
,
which leads us to conclude that R&D activities have a similar effect on both innovations (H2 is partially rejected).In addition, patents increase the probability of survival in the spell of innovation around 15% (coefficient “having patents” around 0.85 in specifications IIa and IIIa). Higher appropriability enhances persistence in innovation. If we distinguish between product and process innovation, we observe that this effect is only linked to product innovation (Model IIb and IIIb). The probability of exiting from product innovation for a firm with registered patents is notably lower than the probability of exiting from process innovation. These results support the idea that patents are stronger linked to product than process innovation (H3 is not rejected).
We find a positive relationship between size and the probability of innovation survival: large firms are more stable innovators. However, coefficients are only significant when interacted effect is considered, indicating that the influence on ceasing innovation differs by innovation types. Results suggest that larger firms have a higher probability of exit from product innovation than small firms. Therefore, product innovation could reduce the innovation gap between small and large firms. This results are in line with recent literature finding a non-significant relationship between product innovation and firm growth (Triguero et. al, 2014b) and a positive association between persistence of product innovation and sales growth only for small firms (Deschryvere, 2014). Additionally, large firms are more prone to consolidate its status using process innovations (Fritsch and Meschede, 2001).
35% higher than process innovation. Therefore, H4 is not rejected. This result is similar to Clausen’s (2012). Surprisingly, we find the same result for firms operating in low-tech sectors suggesting that product innovation is also the most suitable strategy to be persistent in a context of very low technological opportunities.
Thus a higher effect of technological opportunities and appropriability (in terms of patents) on persistence in product innovation is found. It means that, although there are no significant differences in the effect of the number of previous spells on product and process innovation, results report some evidence supporting the path character of product innovation noted by Artz et al. (2010).
6
Conclusions
This paper explores the influence of previous experience and learning capabilities on survival in innovation activities in Spanish manufacturing firms during the period 1990-2010. Using discrete time-duration analysis, we explicitly distinguish the differences in persistence between process and product innovations during 21 years.
We confirm that in spite of the fact that firms tend to maintain process innovation during the initial years, the probability of persistence is higher in product innovation over time. That means that the probability of exiting the current innovation spell is lower in product innovation as the duration of this spell increases. However, being persistent in innovation in the past (long previous spells) improves the probability of being persistent at the current moment for both types of innovation, taking into account innovation experience. Therefore, the past-dependence behavior of innovation is confirmed. However, there are not any significant differences between product and process innovation. On the other hand, the higher the number of previous spells, the higher the rate of exiting the current innovation spell. That means that firms with erratic behavior in the past in terms of innovation have a lower probability of being stable innovators. Similar to the effect of duration of the previous spell, there are no significant differences according to the type of innovation.
a continuous experience in product or process innovation have a lower probability of ceasing innovation than firms that have erratic experience in innovation. “What the firm can hope to do technologically in the future is narrowly constrained by what it has been capable of doing in the past” (Dosi, 1988, p. 1130).
We also investigate the influence of several drivers on persistence in innovation
,
taking into account the theoretical framework built on evolutionary approaches. Past innovation persistence affects the degree of current innovation persistence (past dependence) but also previous innovative experience enables firms to learn and face market changes and exogenous factors (path dependence). In particular, we have considered additional drivers related to learning capabilities of the firm, such as cumulative R&D effort, appropriability conditions and technological opportunities. The models report similar results in the alternative specifications,
confirming the robustness of our estimations. First, we confirm that being a continuous R&D performer increases the duration of innovation but there are not any significant differences between product and process innovation. At the same time, the decision of stopping R&D activities negatively affects the probability of stopping innovation. Second, we highlight the positive influence of previous experience in the appropriability on innovation, although this effect is only found in product innovation. Finally, firms that operate in high-tech sectors have a high probability of being persistent.university-industry networks and continuous innovation as a method of appropriation (Malerba and Torrisi, 1992; Segarra and Arauzo, 2008). We believe that further research is needed to explain the different behavior of leading and innovative firms in each industry to reveal to what extent firms that innovate once (it seems that does not matter in product or process innovations) have a higher probability of innovating again in subsequent periods.
References
Ai, C. and Norton, E.C. (2003). Interaction Terms in Logit and Probit Models. Economic Letters 80(1): 123–129.
http://www.sciencedirect.com/science/article/pii/S0165176503000326
Antonelli, C. (1997). The Economics of Path-Dependence in Industrial Organization. International Journal of Industrial Organization 15(6): 643–675.
http://www.sciencedirect.com/science/article/pii/S0167718797000064
Antonelli, C., Crespi. F., and Scellato. G. (2012a). Inside Innovation Persistence: New Evidence from Italian Micro-data. Structural Change and Economic Dynamics 23(4): 341–353. http://www.sciencedirect.com/science/article/pii/S0954349X12000136 Antonelli, C., Crespi F., and Scellato, G. (2012b). Internal and External Factors in
Innovation Persistence. Economics of Innovation and New Technology 22(3): 256–280. http://www.tandfonline.com/doi/abs/10.1080/10438599.2012.708135 Artz, K., Norman, P., Hatfield, D., and Cardinal, L. (2010). A Longitudinal of the Impact
of R&D. Patents and Product Innovation on Firm Performance. Journal of Product Innovation Management 27: 725–740.
https://www.researchgate.net/publication/227868721_A_Longitudinal_Study_of_the_
Impact_of_RD_Patents_and_Product_Innovation_on_Firm_Performance
Arundel, A., and Kabla, I. (1998). What Percentage of Innovations Are Patented? Empirical Estimates for European Firms. Research Policy 27(2): 127–141.
http://www.sciencedirect.com/science/article/pii/S004873339800033X
Audretsch, D.P. (2003). Entrepreneurship: A Survey of Literature. Enterprise Papers, 14. Enterprise Directorate-General. Brussels: European Commission.
Brenton, P., and Saborowski, C., and von Uexkull. E. (2010). What Explains the Low Survival Rate of Developing Country Export Flows? The World Bank Economic Review 24(3): 474–499.
Brouwer, E., and Kleinknecht, A. (1999). Innovative Output and a Firm Propensity to Patent. An Exploration of CIS Micro Data. Research Policy 28(6): 615–624.
http://www.sciencedirect.com/science/article/pii/S0048733399000037
Buis, M.L. (2010). Interpretation of Interactions in Non-linear Models. The Stata Journal 10(2): 305–308. http://www.stata-journal.com/sjpdf.html?articlenum=st0194
Cabagnols, A. (2003). Technological Learning and Firm Persistence in Innovation: A France/UK Comparison Based on a Cox Model of Duration.Working Paper Centre Walras. University of Lyon 2.
Cabagnols, A. (2006). Comparing Innovative Persistence Across Countries: A Cox Model of Patenting in the UK and France. In: Le Bas, C., and Latham, W. (Eds.). The Economics of Persistent Innovation: An Evolutionary View. Economics of Science. Technology and Innovation. Volume 31. Springer.
Cefis, E. (2003). Is there Persistence in Innovative Activities? International Journal of Industrial Organization 21(4): 489–515.
http://www.sciencedirect.com/science/article/pii/S0167718702000905
Cefis, E., and Orsenigo, L. (2001). The Persistence of Innovative Activities. A Cross-countries and Cross-sectors Comparative Analysis. Research Policy 30(7): 1139– 1158. http://www.sciencedirect.com/science/article/pii/S0048733300001396
Clausen, T.H., Pohjola, M., Sapprasert, K., and Verspagen, B. (2012). Innovation Strategies as a Source of Persistent Innovation. Industrial Corporate Change September 21(3): 553–585. http://icc.oxfordjournals.org/content/21/3/553.full
Cohen, W., and Kleppler, S. (1996). Firm Size and the Nature of Innovation within Industries: The Case of Process and Product R&D. The Review of Economics and Statistics 78(2): 232–243.
https://www.jstor.org/stable/2109925?seq=1#page_scan_tab_contents
Cohen, W., and Levinthal, D.A. (1989). Innovation and Learning: The Two Faces of R&D – Implications for the Analysis of R&D Investment. Economic Journal 99(397): 569–596.
https://www.researchgate.net/profile/Daniel_Levinthal/publication/4810910_Innovati
on_and_Learning_Two_Faces_of_RD/links/0fcfd5142b6aa00829000000.pdf
Deschryvere, M. (2014). R&D, Firm Growth and the Role of Innovation Persistence: An Analysis of Finnish SMEs and Large Firms. Small Business Economics 43(4): 743– 749. http://link.springer.com/article/10.1007/s11187-014-9559-3
Doiron, D., and Gørgens, T. (2008). State Dependence in Youth Labor Market Experiences and the Evaluation of Policy Interventions. Journal of Econometrics 145(1–2): 81–97.
http://www.sciencedirect.com/science/article/pii/S0304407608000523
Dosi, G. (1988). Sources, Procedures, and Microeconomic Effects of Innovation. Journal of Economic Literature 26(3): 1120–1171.
https://www.jstor.org/stable/2726526?seq=1#page_scan_tab_contents
Dosi, G., Marengo, L., and Pasquali, C. (2006). How Much Should Society Fuel the Greed of Innovators? On the Relations between Appropriability, Opportunities and Rates of Innovation. Research Policy 35(6): 1110–1121.
http://www.sciencedirect.com/science/article/pii/S0048733306001399
Duguet, E., and Manjon, S. (2004). Is Innovation Persistent at the Firm Level? An Econometric Examination Comparing the Propensity Score and Regression Methods. University of Paris I - Cahiers de la MSE Working Paper No. 2004(75).
https://papers.ssrn.com/sol3/papers.cfm?abstract_id=565923
Flaig, G., and Stadler, M. (1994). Success Breeds Success. The Dynamics of the Innovation Process. Empirical Economics 19(1): 55–68.
http://link.springer.com/article/10.1007/BF01205728
Fougère, D., Kramarz, F., and Magnac, T. (2000). Youth Employment Policies in France. European Economic Review 44(4–6): 928–942.
http://www.sciencedirect.com/science/article/pii/S0014292199000513
Fritjers, P. (2002) The Non-parametric Identification of Lagged Duration Dependence. Economic Letters 75(3): 289–292.
http://www.sciencedirect.com/science/article/pii/S0165176502000046
Fritsch, M., and Meschede, M. (2001). Product Innovation. Process Innovation and Size. Review of Industrial Organization 19(1): 335–350.
https://www.jstor.org/stable/41799051?seq=1#page_scan_tab_contents
Fugazza, M., and Molina, A.C. (2016). On the Determinants of Exports Survival. Canadian Journal of Development Studies 37(2): 159–177.
http://www.tandfonline.com/doi/pdf/10.1080/02255189.2016.1131674
Geroski, P.A., Reenen, J., and Walters, C.F. (1997). How Persistently do Firms Innovate? Research Policy 26(1): 33-48.
http://www.sciencedirect.com/science/article/pii/S0048733396009031
González, N., and Nieto, M. (2007). Appropriability of Innovation Results: An Empirical Study in Spanish Manufacturing Firms. Technovation 27(5): 280–295.
Görg, H., Kneller, R., and Muraközy, B. (2007). What Makes a Successful Export? CEPR Discussion Paper No. 6614.
https://papers.ssrn.com/sol3/papers.cfm?abstract_id=1140543
Harabi, N. (1995). Appropriability of Technical Innovations: An Empirical Analysis. Research Policy 24(6): 981–992.
http://www.sciencedirect.com/science/article/pii/0048733394008124
Heckman, J.J., and Singer, B. (1984). Econometric Duration Data. Journal of Econometrics 24(1–2): 63–132.
http://www.sciencedirect.com/science/article/pii/0304407684900757
Hess, W., and Persson, M. (2012). The Duration of Trade Revisited. Continuous-Time vs. Discrete-Time Hazards. Empirical Economics 43(3): 1083–1107.
http://link.springer.com/article/10.1007/s00181-011-0518-4
Hoetker, G. (2007). The Use of Logit and Probit Models in Strategic Management Research: Critical Issues. Strategic Management Journal 28(4): 331–343.
http://onlinelibrary.wiley.com/doi/10.1002/smj.582/abstract
Huang, C.-H., and Yang, C.H. (2010). Persistence of Innovation in Taiwan’s Manu-facturing Firms. Taiwan Economic Review 38(2): 199–231.
http://www.econ.ntu.edu.tw/ter/new/data/new/TER38-2/TER382-2.pdf
Jang, S.-L., and Chen, J.H. (2011).What Determines How Long an Innovative Spell Will Last? Scientometrics 86(1): 65–76.
http://link.springer.com/article/10.1007/s11192-010-0247-z
Joyce, J.P. (2005) Time Past and Time Present: A Duration Analysis of IMF Program Spells. Review of International Economics 13(2): 283–297.
http://onlinelibrary.wiley.com/doi/10.1111/j.1467-9396.2005.00504.x/abstract
Kaplan, E.L., and Meier, P. (1958). Nonparametric Estimation from Incomplete Obser-vations. Journal of American Statistical Association 53(282): 457–481.
http://www.jstor.org/stable/2281868?seq=1#page_scan_tab_contents
Kiefer, N. (1988). Economic Duration Data and Hazard Functions. Journal of Economic Literature 26(2): 646–679.
https://www.jstor.org/stable/2726365?seq=1#page_scan_tab_contents
Le Bas, C., and Poussing, N. (2014). Are Complex Innovators More Persistent than Single Innovators? An Empirical Analysis of Innovation Persistence Drivers. International Journal of Innovation Management 18(1).
http://dx.doi.org/10.1142/S136391961450008X
Lelarge, C. (2006). Les entreprises industrielles françaises sont-elles à la frontière technologique? Revue Economique 57(3): 473–484.
http://www.jstor.org/stable/25483768?seq=1#page_scan_tab_contents
Malerba, F., and Orsenigo, L. (1999). Technological Entry. Exit and Survival: An Empirical Analysis of Patent Data. Research Policy 28(6): 643–660.
http://www.sciencedirect.com/science/article/pii/S0048733399000050
Malerba, F., Torrisi, S. (1992). Internal Capabilities and External Networks in Innovative Activities: Evidence from the Software Industry. Economics of Innovation and New Technology 2(1): 49–71.
http://www.tandfonline.com/doi/abs/10.1080/10438599200000005
Máñez-Castillejo, J.A., Rochina-Barrachina, M.E., Sanchis, A., and Sanchis, J.A. (2009). A Dynamic Approach to the Decision to Invest in R&D: The Role of Sunk Costs. The Journal of Industrial Economics 57: 712–735.
Martínez-Ros, E., and Labeaga, J.M. (2009). Product and Process Innovation: Persistence and Complementarities. European Management Review 6(1): 64–75.
http://onlinelibrary.wiley.com/doi/10.1057/emr.2009.4/abstract
Parisi, M.L., Schiantarelli, F., and Sembenelli, A. (2006). Productivity, Innovation and R&D: Micro Evidence for Italy. European Economic Review 50(8): 2037–2061.
http://www.sciencedirect.com/science/article/pii/S0014292105001212
Peters, B. (2009). Persistence of Innovation: Stylised Facts and Panel Data Evidence. The Journal of Technology Transfer 34(2): 226–243.
http://link.springer.com/article/10.1007/s10961-007-9072-9
Raymond, W., Mohnen, P.A., Palm, F., and Van der Loeff, S.S. (2010). Persistence of Innovation in Dutch Manufacturing: Is It Spurious? The Review of Economics and Statistics 92(3): 495–504.
http://www.mitpressjournals.org/doi/pdf/10.1162/REST_a_00004
Raymond, L., and St-Pierre, J. (2010). R&D as a Determinant of Innovation in Manufacturing SMEs: An Attempt at Empirical Clarification. Technovation 30(1): 48–56. http://www.sciencedirect.com/science/article/pii/S0166497209000728 Reichstein, T., and Salter, A. (2006). Investigating the Sources of Process Innovation
Rogers, M. (2004). Networks, Firm Size and Innovation. Small Business Economics 22(2):141–153.
https://www.jstor.org/stable/40229315?seq=1#page_scan_tab_contents
Segarra, A., and Arauzo, J.M. (2008). Sources of Innovation and Industry–University Interaction: Evidence from Spanish Firms. Research Policy. 37(8):1283–1295.
http://www.sciencedirect.com/science/article/pii/S0048733308001145
Shao, J., Xu, K., and Qiu, B. (2012). Analysis of Chinese Manufacturing Export Duration. China & World Economy 20(4): 56–73.
http://onlinelibrary.wiley.com/doi/10.1111/j.1749-124X.2012.01295.x/abstract
Triguero, A., Córcoles, D., and Cuerva, M. (2014a). Measuring the Persistence in Innovation in Spanish Manufacturing Firms: Empirical Evidence Using Discrete-time Duration Models. Economics of Innovation and New Technology 23(5–6): 447–468.
http://www.tandfonline.com/doi/abs/10.1080/10438599.2014.895514
Triguero, A., Córcoles, D., and Cuerva. M. (2014b). Persistence of Innovation and Firm Growth: Evidence from a Panel of SME and Large Spanish Manufacturing Firms. Small Business Economics 43(4): 787–804.
http://link.springer.com/article/10.1007/s11187-014-9562-8
Triguero, A., and Córcoles, D. (2013). Understanding Innovation: An Analysis of Persistence for Spanish Manufacturing Firms. Research Policy 42(2): 340–352.
http://www.sciencedirect.com/science/article/pii/S0048733312001953
Appendix
Table A.1:Definition of variables
Variable Definition
Dependent variable Hazard rate of current spell of
innovation
Categorical variable indicating the discrete exit probability of a spell of product or process innovation. It is equals 1 when firm innovates in “t” and does not innovate in “t+1”, zero otherwise.
Type of innovation
Type of innovation (t.in)
Categorical variable that identifies the type of innovation of the current spell. It is equals 1 if the current spell is a product innovation spell and 0 when the current spell is a process innovation spell.
State dependence variables
Duration of previous spell Duration (in years) of the previous process or product spell at the beginning of the current spell. Number of previous spells Number of previous process and product spells at the beginning of the current spell.
Explanatory variables Number of years with
simultaneous innovation (product and process)
Variable that identifies the number of years with simultaneous product and process innovation until the current year.
Having patents Categorical variable. Having patents=1 if the firm has registered any patent in t, zero otherwise.
R&D activities
Categorical variable considering all R&D movements of the firm in “t” compared to “t-1”:=0 if firm keeping without R&D (non R&D in t-1 and non R&D in t) =1 if firm beginning R&D activities (non R&D in t-1 and R&D in t ) =2 if firm keeping R&D activities (R&D in t-1 and R&D in t) =3 if firm stopping R&D activities (R&D in t-1 and non R&D in t)
Technological degree
Industry classification according to technological degree (OECD classification).
•Low technology industries=0 includes: Meat products; Food and tobacco; Beverage; Textiles and clothing; Leather, fur and footwear; Timber; Paper; Printing; Furniture; Other manufacturing.
•Medium-Technology=1 (Low-Medium and High-medium OECD classification): Plastic and rubber products; Nonmetal mineral products; Basic metal products; Fabricated metal products; Machinery and equipment; Vehicles and accessories; Other transport equipment.
•High technology industries=2. This category includes: Chemicals and pharmaceuticals; Computer products, electronics and optical; Electric materials and accessories.
Log of duration of current
spell (logseq) Variable that uniquely identifies the number of periods in the current spell, in logs. Control variables
Id. Spell Control variable that uniquely identifies each spell of product or process innovation. Reference unit in panels for survival models.
Id. Seq
Control variable that uniquely identifies the number of periods in the current spell of product or process innovation. For each spell. Max: Id. Seq = duration of spell. Time reference in panels for survival models.
Table A.1 continued
Variable Definition
Industry (NACECLIO)
Categorical variable identifying the manufacturing sector for each firm: 1 Meat products; 2 Food and tobacco; 3 Beverage; 4 Textiles and clothing; 5 Leather, fur and footwear; 6 Timber; 7 Paper; 8 Printing; 9 Chemicals and pharmaceuticals; 10 Plastic and rubber products; 11 Nonmetal mineral products; 12 Basic metal products; 13 Fabricated metal products; 14 Machinery and equipment; 15 Computer products, electronics and optical; 16 Electric materials and accessories; 17 Vehicles and accessories; 18 Other transport equipment; 19 Furniture;
20 Other manufacturing.
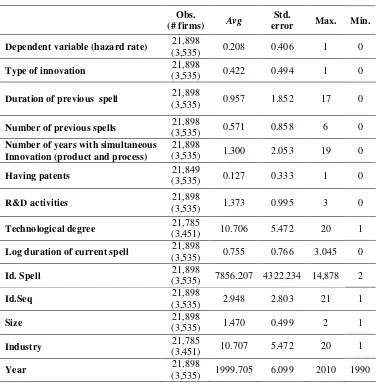
Table A.2: Descriptive statistics
Obs.
(# firms) Avg
Std.
error Max. Min.
Dependent variable (hazard rate) 21,898
(3,535) 0.208 0.406 1 0
Type of innovation (3,535) 21,898 0.422 0.494 1 0
Duration of previous spell (3,535) 21,898 0.957 1.852 17 0
Number of previous spells (3,535) 21,898 0.571 0.858 6 0
Number of years with simultaneous Innovation (product and process)
21,898
(3,535) 1.300 2.053 19 0
Having patents 21,849
(3,535) 0.127 0.333 1 0
R&D activities (3,535) 21,898 1.373 0.995 3 0
Technological degree (3,451) 21,785 10.706 5.472 20 1
Log duration of current spell 21,898
(3,535) 0.755 0.766 3.045 0
Id. Spell (3,535) 21,898 7856.207 4322.234 14,878 2
Id.Seq (3,535) 21,898 2.948 2.803 21 1
Size (3,535) 21,898 1.470 0.499 2 1
Industry (3,451) 21,785 10.707 5.472 20 1
Year 21,898
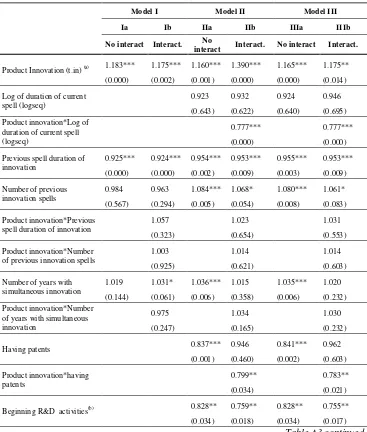
Table A.3: Robustness check: alternative results of random effects clog-log model(*)
interact Interact. No interact Interact.
Product Innovation (t.in) (a) 1.183*** 1.175*** 1.160*** 1.390*** 1.165*** 1.175**
(0.000) (0.002) (0.001) (0.000) (0.000) (0.014) Log of duration of current
spell (logseq)
spell duration of innovation
Table A3 continued
Model I Model II Model III
Ia Ib IIa IIb IIIa IIIb
No interact Interact. interact No Interact. No interact Interact.
Table A3 continued
Model I Model II Model III
Ia Ib IIa IIb IIIa IIIb
No interact Interact. interact No Interact. No interact Interact.
Log-likelihood -10,964 -10,962 -10,416 -10,383 -10,405 -10,384 (0.000) (0.000) (0.000) (0.000) (0.000) (0.000)
Rho 0.370 0.369 0.248 0.159 0.245 0.174 (0.000) (0.000) (0.000) (0.000) (0.000) (0.000)
Number of firms 3,535 3,535 3,393 3,393 3,393 3,393 Number of spells 8,979 8,979 8,548 8,548 8,548 8,548
Observations 21,898 21,898 20,749 20,749 20,749 20,749
(a)Reference: Process innovation. (b)Reference: Keeping without R&D activities. (c)Reference:
Medium-tech industries. (d)Reference: Small firms. (*)Clog-log model has been estimated with the
Please note:
You are most sincerely encouraged to participate in the open assessment of this article. You can do so by posting comments.
Please go to:
http://dx.doi.org/10.5018/economics-ejournal.ja.2016-32
The Editor