The Poriferasta Compound -5,22E,25-trien-3-ol,22-dehydrocholesterol from
Clerodendrum
paniculatum
leaf
as inducer Agent of Systemic Resistance on Red Chilli plant
Capsicum
annuum L
from
Cucumber Mosaic Virus
(CMV)
.
Weny Musa,1 Hersanti,2 Achmad Zainuddin,3 dan Roekmi-ati Tjokronegoro3
1
Department of Chemistry, The Faculty of Mathematics and Science, State University of Gorontalo,
2 Department of Pest and Plant Disease, The Faculty of Farming, Padjadjaran University, Jatinangor 45643, Sumedang
3
Department of Chemistry, The Faculty of Mathematics and Science, Padjadjaran University, Jatinangor
ABSTRACT
The active compound from Clerodendrum paniculatum leaf was obtained with induction activity to systemic resistance of cucumber mosaic virus (CMV) to red chilli.
Methanol extract of Clerodendrum paniculatum leaf was concentrated and extracted with ethyl acetate. Ethyl acetate extract shows induction activity with inhibition percentage above of 55%. Ethyl acetate extract was separated with column chromatography using kieselgel 60 provide one of compound as white needle crystal with 146-148oC melting point. Based on phytochemistry test and spectroscopy data including : IR, 1H-NMR, 13C-NMR and 2D NMR as well as comparation with literature data was concluded isolated compound was steroid group. The inhibition compound showed 87% inhibition activity to red chilli plants from (CMV) at 300 ppm of concentration.
Key word: Poriferasta-5,22E,25-trien-3-ol,22-dehydrocholesterol, Clerodendrum paniculatum, induction of systemic resistance, CMV
1. Introduction
Clerodenrum is one of the genus from Verbenacea family known as producer of diterpen, steroid, sterol glycoside compound and diterpenoid on some spesies of C. colebrookianum, C. trichotonum, dan C. Inerme. (Goswami et al., 1995; Kawai et al., 1999; Yang et al., 2000; Kang et al., 2003; Pandey et al., 2003 dan 2004).
Currently, the use of chemical substances that is successfully isolated has not been found on the research involving Clerodenrum genus.
Most of the researches reported that Clerodenrum genus is the inducer agent for systemic resistance to pathogenic harm as has been reported by Prasad (Prasad et al., 1995; Olivieri et al., 1996; Verma et al., 1996; Praveen et al., 2001). It reported that compound of inducer agent is protein, but for the secondary metabolite compound on this genus is not an inducer agent for systemic resistance of the plant.
One of the genus that is potential in inducing the resistance to red chilli encounter the harm of
Cucumber Mosaic Virus (CMV) in the green house is the Clerodenrum paniculatum (Hersanti, 2004). This research focus only on the leaf extract used as the inducer agent, therefore, this research would try to discover the active compound.
2. Experiment
2.1.Materials and Methods
Instruments needed for this experiment are glass and other supporting instruments that are usually available in Natural Organic Chemical Lab. The melting point is determined by micro melting point apparatus. Each UV Spectrum dan IR is measured by spectrophotometer Beckman DU-700 dan Shimadzu FTIR 8400. Spectrum 1H and 13C NMR are determined by spectrophotometer JEOL JNM ECA-500 operated at 500 MHz (1H) and 125 MHz (13C) using TMS as standard. Chromatography vacuum liquid (KVC) using Si gel 60 ( 230-400 Mesh), chromatography column gravity using Si gel 60 (70-230 Mesh), KLT analysis using KLT plate Kieselgel 60 GF254 0,25 mm. All Solvent used in this
research is technically qualified and distilled.
2.2. Material
Using Clerodenrum paniculatum as the material.
2.3.Extraction and Isolation.
5 kg of Clerodenrum paniculatum leaf is macerated using methanol solvent, then is partitioned by n-hexane and ethyl acetate. Each extract is dried at low pressure resulting 705,77 g concentrate extract methanol, 251,75 n-hexane 23,5 g and 111,80 g extract of ethyl acetate consentrate .
80 g of ethyl acetate is separated using chromatography vacuum liquid with adsorbent Silica gel and eluent n-hexane- ethyl acetate with gradient (10:0 – 0:10) producing nine fractions FE1-FE9 (each 2 g; 2,75 g; 4,50 g; 5,55 g; 6,35 g; 6,85 g; 7,45 g; 7,95 g; 8,25 g). FE3 fraction 4,50 g is then
chromatographed column with n-hexane eluent: metal chloride : acetone (8,5 : 1 : 0,5) producing 7 fractions namely FE3.1-FE3.7.
Intensity of CMV disease is Fraction FE3.4 (178 mg) is re-crystallized and resulting pure compound in a form of white needle crystal (35 mg) with melting point of 146-148oC. Every step of isolation in bio assay is used to determine the inducing systemic resistance agent on red chilli previously infected by CMV.
3. Structure of Elucidation
The molecule structure of that compound is elucidated based on data IR, 1H-NMR, 13C-NMR and 2D NMR.
4. Bio Assay
Each fraction used for bio assay is concentrated as follows:
1.
Extract with 9000 ppm of concentration2.
Extract with 6000 ppm of concentration3.
Extract with 3000 ppm of concentration4.
Clerodenrum paniculatum leaf as comparison5.
Water as control6.
Ethanol as controlBefore conducting the bio assay, Extract is previously mixed with carborundum so that the extract can be absorbed into plant cells without causing the plant tissue dead. Every extract is applied to the first and the second leaf above cotyledon of red chilli, then after 30 minutes, rinse with water. After 24 hrs CMV inoculation is done, that is by applying the filtrate of tobacco leaf infected by the CMV2-RIV mixed with buffer phosphate solvent on the third and the fourth leaf (above the two leaves that have been applied by the extract).
5. Observation
The observed parameters are:
1.
The observed from the first symptom of CMV appear (7 times observation with three day interval). The intensity of CMV is calculated with formula:description:
I = insect Intensity
n = number of plant in every attacks category v = rate scale in each attacks category
V= rate scale from the highest attacks category N= number of observed plants
Attacks scales based on Dolores (1996) are as follow: 0 = plant do not show virus attack symptoms
1 = plant shows a light mosaic symptom, or the symptom is not systemically distributed 2 = plant shows a moderate mosaic symptom
4 = a heavy mosaic symptom or heavy stripes with shrinking or malformed leaf
5 = a very heavy symptom or very heavy stripes with shrinking or severe malformed leaf, dwarf or dead.
2. All of the CMV intensity attack is written into disease development graphic. According to Louws et al. (1996) the total Area Under Diseases Progress Curve/AUDPC) is calculated by the formulae:
Description:
Yi+1 = observation data -i+1
t
i+1 = observation time ke-i+1 Yi = observation data ke-1 ti = observation time ke-13.
The percentage of CMV inhibition resulted from plant extract application is calculated based on the formulae:6. Result and Discussion
Spectroscopy analysis of IR, 1H-NMR and 13C-NMR compound isolated and guided by bio assay, produced systemic resistance inducer agent on red chilli plant infected by CMV. Based on the compound data analysis, the compound is steroid group with functions cluster positions obtained from spectroscopy analysis NMR 2D.
The collected compound of inducer agent is in a form of needle crystal, colourless with melting point at 146-147oC. Infra red Spectrum showed the presence of absorbent ribbons of OH clusters (3429 cm-1), this is due to the fact that there is a special absorbance for the strecth of C-O (1056 cm-1). Double band C=C is seen as the appearance of absorbance area 1377 cm-1, 1643 cm-1 extending absorbance C=C from olefin linear and 1458 cm-1 extending C=C from olefin cyclic. Detailed analysis on NMR spectra showed that there are 29 carbon signals, those signals consisted of five methyl carbon atoms (CH3), 9
methylene carbon (CH2) dan 10 methyne carbon atoms (CH). Methyne carbon comprises seven carbons
atom sp3 and three carbon atom sp2. Signal for five methyl carbon appear on c 12,2; 12,3; 19,6; 20,4; and 21,0 ppm, and these data is supported by spectrum 1H NMR at H (ppm) 0,68 (s); 0,83 (t, J= 7,4 Hz );
0,99 (s); 0,87 (d, J = 6,4 Hz);and 1,64 (S). Signals for 9 carbon methylene atoms appear at c 37,4; 31,7;
42,4 31,8; 21,2; 25,9; 24,5; 40,4; 21,0 and 109,7 ppm. Signal for methyne comprises seven carbons sp3 at c 72,0; 32,0; 50,3; 57,0; 56,0; 39,8; and 52,2 ppm and three carbons sp2 at c 121,9; 130,2; and 137,4 ppm. These data is supported by 1H NMR at H (ppm), 3,52 (m); 5,36 (d J = 4,8); 1,50 (m); 1,49 (m); 1,43
(m); 1,53 (m); 2,27 (m); and three protons sp2 5,36 (d J = 4,8 Hz , 5,19 (1H, dd, J = 15, 1 ; 8,8 Hz) and
5,17 (1H, dd, J = 15,1; 8,8 Hz). The presence of disubstitution trans C=C (C22- C23) is shown by signal 1
H NMR that abdorbed at H 5,19 (1H, dd, J = 15, 1 ; 8,8 Hz) and 5,17 (1H, dd, J = 15,1; 8,8 Hz). This facr
is also supported by signal C24 whic is more protected by c 52,2 ppm. The proton ethylenic is bound respectively by carbon absorbing at c130,2 ppm (C22) and 137,4 ppm (C23).
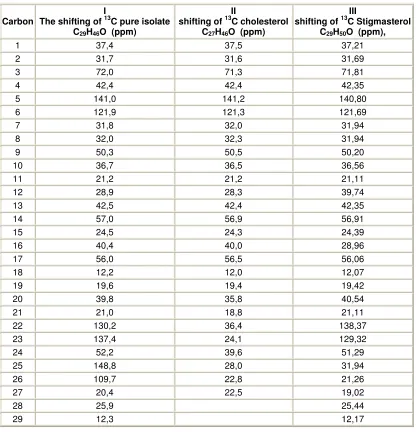
The shifting of chemical carbon on active compound with literature data is shown on table 3. Spectrum
1
H and 13C NMR, DEPT, and HMBC is shown on Table 2.
Table 2. The correlation between proton and carbon compound 2 according to investigation result of spectrum 1H-13C HMQC and 1H-13C HMBC
No. C
δ δ δ δC (ppm)
Kind of C
δ δ δ
δH (ppm) HMQC
δ δ δ δC (ppm) HMBC
24 52,2 CH 2,41(1H,m) 130,2 (C-22); 137,4 (C-23); 148,8 (C-25); 25,9 (C-28) 26 109,7 CH2 6.68 (1H,s);
4,69(1H,s)
20,4 (C-27); 52,2 (C-24) 29 12,3 CH3 0,83 (3H,s) 25,9 (C-28)
Table 3. The chemical shift of pure (1), Cholesterol (II*) and stigma sterol (III**) from spectrum Resonance Magnet core carbon -13
Carbon
I
The shifting of 13C pure isolate C29H46O (ppm)
II
shifting of 13C cholesterol C27H46O (ppm)
III
shifting of 13C Stigmasterol C29H50O (ppm),
1 37,4 37,5 37,21
2 31,7 31,6 31,69
3 72,0 71,3 71,81
4 42,4 42,4 42,35
5 141,0 141,2 140,80
6 121,9 121,3 121,69
7 31,8 32,0 31,94
8 32,0 32,3 31,94
9 50,3 50,5 50,20
10 36,7 36,5 36,56
11 21,2 21,2 21,11
12 28,9 28,3 39,74
13 42,5 42,4 42,35
14 57,0 56,9 56,91
15 24,5 24,3 24,39
16 40,4 40,0 28,96
17 56,0 56,5 56,06
18 12,2 12,0 12,07
19 19,6 19,4 19,42
20 39,8 35,8 40,54
21 21,0 18,8 21,11
22 130,2 36,4 138,37
23 137,4 24,1 129,32
24 52,2 39,6 51,29
25 148,8 28,0 31,94
26 109,7 22,8 21,26
27 20,4 22,5 19,02
28 25,9 25,44
29 12,3 12,17
7.
The result of bio assayIn conducting bio assay, each fraction from maceration, partition and chromatography column 0,045 g are diluted into 5 ml ethanol for 9000 ppm of concentration, next, 1.33 ml is diluted up to 2 ml into 6000 ppm of concentration dan 0,66 ml for 3000 ppm of concentration. The overall result from bio assay, maceration, partition, chromatography column are displayed on table 4, 5, 6, and 7.
From the four extracts with different concentrate on bio assay, 2 of extracts gave a high response as an anti viral compound on red chilli plant. The inhibition concentration is consistent ranging from the low up to the high concentration.
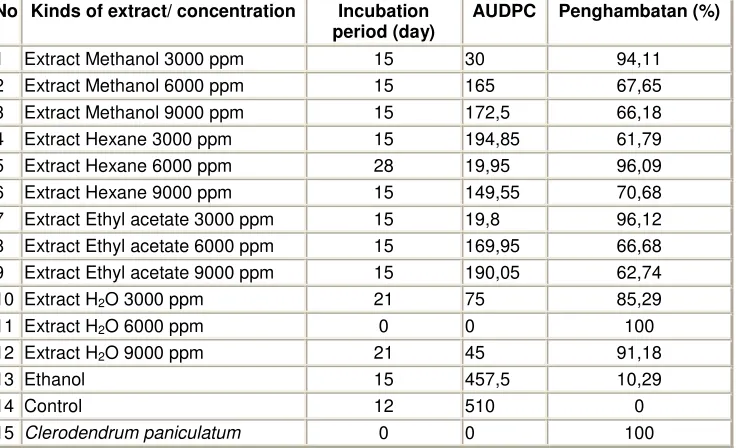
Table 4 The Extracts gained from Maceration, and Partition are potential as the systemic resistance inducer agent on red chilli plant from CMV virus.
No Kinds of extract/ concentration Incubation period (day)
AUDPC Penghambatan (%)
1 Extract Methanol 3000 ppm 15 30 94,11
2 Extract Methanol 6000 ppm 15 165 67,65
3 Extract Methanol 9000 ppm 15 172,5 66,18
4 Extract Hexane 3000 ppm 15 194,85 61,79
5 Extract Hexane 6000 ppm 28 19,95 96,09
6 Extract Hexane 9000 ppm 15 149,55 70,68
7 Extract Ethyl acetate 3000 ppm 15 19,8 96,12
8 Extract Ethyl acetate 6000 ppm 15 169,95 66,68
9 Extract Ethyl acetate 9000 ppm 15 190,05 62,74
10 Extract H2O 3000 ppm 21 75 85,29
11 Extract H2O 6000 ppm 0 0 100
12 Extract H2O 9000 ppm 21 45 91,18
13 Ethanol 15 457,5 10,29
14 Control 12 510 0
15 Clerodendrum paniculatum 0 0 100
Ethyl acetate fraction 111,80 g is separated with open liquid chromatography column using adsorbent silica gel size 70 -230 mesh, using the mixed hexane solvent: ethyl acetate increase in gradient with the rise of 25 % started from hexane 100 %. The result of separation column with the same stain pattern was able to collect 9 fractions namely E1, E2, E3, E4, E5, E6, E7, E8, and E9, afterwards, the 9
fractions are examined by bio assay.
Two out of nine fractions collected from the separation were tested namely fraction Fr E4 and
fraction Fr E5 where the resistance percentage was below 55%. Both of two fractions from the tested three concentration gave resistance below 55%, while the fraction E2, E3, E6, E7, E8, and E9 gave the
varied resistance from the three concentration tested which was above 50% in inducing resistance systemic on red chilli.
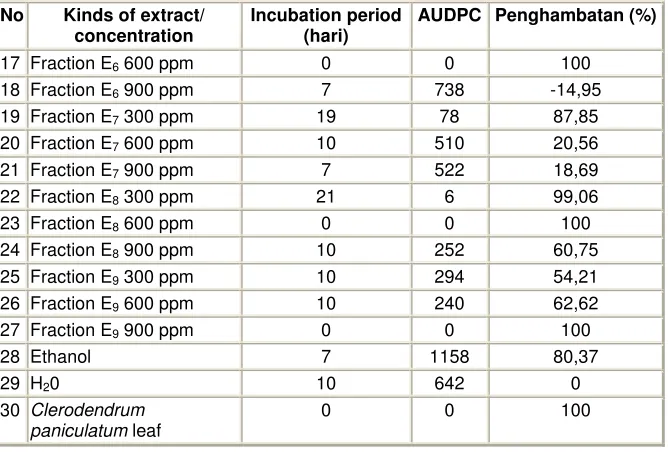
Tabel 5 : Incubation period, AUDPC and the percentage of CMV disease resistance on red chilli plant induced by fractions gained from Ethyl acetate
No Kinds of extract/ concentration
Incubation period (hari)
AUDPC Penghambatan (%)
1 Fraction E1 300 ppm 16 252 60,75
2 Fraction E1 600 ppm 13 96 85,05
3 Fraction E1 900 ppm 0 0 100
4 Fraction E2 300 ppm 10 636 0,93
5 Fraction E2 600 ppm 10 576 10,28
6 Fraction E2 900 ppm 13 48 92,52
7 Fraction E3 300 ppm 0 0 100
8 Fraction E3 600 ppm 10 12 98,13
9 Fraction E3 900 ppm 10 468 27,10
10 Fraction E4 300 ppm 7 444 30,84
11 Fraction E4 600 ppm 13 492 23,36
12 Fraction E4 900 ppm 10 510 20,56
13 Fraction E5 300 ppm 7 702 -9,34
14 Fraction E5 600 ppm 10 552 14,01
15 Fraction E5 900 ppm 10 468 27,10
No Kinds of extract/ concentration
Incubation period (hari)
AUDPC Penghambatan (%)
17 Fraction E6 600 ppm 0 0 100
18 Fraction E6 900 ppm 7 738 -14,95
19 Fraction E7 300 ppm 19 78 87,85
20 Fraction E7 600 ppm 10 510 20,56
21 Fraction E7 900 ppm 7 522 18,69
22 Fraction E8 300 ppm 21 6 99,06
23 Fraction E8 600 ppm 0 0 100
24 Fraction E8 900 ppm 10 252 60,75
25 Fraction E9 300 ppm 10 294 54,21
26 Fraction E9 600 ppm 10 240 62,62
27 Fraction E9 900 ppm 0 0 100
28 Ethanol 7 1158 80,37
29 H20 10 642 0
30 Clerodendrum paniculatum leaf
0 0 100
Table 6. Incubation period, AUDPC and the percentage of CMV disease resistance on red chilli plant induced by fractions E3
No Kinds of extract/concentration Incubation period (day)
AUDPC Penghambatan (%)
1 Fraction E3.1 150 ppm 16 36 92
2 Fraction E3.1 300 ppm 0 0 100
3 Fraction E3.1 450 ppm 16 564 -11,90
4 Fraction E3.2 150 ppm 21 12 97,62
5 Fraction E3.2 300 ppm 13 288 42,86
6 Fraction E3.2 450 ppm 10 102 79,76
7 Fraction E3.3 150 ppm 16 90 82,14
8 Fraction E3.3 300 ppm 10 156 69,04
9 Fraction E3.3 450 ppm 10 60 88
10 Fraction E3.4 150 ppm 21 24 95,23
11 Fraction E3.4 300 ppm 16 54 89,28
12 Fraction E3.4 450 ppm 13 228 54,76
13 Fraction E3..5 150 ppm 13 234 53,57
14 Fraction E3..5 300 ppm 10 336 33,33
15 Fraction E3..5 450 ppm 10 762 -51,19
16 Fraction E3..6 150 ppm 10 240 52,38
17 Fraction E3..6 300 ppm 7 852 -69,05
18 Fraction E3..6 450 ppm 10 282 44,05
19 Fraction E3..7 150 ppm 7 336 33,33
20 Fraction E3.7 300 ppm 7 840 -66,66
21 Fraction E3.7 450 ppm 7 780 -54,76
22 Ethanol 10 498 1,19
23 Clerodendrum paniculatum as comparison
10 198 60,71
24 Control 10 504 0
Generally, there were 6 examined fractions which were potential as systemic resistance inducer agent on red chilli. This could be seen obviously from the AUDPC value and the achieved percentage of resistance. However, some concentrate of these 6 fractions functioning as inducer agent of systemic resistance on fraction E3 (3000 ppm) incubation period 0, AUDPC 0, inhibition percentage 100%. Fraction
E3, the highest inhibition ,100% is continued by separating using chromatography second column. The bio
assay result is shown on Table 6.
The result of bio assay on table 6 shows a varied inhibition percentage and fraction E3.7 show
inhibition percentage below 50 %. The other fractions namely E3.1, E3.2, E3.3, E3.4, E3.5 andE3.6 generally
gave a varied inhibition percentage from the three tested fractions. In general, the tested fractions with 300 ppm typically gave a 50% inhibition. Therefore, for the next test, concentration variation are 450 ppm, 300 ppm dan 150 ppm. One of the fractions resulted from the second column gained from second column separation name fraction fr E3.4 (78 mg) was re-crystallized with n- hexane and ethyl acetate,
since this fraction showed the formation of needle crystal. By re-crystallizing the fraction E3.4, pure isolate
fraction in forms of needle crystal is resulted and 2 fractions from re-crystallization were named fraction E3.4.1 and fraction E3.4.2 . Those three fraction s is then examined using bio assay. The result of bio assay
isolate fraction and re-crystallization can be seen on Table 7
CONCLUSION
The potential inducer agent gained from maceration and partition applied on red chilli is the fraction ethyl acetate where the percentage of inhibition is good and consistent for the three examined sensitive concentrates.
Tabel 7 Incubation period,AUDPC and the percentage of CMV disease resistance on red chilli plant induced by fraction E3.4 gained from re-crystallization
No Kinds of
extract/concentration
Incubation period (day)
AUDPC Penghambatan (%)
1 Isolate + H2O 150 ppm 16 76 79
2 Isolate + H2O 300 ppm 19 46 87
3 Isolate + H2O 450 ppm 19 98 73
4 Isolate + C2H5OH 150 ppm 16 114 69
5 Isolate + C2H5OH 300 ppm 19 64 82
6 Isolate + C2H5OH 450 ppm 10 296 20
7 Fraction E3.4.1 150 ppm 10 228 38
8 Fraction E3.4.1 300 ppm 16 112 69
9 Fraction E3.4.1 450 ppm 13 119 68
10 Fraction E3.4.2 150 ppm 19 54 85
11 Fraction E3.4.2 300 ppm 10 168 54
12 Fraction E3.4.2 450 ppm 7 332 10
13 Ethanol 7 486 -30
14 Control 7 372 0
15 Clerodendrum paniculatum as comparison
19 146 60
Component from fraction ethyl acetate (111,80 g) chromatographed by open column, resulted 9 fractions. The nine fractions are applied to red chilli plant to find out which fraction is potential as the anti viral compound. All of the fractions showed different inhibition percentage with the control and gained 6 out of nine tested fractions that generally showed 55% inhibition. However, there are some tested fractions and concentrate showed inhibition below 55%.
Fractions showing 55% percentage : Fraction E1, (300 ppm) 60,75%, E1 (600 ppm) 85,05%, E1
(900 ppm) 100%. Fraction E2 (900 ppm) 92,52%. Fraction E3 (300 ppm) 100%, E3 (600 ppm) 98,13%.
Fraction E8 (300 ppm) 88,79%, dan E8 (600 ppm). Fraction E9 (600 ppm) 57,09%. Those fractions above
open liquid column chromatography separation resulting 7 fractions.Fractions with the same stain pattern from the thin layered chromatography is combined. Each fraction is named fraction E3.1, E3.2, E3.3, E3.4, E3.5,
E3.6 danE3.7.Those 7 fractions examined by bio assay with the 3 concentrates resulted a various inhibition
percentage. Commonly, with 300 ppm of concentration gave an inhibition above 55% in average, unless for fraction E3.7 inhibition percentage was 33,33% and fraction E3.6 52,38%.
One of the fractions; fr E3.4 (178 mg) is re-crystallized by n-hexane and ethyl acetate and resulted
a white needle crystal. By re-crystallizing fraction E3.4 giving fraction pure isolate in a form of white needle
crystal and 2 fractions from re-crystallization named fraction E3.4.1 and fraction E3.4.2 the 3 fractions is the
examined by bio assay. Fraction with pure isolate was diluted by ethanol and water.
The bio assay shows that fraction on 300 ppm of concentration indicate the inhibition above 50% for the overall fractions. The pure Isolate compound give a high activity compared to unpurified fraction. The pure Isolate compound activity is diluted with either ethanol or water at 300 ppm of concentration showed a 100 % inhibition, this fact proved that the purer the tested material the more the activity will be. The presence of other materials in tested material will decrease the activity, therefore it is assumed that other compounds in the tested material contain antagonise.
Based on the data analysis of spectroscopy UV, IR and NMR; it is concluded that the active compound is Poriferasta-5,22E,25-trien-3-ol 22-dehydrochlosterol with molecular formulae C29H46O.
REFERENCES
Farnsworth, N.R. (1966) Biological and Phytochemical Screening of Plant, J. Pharmaceutical Science, 55, 3, p. 225-276
Ferreira, S.A. and R.A. Boley, 1998. Cucumber Mosaic Virus. Departement of Plant Pathology, CTAHR University of Hawai at Manoa
Green, S.K. and J.S. Kim. 1994. Sources of Resistance to Viruses of Pepper (Capsicum; spp.): A catalog. AVDRC. Tech. Bull. No. 20. 40p.
Houghtn P.j and A. Raman. 1998.Laboratory Handbook for the Fractination of Natural Extracts. Chapmal and Hall. Tokyo.
Kapplan, I.B., A. Gal-On, and P. Palukaitis. 1997. Characterizartion of cucumber mosaic virus: III. Lacolization of sequences in the movement protein controling systemic infection in cucurbits. Virology 230:343-349
Mahato, S. B., Ganguly, A.N., and Sahu, N.P. (1982). Review: steroid saponins, Phytochemistry, 21 (5), 959-978
Makkar, H.P.S dan Becker. 1995. Isolation of tannis from leaves of some trees and shrubs and their properties. J. Agric. Food Chem. 42
Martono, S. 1983. Isolasi dan identifikasi zat aktif berkhasiat analgetik pada daun Gendarusa vulgaris Nees.
Rastrelli, L., R. Aquino, S. Abdo, M. Proto, F. D. Simone and N.D Tommas 1998. Studies on the constituents of Amarathus caudatus L : Isolation and structure elucidation of new triterpenoid saponis and ionol derived glycosides
Pandey.R, K.Ram, Verma, M. Madan, Gupta. 2005. Neo-clerodane diterpenoids from Clerodenron inerme Journal Phytochemistry 66 (6). 643-648
Pandey.R, K.Ram, Verma, M. Madan, Gupta. 2003. 4 -Metyl-24 -ethyl-5 -cholesta-14,25-dien-3 -ol and 24 -ethylcholesta-5,9(11),22E-trien-3 -ol,sterol from Clerodenron inerme. Journal Phytochemistry 63 (4). 415-420.