49
In this chapter, the researcher presents about research findings and
discussion that include data of research findings, data analysis, the result of
normality and homogeneity testing, hypothesis testing and discussion.
A.Research Findings
In this chapter, the researcher presented the data on student’s reading
comprehension before and after being taught by using small group discussion
as technique in the process of teaching reading comprehension. The researcher
presented and analyzed the data which had been collected through two kinds of
test, they are pre-test and post-test. It was conducted for thirty five students.
As mentioned before, the researcher used test as the instrument in
collecting data. It was given to class X- 5 students of SMAN 1 Tulungagung.
The number of question given by researcher was 20 questions. It was consist of
multiple choice test. There were 35 students as respondent or subject at the research. The data of the students’ score before and after teaching reading
comprehension by using small group discussion technique can be seen in the
following table.
Description of Students’ Reading Comprehension Score Before and After
being Taught by Small Group Discussion Technique
In this section, the researcher presented the result of the pre-test and
Tuesday, January 10th, 2017 at 07.00 - 08.30 am. It’s consisted of 20 items multiple choices. Post-test was administered on Tuesday, January 24th, 2017 at
07.00 – 08.30 am. The list of students’ score of reading comprehension can be seen in the table below:
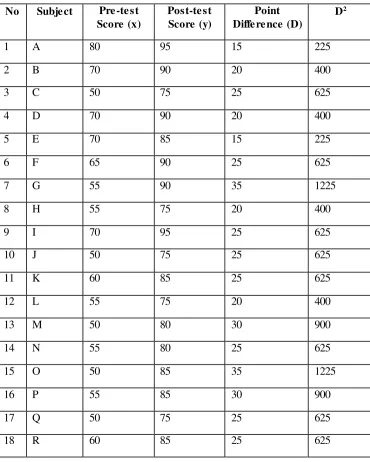
Table 4.1 Students Score Before and After They were Taught Using Small
Group Discussion Technique
No Subject Pre -te st
Score (x)
Post-te st Score (y)
Point Difference (D)
D2
1 A 80 95 15 225
2 B 70 90 20 400
3 C 50 75 25 625
4 D 70 90 20 400
5 E 70 85 15 225
6 F 65 90 25 625
7 G 55 90 35 1225
8 H 55 75 20 400
9 I 70 95 25 625
10 J 50 75 25 625
11 K 60 85 25 625
12 L 55 75 20 400
13 M 50 80 30 900
14 N 55 80 25 625
15 O 50 85 35 1225
16 P 55 85 30 900
17 Q 50 75 25 625
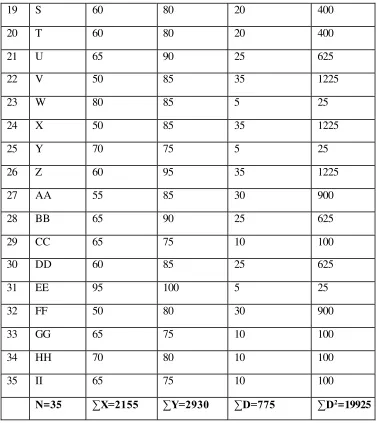
19 S 60 80 20 400
20 T 60 80 20 400
21 U 65 90 25 625
22 V 50 85 35 1225
23 W 80 85 5 25
24 X 50 85 35 1225
25 Y 70 75 5 25
26 Z 60 95 35 1225
27 AA 55 85 30 900
28 BB 65 90 25 625
29 CC 65 75 10 100
30 DD 60 85 25 625
31 EE 95 100 5 25
32 FF 50 80 30 900
33 GG 65 75 10 100
34 HH 70 80 10 100
35 II 65 75 10 100
N=35 ∑X=2155 ∑Y=2930 ∑D=775 ∑D2=19925
Table 4.3 shows the increasing point of students’ pre-test and post-test
score there are 3 students has increased 5 point (W, Y, and EE), 4 students has
increased 10 point (CC, GG, HH, and II), 2 students has increased 15 point (A
and E), 6 students has increased 20 point (B, D, H, L, S, and I), 11 students has
increased 25 point (C, F, I, J, K, H, Q, R, U, BB, and DD), 4 students has
increased 30 point (M, P, AA, and FF), and 5 students has increased 35 point
students got excellent score (90-100), 16 students got very good score (80-89),
and 9 students good score (70-79).
=
their achievement in reading comprehension.
To know the students’ achievement that is good or not, the researcher
give criteria as suggested by the English teacher of SMAN 1 Tulungagung.
Table 4.2 The Scores’ Criteria
Grade Inte rval Class Crite ria
A+ 90 – 100 Excellent
A 80 – 89 Very Good
B 70 – 79 Good
C 50 – 69 Fair
D 0 – 49 Poor
The scores’ criteria above shows that A+ (90-100) means excellent
score, A (80-89) means very good score, B (70-79) means good score, C
(50-69) means fair score, and D (0-49) means poor score. So, it help and make easy
to the researcher classified the students’ score based on the score’s criteria.
From the data of the students pre-test and post-test score, the researcher arrange the frequency and the percentage of the students’ score that can be seen
as in the following table.
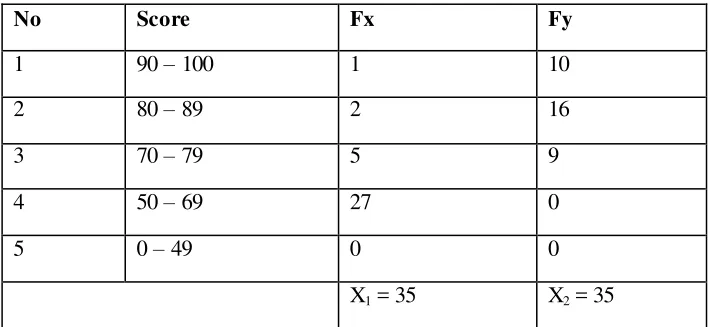
Table 4.3 Frequency of Students’ Score
No Score Fx Fy
1 90 – 100 1 10
2 80 – 89 2 16
3 70 – 79 5 9
4 50 – 69 27 0
5 0 – 49 0 0
It shows that in pre-test there were one student who got excellent score
(90-100), two students got very good score (80 – 89), five students got good score (70 – 79), and twenty seven students got fair score (50 – 69). While, in post-test there were ten students got excellent score (90-100), sixteen students
got very good score (80 – 89), and nine students got good score (70 – 79). So, it can be concluded that the students score before and after they were taught
using small group discussion technique has increased score from 1 to be 10
students got excellent score (90-100), 2 to be 16 students got very good score
(80 – 89), 5 to be 9 students got good score (70 – 79), and has decreased from 27 to be 0 students got fair score (50 – 69).
The percentage of the students pre-test and post-test’ score can be found by using this formula:
% 100 x N F
P
Where:
P : percentage
F : frequency
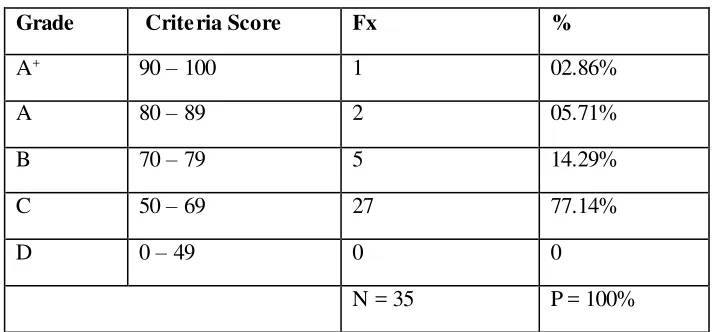
Table 4.4 Percentage of the Students’ Pre-test
Grade Crite ria Score Fx %
A+ 90 – 100 1 02.86%
A 80 – 89 2 05.71%
B 70 – 79 5 14.29%
C 50 – 69 27 77.14%
D 0 – 49 0 0
N = 35 P= 100%
From the data percentage of the students’ pre-test score, it can be seen
that from 100% percentage one student (02.82%) got grade A+ means excellent
score, two students (05.71%) got grade A means very good score, five students
(14.29%) got grade B means good score, and twenty seven students (77.14%)
got C means fair score.
Table 4.5 Percentage of the Students’ Post-test
Grade Crite ria Score Fy %
A+ 90 – 100 10 28.58%
A 80 – 89 16 45.71%
B 70 – 79 9 25.71%
C 50 – 69 0 0
D 0 – 49 0 0
N= 35 P= 100%
From the data percentage of the students’ post-test score, it can be seen
excellent score, sixteen students (45.71%) got grade A means very good score,
and nine students (25.71%) got grade B means good score.
So, it can be concluded that the students’ pre-test and post-test score in
the percentage and criteria was different. After using small group discussion
technique in teaching and learning the table 4.4 and 4.5 show that criteria score
of A+ grade has increased from 02.86% to 28.58%, A grade has increased from
05.71% to 45.71%, B grade has increased from 14.29% to 25.71%, C grade has
decreased from 77.14% to 0%, and D grade has equal percentage from 0% to
0%. In conclusion, it shows that after using small group discussion as a
technique to teach reading comprehension had increased than before using
small group discussion technique.
B.Data Analysis
Data analysis was done to know the different score of the students’
score in reading comprehension before and after being taught using Small
Group Discussion technique. Referring to the data in the form of students’ score gained from pre-test and post-test as stated above, the next step was
analyzing those data by computing it by using T - test.
To find out whether there is different of students’ score in reading
comprehension before and after being taught using Small Group Discussion
technique, the researcher used percentage formula and divided the test result
into five criteria; those are excellent, very good, good, fair and poor. It means
that if the students can understand the reading comprehension well so they get
they get very good and good score, fair and poor score is got by the students
when they just understand little reading comprehension test.
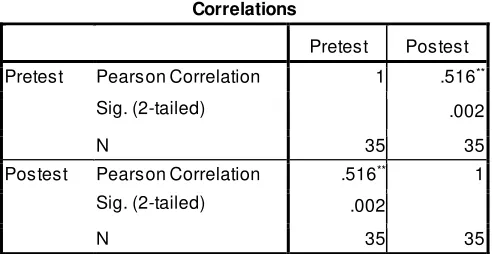
To know the correlations between the students’ score of pre-test and post-test is described in the following table:
Table 4.6 Correlations
Correlations
Pretest Postest Pretest Pearson Correlation 1 .516**
Sig. (2-tailed) .002 N 35 35 Postest Pearson Correlation .516** 1
Sig. (2-tailed) .002
N 35 35 **. Correlation is significant at the 0.01 level (2-tailed).
Based on the table above, output correlations shows the large
correlation between both samples, where can be seen numeral both correlation
is (0.516) and numeral significance (0.002). For interpretation of decision
based on the result of probability achievement, that is:
a) If the probability >0.05 then the null hypothesis accepted
b) If the probability <0.05 then the null hypothesis rejected
The large of numeral significant (0.002) lower than (0.050). It means
that the hypothesis clarify there is no significant different score using Small
Group Discussion technique toward students reading comprehension at the first
grade of SMAN 1 Tulungagung. The other word, Small Group Discussion is
To know whether there is difference mean of students’ pretest and
posttest, it can be seen as follow:
Table 4.7 Paired Samples Statistic
Paired Samples Statistics
Mean N Std. Deviation Std. Error Mean Pair 1 Pretest 61.57 35 10.345 1.749
Postest 83.71 35 7.002 1.184
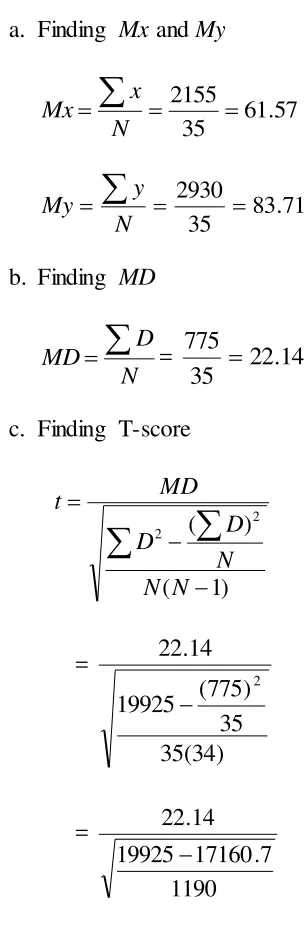
Based on the table 4.11 above, shows Mean of pre-test score (61.57)
and post-test score (83.71), while N for cell there are 35, Standard Deviation
for pre-test (10.345) and post-test (7.002), Standard Error Mean for pre-test
(1.749) and post-test (1.184).
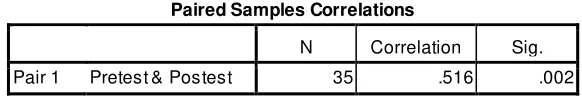
Table 4.8 Paired Samples Correlations
Paired Samples Correlations
N Correlation Sig. Pair 1 Pretest & Postest 35 .516 .002
Based on the table 4.12 above, it shows that the correlations between
two scores of pre-test and post-test = 0.516 and sig = 0.002. For interpretation
of decision based on the result of probability achievement, that is:
a) If the sig > 0.05, means H0 is accepted
b) If the sig < 0.05, means H0 is rejected
It shows that sig= 0.002 is lower than 0.05 means that H0 is rejected and
Ha is accepted. So, it concluded that there is significant correlation between
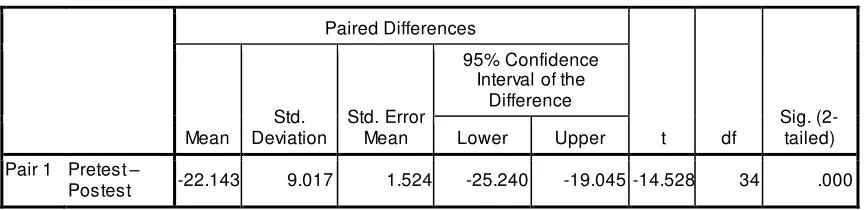
Table 4.9 Paired Samples Test
Based on the table 4.13, output paired samples test shows the result of
compare analysis with using T test. Output shows mean pre-test and post-test is
22.143, standard deviation is 9.017, mean standard error is 1.524. The lower
different is 25.240 and upper different is 19.045. The result test t = 14.528 with
df = 34 and significance is 0.000.
With the guideline of Tcount and Ttable where df= 34 got from Ttable= 1.69.
So, Tcount (14.528) > Ttable (1.69) means that Ho is rejected and Ha is accepted.
Therefore, it concluded that there is the significant differences between pre-test
and post-test score where mean of post-test is 83.71 higher than mean of
pre-test is 61.57 means that teaching reading comprehension through using Small
Group Discussion technique is effective.
Paired Samples Test Paired Differences
t df
Sig. (2-tailed) Mean
Std. Deviation
Std. Error Mean
95% Confidence Interval of the
Difference Lower Upper Pair 1 Pretest –
C.The Result of Normality and Homogeneity Testing
In this part the researcher discuss about the result of normality and
homogeneity testing.
1. The Result Normality Testing
Normality testing is conducted to determine whether the gotten
data is normal distribution or not. The researcher used SPSS.16. One-
Sample Kolmogorov-Smirnove test by the value of significance (α) = 0.050. The result can be seen below:
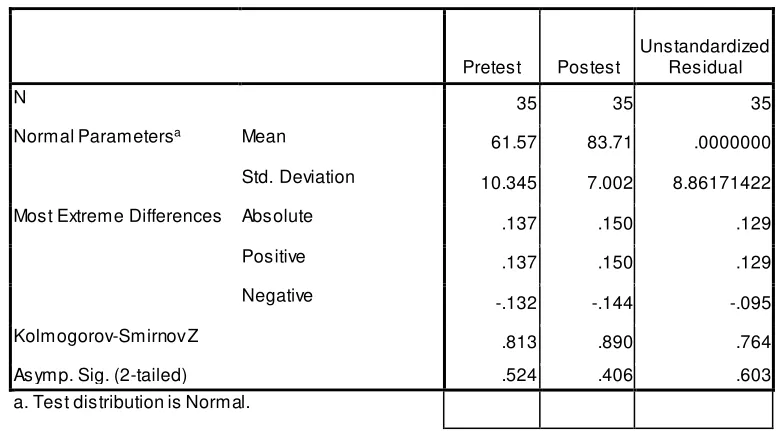
Table 4.10 Normality Testing
One-Sample Kolmogorov-Smirnov Test
Pretest Postest
Unstandardized Residual
N 35 35 35
Normal Parametersa Mean
61.57 83.71 .0000000 Std. Deviation 10.345 7.002 8.86171422 Most Extreme Differences Absolute .137 .150 .129 Positive .137 .150 .129 Negative -.132 -.144 -.095 Kolmogorov-Smirnov Z .813 .890 .764 Asymp. Sig. (2-tailed) .524 .406 .603 a. Test distribution is Normal.
Based on the table above is known that the significance value
from pre-test is 0.813 and from the post test is 0.890. Both value from
pre-test and post-test are bigger than 0.05. The sig/p value on pre-test
is 0.813 and it is lower 0.05 (0.813 > 0.05) means that the data is in
0.890 and that is bigger than 0.05 (0.890 > 0.05) means that the data is
in normal distribution. It also means that H0 is accepted and Ha is
rejected. So, it can be interpreted that both of data (pre-test and
post-test score) are in normal distribution.
2. The Result Homogeneity Testing
Homogeneity testing is conducted to know whether the gotten data
has a homogeneous variance or not. To know the homogeneity, the
researcher used Test of Homogeneity of Variances with SPSS.16 by the value of significance (α) = 0.050. The result can be seen below:
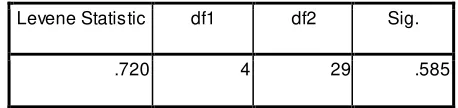
Table 4.11 Homogeneity Testing
Test of Homogeneity of Variances
Levene Statistic df1 df2 Sig.
.720 4 29 .585
Based on the table above is known that the sig/p value is 0.585
higher than 0.05 means H0 is accepted and Ha is rejected. So, it can be
interpreted that the data is homogeny.
D.Hypothesis Testing
From the data analysis it could be identify that:
1. When the value of Tcount > Ttable in df = 34 with the significant level 0.05.
The alternative hypothesis (Ha) is accepted and the null hypothesis (Ho) is
comprehension achievement to tenth grade students at SMAN 1
Tulungagung before and after being taught using small group discussion
technique.
2. When the value of Tcount < Ttable in df = 34 with the significant level 0.05.
The null hypothesis (Ho) is accepted and the alternative hypothesis (Ha) is
rejected. It means that there is no significant different score of reading
comprehension achievement to tenth grade students at SMAN 1
Tulungagung before and after being taught using small group discussion
technique.
The mean of total reading comprehension test score of 35 students
before being taught using small group discussion is (61.57). After getting treatment, the means score of students’ reading is (83.71). It means that the students’ score is improved.
Based on the statistical calculation using t-test, the researcher gives
interpretation to tcount. First, she considered the d.f. with the d.f. (35-1=34). She
checked to the score of “t” at the significant level of 0,05. In fact, with the d.f.
of (34) and the critical value 0,05 significant ttable was (1.69).
By comparing the “t” that she got in calculation tcount = (14.528) and the value of “t” on the ttable = t0.05 = (1.69), it is known that tcount is bigger than ttable
= 14.528 > 1.69.
Because the tcount is bigger than ttable the null hypothesis (Ho) is rejected
and the alternative hypothesis (Ha) is accepted. It means that there is
tenth grade students of SMAN 1 Tulungagung before and after being taught by
small group discussion technique.
E.Discussion
From the research method in chapter III in this research, teaching and
learning process is divided into three steps. First step is the researcher
administrated pre-test by giving reading comprehension test. It is used to know the students’ earlier reading comprehension before they get treatment.
The second is given treatment to the students. The treatment here is
teaching reading comprehension by using small group discussion technique.
The material is about narrative text. After the student got treatment, they were
more enthusiastic to learn reading comprehension. The last step was giving
post-test to the students after they got treatment.
From the research finding in chapter IV, the output data of Paired
Samples Statistics shows mean of pre-test is 61.57 and post-test is 83.71 has
increased and if compared the differences both of value is 22.14. It was found
that the students’ reading comprehension achievement after being taught by Small Group Discussion technique had better than the students’ reading
comprehension achievement before being taught by Small Group Discussion
technique. Therefore, from both mean it can concluded that there is significant differences in the students’ achievement of reading comprehension means that
teaching reading comprehension through small group discussion technique is
The standard deviation is to measure how much the variance of the
sample. The standard deviation of pre-test is 10.345 ˂ 61.57 and post-test is 7.002 ˂ 83.71 where if the standard deviation is getting higher than the mean it
means that the mean is not homogeny and if the standard deviation is getting
smaller than the mean it means that the mean is homogeny. So, it can be
concluded that standard deviation of pre-test and post-test was homogeny
means that the sample of this research almost has the same mean.
The standard error mean is to measure the accuracy with which a
sample represents a population. The standard error mean of pre-test is 1.749 ˂ 61.57 and post-test is 1.184 ˂ 83.71 where if the standard error mean is getting higher than the mean it means that the sample is not representative and if the
standard error mean is getting smaller than the mean it means that the sample is
representative. So, it can be concluded that the sample of this research
indicated good sample or representative from population.
Based on the output data of Paired Samples Test it was found that tcount
= 14.528 and ttable = 1.69 and if compared the differences both of value is
12.838. From this comparison, tcount = 14.528 is bigger than ttable = 1.69 which
means the alternative hypothesis (Ha) is accepted, while the null hypothesis
(Ho) is rejected. Therefore, it can be concluded that there is significance
different score of the reading comprehension of the tenth grade students of
SMAN 1 Tulungagung in academic year 2016/2017 before and after being
Based on the result of research findings and explanation above, it can
be concluded that using small group discussion technique is effective in
teaching reading comprehension at senior high school especially for the tenth
grade students of SMAN 1 Tulungagung. It proved that Small Group
Discussion technique has significant effect to the students’ reading comprehension achievement. Small Group Discussion is one of the essential or important technique to improve student’s creativity to solve problem,
especially to conduct their reading comprehension (Buzan, 2005:1).
Small group discussion is one of the cooperative learning methods that
consist of small member of 3-5 students which in this technique the students
work together through interaction whose interdependent relationship allows
them to achieve a mutual goal. By using this technique can make the students
are more confidence to give opinion about a problem, together to solve and to
get good answer of the question. Group discussion technique is always where
teacher gives opportunity to the students to the scientific discussion in giving
and answering the question based on the topic.
Based on the explanation above, it can be concluded that the teacher
must not only focus on presenting materials for the students but the most
important one must be considered that is how to presents the materials. In this
research, the researcher uses small group discussion technique as a way in
teaching reading comprehension. In this technique students study reading
narrative text and discuss with their group based on the story. It makes them
on the chair during teaching and learning, but she have to control the students
activity by going around to the each group to make sure that the students
involved in their group. This technique is done to make the use of small group
discussion in teaching and learning process.
After the researcher did the research in teaching reading comprehension
to tenth grade students at SMAN 1 Tulungagung, small group discussion
technique not only motivate the students to learning reading comprehension but
also help the students comprehend the text easily. So, they can learn to develop
their ability in reading comprehension, especially of narrative text. Small group
discussion technique surely showed the real effectiveness in teaching reading
comprehension because it can help the students to improve their reading
comprehension achievement, especially of tenth grade students at SMAN 1