PROVING THE CAPABILITY FOR LARGE SCALE REGIONAL LAND-COVER
DATA PRODUCTION BY SELF-FUNDED COMMERCIAL OPERATORS
M. W. Thompson a, J. Hiestermann a, L. Moyo a
aGeoTerraImage Pty Ltd, South Africa – [email protected]
KEY WORDS: Land-cover, big data, automated mapping, cloud-based processing, disruptive technologies, southern Africa.
ABSTRACT:
For service providers developing commercial value-added data content based on remote sensing technologies, the focus is to typically create commercially appropriate geospatial information which has downstream business value. The primary aim being to link locational intelligence with business intelligence in order to better make informed decisions. From a geospatial perspective this locational information must be relevant, informative, and most importantly current; with the ability to maintain the information timeously into the future for change detection purposes. Aligned with this, GeoTerraImage has successfully embarked on the production of land-cover / land-use content over southern Africa. The ability for a private company to successfully implement and complete such an exercise has been the capability to leverage the combined advantages of cutting edge data processing technologies and methodologies, with emphasis on processing repeatability and speed, and the use of a wide range of readily available imagery. These production workflows utilise a wide range of integrated procedures including machine learning algorithms, innovative use of non-specialists for sourcing of reference data, and conventional pixel and object-based image classification routines, and experienced/expert landscape interpretation. This multi-faceted approach to data produce development demonstrates the capability for SMME1 level commercial entities such as GeoTerraImage to generate industry applicable large data content, in this case, wide area coverage land-cover and land-use data across the sub-continent. Within this development, the emphasis has been placed on the key land-use information, such as mining, human settlements, and agriculture, given the importance of this geo-spatial land-use information in business and socio-economic applications and decision making.
1. MANUSCRIPT
The Earth Observation (EO) industry has seen significant changes in terms of its data availability and processing abilities in the last 24-36 months. There is a clear shift from the conventional and long-term traditional data access and processing workflows (which were relevant merely a decade ago), to big data crunching algorithms, cloud-based computing and real-time information processing, supported by internet and technological giants. The changes seen and experienced in the EO industry have been daunting if unexpected, or exciting if prepared. This paper describes the short story of a commercial focused company, GeoTerra Image (GTI) in South Africa, that is set on proving its capability in adapting to the changing EO industry. In order to remain both relevant and competitive , GTI has embraced these changes, and rapidly adapted to a new way of thinking, thus proving that regardless of the size and location of any commercial EO organisation, there is still relevance and opportunity to their existence.
GTI is a small commercially focussed company based in South Africa, which uses EO technologies to provide solution driven services to many market sectors both in South Africa, and increasingly so in Africa. GTI has a technical staff compliment under 15 personnel, of which half are focussed on EO activities. The company don’t sell imagery, but rather the intelligent application of information or knowledge extracted from EO imagery. In the last two to three years the global EO sector has undergone potentially more significant changes (in terms of data
1Small. Medium and Micro Enterprise Businesses (SMMEs)
2European Space Agency, UK’s Satellite Application Catapult, Japan International Cooperation Agency, EU Joint Research
Centre, Chinese Nation Space Agency
availability and accessibility, associated data processing, and the production of globally applicable standardised value-addition datasets), than at any other time in the past 20 – 30 years. This is has been a challenge to GTI, but often the challenge has been an advantage is disguise, waiting to be identified.
Other world regions increasingly focus on Africa as a ‘new’ EO market, and therefore many projects, often with content or objective overlaps, are being implemented by international organisations (i.e. ESA, UK-SAC, JICA, JRC, CNSA etc)2, with supporting international or national funding and backstopping. The challenge to GTI has been (and will continue to be), that the company ensures it offers globally competitive, relevant and comparable technical capabilities to create quality solutions to customers. Vital to this is that their customer base continues to see the value of GTI’s commercial solutions in light of so many “free-to-access” international datasets now becoming available.
This has required that all recent disruptive technologies within the EO arena are viewed as positive catalysts or fast-track ‘stepping stones’ to new or improved client focused solutions. This doesn’t only mean being able to do and repeat what global competitors are doing or generating, but also using these global datasets as assets, rather than competitive or disruptive data. Where these datasets are available and accessible, focus should be on enhancing or improving them further to build more locally focussed, higher value-addition solutions. Especially where local The International Archives of the Photogrammetry, Remote Sensing and Spatial Information Sciences, Volume XLII-3/W2, 2017
37th International Symposium on Remote Sensing of Environment, 8–12 May 2017, Tshwane, South Africa
This contribution has been peer-reviewed.
knowledge and location can provide a new alternative, something unique, and a new, competitive edge.
“Progress is impossible without change, and those who cannot change their minds cannot change anything” – George Bernard Shaw. Whilst the result of change is often positive, the process and drivers of change are typically challenging technological hurdles, that impact on both financial and human capital. A mere five years ago, GTI was sourcing EO data on a project specific basis, either direct from local (South African) ground receiving stations, or from the USGS3 web-based data archives. The imagery was then pre-processed and classified using expensive, proprietary software, typically using conventional, per-pixel classifies with significant analyst intervention. One expensive implication of this was (and currently still is), the necessity to invest significantly in in-house data storage capacity, internet speed and bandwidth. Presently in 2017, GTI is starting to experience the advent of operational cloud based image archives, supported by equivalent cloud based processing and modelling solutions, using non-proprietary, Open Source software and programming languages. All of which are facilitating the development of standardised, automated image-based modelling procedures, requiring far less analyst intervention (although post-processing customisation of base data products are still likely to require skilled analyst intervention). For a cost-conscious SMME company such as GTI the reverberation is that in the short-term, GTI may actually be in a position to start reducing its physical in-house data storage requirements, since cloud-based solutions could soon make downloading raw imagery irrelevant.
The overall focus of outputs has and will remain the same, namely the provision of client orientated solutions based on EO technologies. The factors that have changed are data access, data processing and the delivery mechanisms used to provide these solutions-based outcomes. The basic content of solutions then and now are similar, but what has changed is the method and approach of presenting the final solution. There is a shift from client specific ‘once-off’ project solutions to more standardised, generic dynamic product solutions, delivered using novel, client-interactive web-based tools, rather than static maps or reports. This is a however still very much a “game-in-process”, rather than a fait accompli completed process. It is important to cognitively acknowledge the changes, and recognise that it creates a space to move up the value-addition chain, where the value of GTI’s commercial solutions is no longer only conventional data-based outcomes, but also information or even knowledge-based outcomes.
Drivers of change are positive catalysts when the change offers new or improved opportunities. In the case of GTI, one of the significant longer term catalysts has been the international trend towards open EO data access, especially with the US Landsat data archive. From a commercial perspective, this had a dramatic and significant impact on the cost-of-doing business, typically offering an immediate ± 30% reduction in overall project costs.
With specific reference to GTI’s regional southern African land -cover dataset (see figure 1), the catalysts for the development and implementation of an automated mapping capability were the fortuitous advent of Landsat 8, with its reliable, quality data content, coupled with the need to rapidly generate wide-area coverage map data for a potential international client. These two factors represented a convergence of opportunities that convinced GTI to internally fund, develop and fast-track its own in-house EO data automation capabilities. The bold step to
3 United States Geological Service
initiate and operationally prove this capability in ± 24 months from the inception of Landsat 8 was a key pivot point in GTI’s operations. In these 2 years GTI’s self-funded, in-house initiatives unknowingly ran in many cases parallel to other similar global research and commercial developments or initiatives. The key outcomes of this process, aside from product development, has been the re-skilling and re-energising of the company, without a change in personnel or company profile. This meant that while the company still focused on EO-based commercial solutions, it was able to increase the cost efficiencies of both human and technical capital; all through open and early adoption of new and advantageous EO technologies.
Figure 1. GTI’s Southern African Land-cover Dataset
Currently the focus within GTI, and seemingly so with many international organisations, is the development of automated mapping procedures to produce land-cover products, rather than land-use data. This is assumed to be, and is certainly the case in GTI, because land-cover is typically the least complex of the two, given that many land-uses are represented by and share multiple land-cover facets and associated spectral characteristics. For example, automated mapping and delineation of surface water extent is well document and proven (Verpoorter Kutser and Tranvik, 2012; Westerhof et al., 2013), but separating natural from man-made water features, such as pans from farm irrigation dams, is less documented. Exceptions to this generalisation are starting to become evident, with institutes such as the BMGF4 and FaceBook joining the EO game with the aim of establishing the automated generation of global settlement datasets. GTI is well aware these possibilities and therefore is following the same trend, and has started to look at cultivation, settlements and mining as the next automated focus areas. This is in response to identified user community needs, and maintenance of the relevant EO applicable skills in this ever changing technological arena.
GTI’s original southern African land-cover dataset was the precursor to several other national and regional land-cover datasets that benefited from the Landsat 8 catalyst and the new automated modelling approaches. GTI has since developed two standardised, national land-cover / land-use datasets for South
4 Bill and Melinda Gates Foundation
The International Archives of the Photogrammetry, Remote Sensing and Spatial Information Sciences, Volume XLII-3/W2, 2017 37th International Symposium on Remote Sensing of Environment, 8–12 May 2017, Tshwane, South Africa
This contribution has been peer-reviewed.
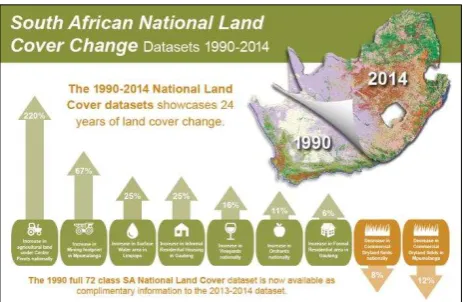
Africa, representing 1990 and 2013/14, which collectively provide quantifiable landscape change over nearly 25 years (see figure 2). This has been followed by a geographical expansion of the southern African land-cover dataset to provide a seamless coverage across 11 countries (namely Angola, Botswana, Lesotho, Malawi, Mozambique, Namibia, South Africa, Swaziland, Zambia, Zimbabwe, and the Copper-belt region of the DRC). At the time of original data production, the luxury of using cloud-based image archive platforms now offered by Amazon or Google Earth were not available yet. This necessitated GTI physically downloading ± 2500 seasonally defined Landsat 8 images (from the USGS data archives), and pre-processing these internally to standardised Top-of-Atmosphere values prior to land-cover modelling. Data processing procedures evolved from step-by-step application of proprietary software based model applications to bulk data processing of multiple seasonal datasets, using in-house developed python scripts, which had devastatingly positive effects of processing times. This journey eventually led to a growth in internal capabilities where they were able to process
“2 countries in 6 months, followed by 6 countries in 2 months”.
This set a new benchmark for the company, which, merely a year or so ago, would have been deemed unimaginable for GTI .
Figure 2. GTI’s 1990 and 2014 Standardised South African Land-cover Datasets.
GTI’s original automated land-cover modelling procedures were based on decision trees (which are set of rules used to classify data into categories), associated with pre-determined thresholds derived from multiple spectral indices. These rules were generated from multi-seasonal image acquisition dates in order to profile seasonal changes in the landscape and identify the relevant vegetation, water or bare ground surfaces. Decision trees are classified as a predictive modelling algorithms in the field of machine learning. The increased focus on machine learning (ML) algorithms and their value over the last 3 years, as well as the ability for “non-data scientists” to be able to execute various complex ML algorithms, has been the next catalyst for GTI to perform data processing at even larger scales.
The global leaders in EO and data information products have used ML technology to their advantage to process vast petabytes of EO data. Descartes Labs, a Research Institute in Los Alamos (New Mexico), has further proved that the convergence of cloud computing, cloud storage and machine learning is the future of the EO industry, by processing over a petabyte of EO data in 1 day. Orbital Insight, in California (USA) is another company leveraging the wealth of EO data using cloud computing and machine learning techniques. Orbital Insight turns millions of EO images into a source of market insights, creating an
unprecedented transparency, and empowering global decision makers.
The result of this global trend is an influx of ML concepts, libraries and tools in many EO proprietary software solutions and open source programs and packages. In the EO environment, ML is the buzz word, with current developments now pushing more towards image processing the using learning algorithms such as Support Vector Machines or the Random Forest classifier to name a few.
The original focus of the GTI southern African land-cover dataset was primarily on mapping basic land-cover characteristics, namely basic vegetation classes, water and bare ground surfaces. Within the 1990 and 2013/14 South African National Land-Cover datasets the data product was enhanced to include a significant land-use information component, in order to meet end-user expectations and requirements. Enhancements included classes such as cultivation, built-up, mines, and afforestation etc. This shift to increase the information content of the basic land-cover data has now been expanded into the GTI southern African land-cover dataset, with the inclusion of settlements, mines and cultivation. Whilst the automation of the settlements and mines mapping process could still be considered ‘in-development’, significant progress has been made towards automating the cultivation mapping. Taking another technological leap of faith, GTI innovatively used ‘crowd sourced’ reference data to identify cultivated lands, and integrated this data into non-proprietary machine learning algorithms. Despite the crowd sourcing being a ‘ paid-for-service’, the cost efficiency of this approach was obvious, since it produced in excess of 500,000 field-level cultivation reference points across Zambia in under 3 weeks; resulting in a ± 90% mapping accuracy for a national cultivation map of Zambia, circa 2015. Admittedly this is only for Zambia, but the process and approach has been validated and operational proven at a national level. Once again, there is clear affirmation where two potentially disruptive technologies have been used advantageously in a commercially operational environment.
The key advantages of automated mapping is the repeatable production of standardised and thus comparable information, in a rapid and efficient manner. The data does however have to be accurate in order to be valuable and useful to the end-user. So how has GTI done in this respect? In terms of the two South African National Land-Cover datasets, mapping accuracies were statistically validated against independent reference data, and were shown to have overall mean mapping accuracies of 91% (2014 South African National Land-Cover Dataset, GTI Report 2015). This value does however represent all final land-cover and land-use classes, not just the base vegetation, water and bare ground information categories generated through the automated modelling.
The much wider geographical southern African GTI land-cover dataset has not been formally verified (apart from the cultivated lands component over Zambia as discussed previously), but was however generated using the same models used to generated the 1990 and 2013/14 South African national land-cover / use datasets. Qualitative visual comparison of GTI’s southern African land-cover to other Landsat derived global land-cover datasets, such as the Chinese Globeland30 dataset (www.globallandcover.com), have shown remarkable similarities of detail at the local scale; of which GTI is justifiably proud given the differences of resources availability between the two organisations.
The International Archives of the Photogrammetry, Remote Sensing and Spatial Information Sciences, Volume XLII-3/W2, 2017 37th International Symposium on Remote Sensing of Environment, 8–12 May 2017, Tshwane, South Africa
This contribution has been peer-reviewed.
GTI needs to remain relevant to both its existing customers and continue to develop opportunities for new customers by using new or improved EO technologies. Disruptive technologies whilst challenging are by no means disadvantageous. Sentinel and Landsat data archives which are now available in cloud-based data platforms such as Google and Amazon are likely to be key components in GTI’s future. In the short term GTI is likely to use these as access points to standardised, bulk data; since data processing will continue to be an in-house activity. However, GTI will strongly focus on upskilling its personnel to execute its unique landscape characterisation methods and processes in the cloud as soon as possible. The term landscape characterisation is intentionally used, since the scope of EO data offerings is now wider than just conventional land-cover and land-use information, even when considered in terms of standardised (commercial) data product generation. Similarly attention will also have to be paid to other cloud-based solution’s such as Digital Globes Global Base Map (GBM) and GBDX platforms, and Airbus’s ‘One Atlas’.
Bespoke, or client specific mapping projects may remain for a longer period, at least in-part, within the in-house, proprietary software environment. For example, the mapping of small scale artisanal mining along highly eroded, riparian zones in dense tropical forest, may still require a bespoke, skilled image analyst approach rather than pre-determined, stand-alone model script ; apart from the production of standardised information components, such as for example, surface water extents.
References
GeoTerra Image, 2015. 2013 - 2014 South African National Land-Cover Dataset. Data User Report and MetaData. Pretoria, South Africa. Commercial Data Product Report by GeoTerra Image (S.Africa), March 2015.
Verpoorter, C, Jutser, T, and Tranvik, L 2012: Automated mapping of water bodies using Landsat multispectral data.
Limnology and Oceanography: Methods. 10, pp.1037-1050.
Westerhoff, R.S., Kleuskens, M.P.H., Winsemius, H.C., Huizinga, H.J., Brakenridge, G.R. and Bishop, C. 2013: Automated global water mapping based on wide-swath orbital synthetic-aperture radar. Hydrol. Earth Syst. Sci. 17., pp651-663.
The International Archives of the Photogrammetry, Remote Sensing and Spatial Information Sciences, Volume XLII-3/W2, 2017 37th International Symposium on Remote Sensing of Environment, 8–12 May 2017, Tshwane, South Africa
This contribution has been peer-reviewed.