ENABLING SEARCHES ON WAVELENGTHS IN A HYPERSPECTRAL INDICES
DATABASE
F. Piñuelaa* , D. Cerrab, and R. Müllerb
a
Thermal Remote Sensing Group. Department of Earth Physics and Thermodynamics, Faculty of Physics, University of Valencia. 50 Dr. Moliner. E-46100 Burjassot, Spain. - [email protected]
b German Aerospace Center (DLR), Remote Sensing Technology Institute, Münchnerstr 20, 82234 Weßling, Germany. -
(Daniele.Cerra, Rupert.Mueller)@dlr.de
Commission I, WG 1
KEY WORDS: Hyperspectral, database, wavelength, spectral index.
ABSTRACT
Spectral indices derived from hyperspectral reflectance measurements are powerful tools to estimate physical parameters in a non-destructive and precise way for several fields of applications, among others vegetation health analysis, coastal and deep water constituents, geology, and atmosphere composition. In the last years, several micro-hyperspectral sensors have appeared, with both full-frame and push-broom acquisition technologies, while in the near future several hyperspectral spaceborne missions are planned to be launched. This is fostering the use of hyperspectral data in basic and applied research causing a large number of spectral indices to be defined and used in various applications. Ad hoc search engines are therefore needed to retrieve the most appropriate indices for a given application. In traditional systems, query input parameters are limited to alphanumeric strings, while characteristics such as spectral range/ bandwidth are not used in any existing search engine. Such information would be relevant, as it enables an inverse type of search: given the spectral capabilities of a given sensor or a specific spectral band, find all indices which can be derived from it. This paper describes a tool which enables a search as described above, by using the central wavelength or spectral range used by a given index as a search parameter. This offers the ability to manage numeric wavelength ranges in order to select indices which work at best in a given set of wavelengths or wavelength ranges.
1. INTRODUCTION
During the last ten years, improvements in sensors and computation capabilities of remote sensing technologies have improved exponentially. This caused a large number of cheaper remote sensing sensors to appear on the markets. The derived products exhibit improved characteristics with respect to previous systems, in terms of spatial, spectral, radiometric and temporal resolution, Signal-to-Noise Ratio (SNR), field of view and reliability of the acquired data. Such development that hyperspectral technology has undergone in recent years has caused the exponential growth of applied research and resources, especially in relation to environmental applications.
Spectral indices estimate some physical parameter of a target on ground based on a combination of the reflectance values in specific bands. Such indices are an invaluable tool when developing environmental studies. Given the high spectral resolution of hyperspectral systems, the sheer number of defined spectral indices, along with their variation*, is impressive, and it may be difficult to find the most useful index for a given application without an extensive literature research in every case.
There are some tools that facilitate the search for hyperspectral indices based on traditional search criteria. However, these systems lack the ability to perform the search based on wavelength ranges. Such information would be valuable to solve several practical problems. For instance, an user could be
*
Corresponding author
interested in finding the possible applications to vegetation analysis that he could carry out, given the characteristics of the hyperspectral sensor he has available. Another example is, given the bands with the best signal-to-noise ratio in a specific sensor, to find which indices could be reliably be derived from the instrument at hand.
The tool introduced in this paper tries to tackle this problem by enabling a search on databases of spectral indices which includes the wavelengths or wavelength ranges used by the index as possible search criteria. The paper is structured as follows. Section 2 contains a brief reminder of the search engines which work on spectral indices defined so far. Section 3 illustrates the implementation and functionalities of the presented tool, along with a list of the technologies of choice for this modular system. We conclude in Section 4.
2. STATE OF THE ART
The application essential function is the management, storage and access to information of hyperspectral indexes. Therefore, the basic concept on which the project is based is the spectral index. In remote sensing, a spectral index is a numerical value that is obtained as a result of the combination of two or more spectral bands through an arithmetic equation. This value will integrate the information contained in the constituent spectral bands.
The indices are usually defined for applications within a specific field. Among the main areas of application of spectral The International Archives of the Photogrammetry, Remote Sensing and Spatial Information Sciences, Volume XLII-3/W3, 2017
Frontiers in Spectral imaging and 3D Technologies for Geospatial Solutions, 25–27 October 2017, Jyväskylä, Finland
This contribution has been peer-reviewed.
indices we may find vegetation monitoring, geology, continental hydrology, human structures, and oceanography. Multi- and hyper-spectral remote sensing applications can relate the reflectance in different portions of the spectrum (usually in the range from the visible to the near infrared) to several physical and environmental variables of interest, such as temperature, water content, leaf structure, and plant vigorosity. Spectral indices allow extracting the key spectral information contained in each spectral signature so that it can be linked to the observation of a physical parameter through its integration in a mathematical model, and used in the development of more advanced studies such as multitemporal analysis. Such is the case of the Normalized Differential Vegetation Index (NDVI). Different studies have been carried out that use the value of this index to calculate plant variables in crops as indicators of their vigorosity and health, such as the Leaf Area Index (LAI) (Haboudane, 2003) .
In the multispectral field, there are numerous articles and studies that have allowed to develop a wide range of indices for the different fields of application previously mentioned. Although the hyperspectral technology is more recent and lacks the wide availability of multispectral space borne data, the scientific community has defined an extensive list of hyperspectral indices in a relatively short period of time. This fact has been of course supported by the multispectral background developed in previous decades and represents its natural refinement.
In parallel, information technologies have reached a golden age in the last two decades, which has led to a revolution in the way information is stored, managed and accessed. The development of advanced storage mechanisms in scalable databases as well as the design of advanced search engines has made it possible to take a step forward in offering new and more efficient access to information.
The system designed is based on the two pillars mentioned above: it is an application with web support of advanced access to an extensive database of hyperspectral indices. Likewise, the system has been designed at the moment with a modular orientation, favouring both the migration to more advanced technological supports and the development and implementation of new and advanced functionalities.
The number of applications that facilitate access to libraries of hyperspectral information is extremely scarce, especially in case of specific libraries of spectral indexes. At the start of planning and design of the present project, two applications were in full operation that facilitated the access to this type of data.
ZuBuD, developed in the Computer Vision Laboratory in ETH Zürich (Shao, 2003), and IDB Index Database, which has been developed in the University of Bonn (Henrich, 2009) presented extraordinary search features and an extensive index library. Among the search options were the traditional ones, such as name, application satellite, scope of use, author or year of development.
Analogously, the present system allows this type of more traditional searches. The new contribution to this set of functionalities is the search capability based on the wavelength ranges used in the index compute. In this way the search request could be made for all those indices whose performance bands were comprised within a range of wavelengths specified by the user.
This relevant advantage answers to the practical needs of the scientific community, obtaining immediately possible candidates to work with the spectral bands of interest. This fact is especially relevant for hyperspectral images, which exhibit an enhanced spectral resolution which allows extracting novel information for a target of interest, such as derivative features.
3. DESCRIPTION OF THE SYSTEM
3.1 Technological description
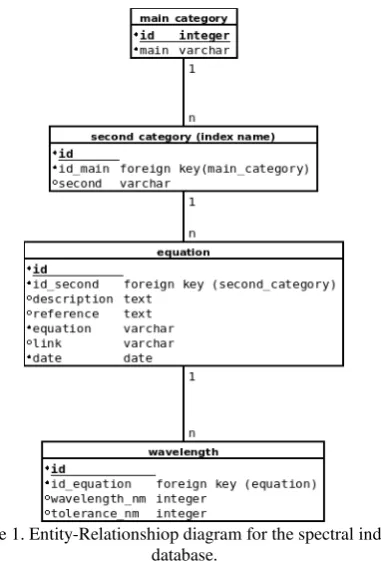
The structure chosen for the database is relational, implemented with MySQL. The simple Entity-relationship diagram defined is sketched in Fig. 1.
Figure 1. Entity-Relationshiop diagram for the spectral indices database.
The option selected for the web server on which the application is hosted is Apache. Also, the language used in "back-end" is PHP. For the "front-end", HTML5 has been used (HTML + CSS3 + JavaScript).
Given the final technological configuration of the system, the use of the XAMPP platform was considered. This platform consists of an Apache web server that integrates the previously mentioned technologies. It is important to point out that all the software used is “open source”.
3.2 Functionalities
The main functions of the application are the following:
Main category insertion
Secondary category insertion
New index insertion
Index searching
The International Archives of the Photogrammetry, Remote Sensing and Spatial Information Sciences, Volume XLII-3/W3, 2017 Frontiers in Spectral imaging and 3D Technologies for Geospatial Solutions, 25–27 October 2017, Jyväskylä, Finland
This contribution has been peer-reviewed.
Figure 2. Homepage of the web-based tool, containing direct access to all functionalities.
The insertion of new information by a user is carried out through the platform itself. The quality control mechanism of the system is activated by sending a mail of new insertion to the address of the registered administrator. The administrator is therefore able to check the integrity and quality of the inserted entry before this is actually added to the database. This procedure is triggered whenever a new field of application or specific spectral index is introduced; also in order to avoid redundant entries, the homepage of the web-based tool is reported in Fig. 2. The main functions listed above are accessible directly from this page.
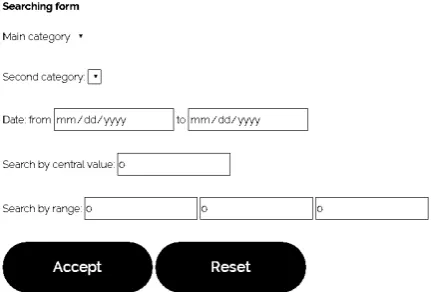
The insertion of index or selection data is carried out in all cases through forms. The search form is reported in Fig. 3.
Figure 3. Available input parameters for the search form.
The most interesting search option is "wavelength", which offers both the possibility of inserting a central wavelength along with a lateral tolerance value, and the insertion of a spectral range by defining a minimum and maximum wavelength.
The available input parameters to be used in a query to the system and the information retrieved for each set of results are:
Main category (Vegetation, Hydrology, …)
Secondary category (NDVI, SAVI, EVI, …).
Date of publication.
Description.
Reference paper or resource.
Equation.
Link to online resources.
Used wavelengths: point and range
Using main category we indicate a generic field of application such as vegetation, soil, and water, and with secondary category a specific index or family on indices, such as NDVI. This is useful because for the same physical parameter or feature of interest several indices with the same name may have been defined from different authors, often yielding quite different results (Bannari, 1995).
3.3 Case of use
The most interesting example for a case of use of the presented tool is to search for a certain index using a wavelength and a tolerance, which expresses the maximum distance allowed from the input wavelength. This additional parameter is justified by the fact that some indices are based on very narrow spectral bands (such as gelbstoff analysis in water), while others capture the information in broader portions of the spectrum (NDVI).
In this example it is desired to find a vegetation index employing wavelengths around 900 nm with a tolerance of 50 nm. The query was carried out only using the input wavelengths, while other search fields were left blank. The system accepts a query if at least one input field is entered. After accessing the tool via any browser as in Fig. 1, and after accessing the query section, the relevant data are inserted in the corresponding field of the tool.
Once the query has been sent and after receiving the response from the server, the user can visualize a list containing all the relevant results, if there is any.
The query described above returned the following index (Tan, 2013) and related information:
Main category: Vegetation
Secondary category: NDVI
Date: 2013
Description: “Normalized Difference Vegetation Index which uses R685 band and NIR900 band”
Reference: “Tan C., Arindam S., 2013, Using hyperspectral vegetation indices to estimate the fraction of photosynthetically active radiation absorbed by corn canopies. International Journey of Remote Sensing, Vol. 34 Nº 24”
URL:
Wavelength: 685 – 900 nm; 685 nm; 900 nm
Equation:
� =
��� 00−���� 00+�
where NIR900 = reflectance at 900 nm R685 = reflectance at 685 nm
As the system is only in a test phase only one result has been retrieved, but as the database grows larger such query could return several versions of NDVI.
4. CONCLUSIONS AND FUTURE DEVELOPMENT
The objective of this document is to present a tool which has been developed to solve the specific needs demanded by both the scientific community and ad hoc applications related to the field of hyperspectral remote sensing The fundamental objective of the project is the creation of a database that centralizes all the The International Archives of the Photogrammetry, Remote Sensing and Spatial Information Sciences, Volume XLII-3/W3, 2017
Frontiers in Spectral imaging and 3D Technologies for Geospatial Solutions, 25–27 October 2017, Jyväskylä, Finland
This contribution has been peer-reviewed.
information referring to hyperspectral indices in a single tool, enabling searching in a spectral indices database enabling the use of a given wavelength or spectral range as input parameters for the queries . The hope for the future is that this tool would not be limited to provide quick access to the required indexes by a professional or scientist for a long list of practical application, but rather that it becomes a point of reference for the whole hyperspectral community, in which innovations resulting from different lines of research could be consulted and dynamically updated, as well as serve as an aid for the publication of new indices by the members of the hyperspectral community.
In this sense, the scope of this objective is ambitious and requires the collaboration of numerous entities and agents to guarantee its viability in a wider scope.
A relevant aspect to take into account when opening the remote access to the database is that of security. The future development of the tool goes through its migration to the PHP framework Laravel. This framework provides basic login and security features, among others, as well as a better adaptation of the code to the modern MVC web application deployment standards.
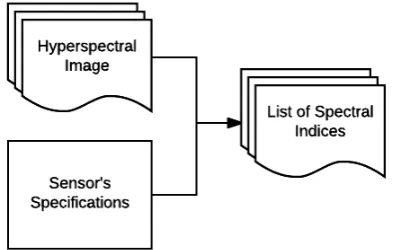
Figure 4. Automatic generation of all available indices which are possible to compute using an image of known characteristics.
Given the evolution of the system, the most significative issues include the automation of processes or the involvement of the sensors themselves in the extraction of relevant information from the database.
It should be noted that this is an open project, with the appearance of new and updated technologies allowing constant and dynamic improvements of the tool.
A possible future development would be to automatically derive all possible spectral indices given a certain hyperspectral image, as sketched in Fig. 4. The system would read the spectral bands and their characteristics from the header file or metadata associated to the image, and yield in output all the spectral indices which is possible to compute, ideally separating them hierarchically according to the main and secondary categories of the index. The use of a defined and structured ontology for the indices of interest would be necessary for this scope. .
An interesting application which could be carried out by expanding the presented tool would be the determination of the most appropriate bands of a given sensor for the computation of a specific index. The input to the system in this case would be a list of the characteristics of a hyperspectral sensor, including the
Signal-to-noise ratio of each band, and an index, so that, the system could return which bands are more suitable to calculate the index from the information offered by the sensor. This would facilitate the reduction of hyperspectral information relevant to the given application, and help in supporting the decision making regarding the processing of a band with noise.
REFERENCES
Shao H., 2003, ZuBuD. ETH Zürich Computer Vision Lab. Available at: http://www.vision.ee.ethz.ch/showroom/zubud
Henrich, V., Jung, A., Götze, C., Sandow, C., Thürkow, D., Gläßer, C., 2009, “Development of an online indices database: Motivation, concept and implementation”. 6th EARSeL Imaging Spectroscopy SIG Workshop Innovative Tool for Scientific and Commercial Environment Applications Tel Aviv, Israel, March 16-18, 2009. Available at: http://www.indeatabase.de/
Tan C., Arindam S., 2013, “Using hyperspectral vegetation indices to estimate the fraction of photosynthetically active radiation absorbed by corn canopies”. International Journey of Remote Sensing, Vol. 34 Nº 24
Haboudane D., Miller J., Patteyc E., Zarco-Tejada P., Strachane I., “Hyperspectral vegetation indices and novel algorithms for predicting green LAI of crop canopies: Modelling and validation in the context of precision agriculture”. Remote sensing of Environment 90. December 2003
Bannari, D., Morin D., Bonn F., Huete A. R.. "A review of vegetation indices". Remote Sens. Rev., vol. 13, no. 1, pp. 95-120, 1995.
The International Archives of the Photogrammetry, Remote Sensing and Spatial Information Sciences, Volume XLII-3/W3, 2017 Frontiers in Spectral imaging and 3D Technologies for Geospatial Solutions, 25–27 October 2017, Jyväskylä, Finland
This contribution has been peer-reviewed.